Identifying Doxycycline Hydrochloride and Tylosin in Chicken Using Surface-Enhanced Raman Spectroscopy
Because antibiotics are regularly used for chicken, food safety is of utmost importance, and health experts pay attention to the effect antibiotics could have on human health. This study examines how surface-enhanced Raman spectroscopy (SERS) was used to identify two antibiotic residues in chicken, doxycycline hydrochloride (DCH) and tylosin (TYL). A single-factor experiment method was adopted to optimize the SERS detection conditions. Results show that the SERS intensities of the chicken samples containing DCH and TYL had greater effectiveness in the peaks of 672 and 771 cm-1 under gold nanoparticles (Au NPs) as the enhancement substrate at 10 min of the optimal adsorption time. The original SERS spectra were pretreated using the method of adaptive iterative penalty least square (air-PLS) and the second derivative, where the feature vectors were extracted by principal component analysis (PCA). The first four principal component scoring was selected as the input values of linear discriminant analysis (LDA) with an overall classification accuracy of 100% for the test set. The experimental results show that SERS technology can identify DCH and TYL in chicken.
With the rapid development of social industrialization and economization, meat, eggs, milk, and dairy products have gradually become an essential part of the contemporary diet because of the continuous improvement in the modern standard of living (1). Meanwhile, an increasing number of problems related to animal food safety have emerged around the world (2). Recently, antibiotics have been widely used in poultry to treat infectious diseases and accelerate growth (3). Tylosin (TYL), a 16-membered macrolide compound produced by the culture solution of Streptomyces fradiae, has been used as a special veterinary drug, promoting growth and treating mycoplasma in chicken. Furthermore, doxycycline hydrochloride (DCH), a semi-synthetic broad-spectrum antibiotic derived from oxytetracycline, was frequently considered as a feed additive in chicken farms. However, if chickens were overfed DCH and TYL, the two antibiotic residues may not be completely metabolized in chicken. As a result, they can cause allergic or toxic reactions, posing a potential threat to human health.
The common detection methods used for antibiotics were microbiological inhibition methods (4), high performance liquid chromatography–tandem mass spectrometry (HPLC–MS) (5), and immunoassay (6). Although these methods were simple to operate and inexpensive, they had stricter requirements for sample pretreatment and a time-consuming detection process, which made it difficult to meet the requirements of rapid detection of DCH and TYL residues in chicken. Therefore, a rapid, nondestructive, and sensitive detection method of DCH and TYL residues in chicken needed to be implemented.
Surface-enhanced Raman spectroscopy (SERS), a simple and ultrasensitive analysis technique, was characterized by simple sample preparation and the nondestructive and fast spectral collection (7,8). Some metals, including silver or gold nanoparticles (NPs), were used as SERS enhancement substrates (9). With the advantages of SERS technology, SERS has been widely used in food safety detection and has been utilized to detect pesticide residues on fruit surface (10), veterinary drug residues in animal (11), and food-borne pathogenic microorganisms in food (12). Peng and others used SERS technology to detect TYL residues in water, establishing a good linear relationship between TYL concentrations and Raman intensities to conduct quantitative analysis for TYL in water (13). Lee and others adopted a SERS method for the qualitative and quantitative analysis of chlortetracycline and oxytetracycline in animal feed, resulting in the real-time monitoring and screening of tetracycline drugs in animal feed (14). Premasiri and others identified 12 bacterial strains of urinary tract infections (UTI) with a sensitivity of more than 95% and a specificity of more than 99% by using the partial least-squares discriminant analysis (PLS-DA) classification method (15). However, there is not yet research on identifying DCH and TYL residues in chicken. Hence, there is a need for a rapid method of detection of identifying DCH and TYL residues in chickens using SERS technology.
In this study, TYL and DCH residues in chicken could be rapidly identified using SERS combined with multivariable technology. The four spectral pretreatments— adaptive iteratively reweighted penalized least squares (air-PLS) and normalization, air-PLS and standard normal variate (SNV), air-PLS and first derivative, and air-PLS and second derivative—were performed on the raw SERS spectra. The principal component scoring was selected as the inputs for the support vector machine (SVM) model, and the linear discriminant analysis (LDA) model established the corresponding prediction models and compared their classification effects. The experiment results provided a theoretical basis for identifying antibiotic residues in animal-derived food.
Materials and Methods
Reagents and Materials
DCH (99%) and sodium chloride (NaCl) were purchased from Nanchang Jingke Scientific Instrument Co. Ltd. TYL (98%) was provided by Dr. Ehrenstorfer from Germany. Gold (III) chloride trihydrate (HAuCl4· 3H2O) with a gold content of no less than 49% was obtained from Sigma-Aldrich. Trisodium citrate was analytical grade (Xilong Chemical Co., Ltd.). Ultrapure water used throughout the experiments was extracted by an automatic reverse osmosis (RO) pure water machine (Hunan Colton Water Co., Ltd.). The fresh chicken breasts bought from Hualian supermarket in Nanchang, China, were placed in the sterile vacuum bag and kept in the laboratory refrigerator at −20 °C before use.
Experimental Method
Preparation of Solution
We obtained 0.04 g/L DCH and TYL standard solutions by dissolving 0.02 g DCH and TYL standards with ultrapure water, respectively. Next, these different concentration gradients of DCH solution, TYL solution, and DCH and TYL solution (0.005~0.035 g/L) were obtained by diluting by DCH or TYL standard solutions with ultrapure water.
Sample Preparation
The chicken breasts were cut promptly into slices after they were taken out from the refrigerator, and they were dried in an FD-1A-50 vacuum freeze dryer (Beijing Medical Laboratory Instrument Co. Ltd.) for 24 h. The dried chicken slices were sheared into equal square pieces. Subsequently, they were dipped in DCH solution, TYL solution, and the DCH and TYL solution to obtain three groups of the spiked chicken samples. The untreated fresh chicken samples were the chicken samples without DCH and TYL (the blank group).
Synthesis of Gold NPs
Gold NPs were synthesized by a seed growth method using sodium citrate that is mentioned in the literature (16). All glassware was soaked by freshly prepared aqua regia for 24 h before using and then washed completely by ultrapure water. Then, 150 mL of 2.2 mM sodium citrate solution was placed in a three-neck round bottom flask to a rolling boil for 15 min (ZNCL-T intelligent constant temperature agitator, Yarong Instrument Co. Ltd.). Next, 1 mL of 25 mM HAuCl4 solution was added after the solution boiled. In the meantime, the color gradually changes in the solution could be observed from yellow to blue-gray and to light pink within 10 min. When the above solution cooled to 90 °C, 1 mL sodium citrate solution (60 mM) was added at once, and then 1 mL of 25 mM HAuCl4 solution was added approximately 2 min later. The reaction solution was removed in 2 mL aliquots when stirring for 30 min. By that repeating growth process 14 times, gold NPs with progressively larger sizes were obtained. Eventually, the gold NPs colloid was cooled and stored at 4 °C for further use.
Raman Spectral Measurement
For the next part of the study, 30 μL of gold NPs was dripped onto the chicken samples, and then their spectra were measured using a DXR micro-Raman spectrometer (Seymour Fisher Technology Co., Ltd.) with an adsorption time of 10 min. Here, the instrument parameters were set as follows: 18.9 mW of the laser energy, 5 s of collect exposure time, 10 s of preview collection time, 10 times of sample exposures, and 16 times of background exposures. For identifying the four groups of chicken samples, the SERS spectrum of each sample was collected only once, and a total of 400 samples were obtained. Among them, two-thirds (268) of the samples were randomly selected as a training set to establish the discrimination model, and the rest (132) was used as a test set to verify the classification accuracy.
Optimization of Test Conditions
Adsorption time was one of the important factors affecting SERS intensity. To enhance SERS signal intensities of DCH and TYL in chicken, the adsorption time was optimized in this paper. According to the single factor experiment method, the SERS spectra of samples were measured at 0, 2, 4, 6, 8, 10, 12, and 14 min of adsorption time, respectively, after 30 μL gold NPs were dropped on chicken samples containing DCH and TYL. The SERS spectra of five parallel samples, of which the average spectrum was taken as the SERS spectrum at each adsorption time, were measured for each adsorption time point. The optimal adsorption time was determined by comparing the SERS intensities of the characteristic peaks at 672 and 771 cm-1.
Also, different SERS enhancement substrates could produce different enhancement effects on the SERS signal of chicken samples. In this regard, 30 μL gold NPs and 30 μL gold NPs mixed with 50 μL NaCl (0.1 g/L) were added onto chicken samples containing DCH and TYL, and then their SERS spectra were measured at 10 min of adsorption time. Five parallel samples were processed for each enhancement method (gold NPs and gold NPs mixed with NaCl), and their average spectrum was taken as a SERS spectrum of each enhancement substrate. The SERS enhancement substrate was determined by comparing the SERS intensities of the characteristic peaks at 672 and 771 cm-1.
Spectra Data Processing
The SERS spectral data in the range of 400 to 1800 cm-1 were selected to make processing analysis. After some useless background noises in the original, SERS spectra were deducted through the air-PLS algorithm carried out in Matlab 2014a software (The Mathworks, Inc.). The second derivative was processed using the Unscrambler X10.4 (Camo). Next, feature vectors were extracted using the PCA method on the Unscrambler X10.4. The numbers of principal component scoring were chosen by analyzing the PCA scoring chart, and they were used as the input values of classification recognition models (SVM and LDA). The best classification recognition model was determined by comparing the results of discrimination for four groups of chicken samples. To improve the classification accuracy, the best spectral preprocessing method was selected based on the total classification accuracy of the test set by comparing four kinds of preprocessing methods (air-PLS and normalization, air-PLS and SNV, air-PLS and first derivative, and air-PLS and second derivative). The sensitivities and specificities of the four groups of samples were calculated to examine the ability of correct classification for each group of samples.
Results and Discussion
SERS Spectral Analysis
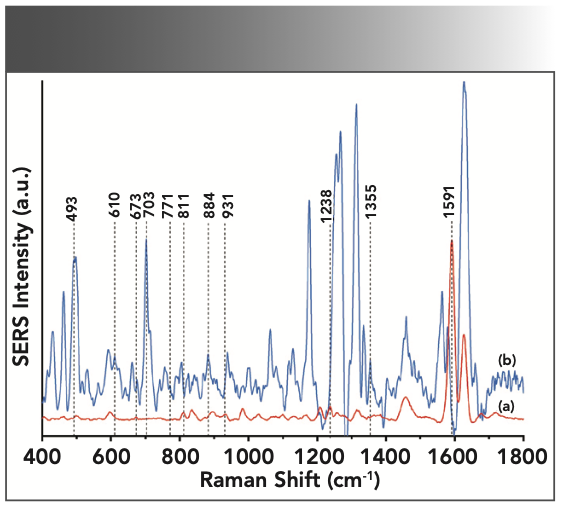
The SERS spectra of the DCH and TYL standards from 400 to 1800 cm-1 were presented in Figure 1. The SERS characteristic peaks of TYL standard at 673, 811, 931, 1238, and 1591 cm-1, which didn’t overlap with those of the DCH standard, could be observed. These peaks could be used as the characteristic peaks to identify TYL from these two standards. Similarly, 493, 610, 703, 771, 884, and 1355 cm-1 were regarded as the SERS characteristic peaks to distinguish DCH from these two standards. However, whether these peaks could be used as SERS characteristic peaks to identify DCH and TYL in chicken still needed further analysis.
FIGURE 1: The SERS spectra of (a) TYL and (b) DCH standards.
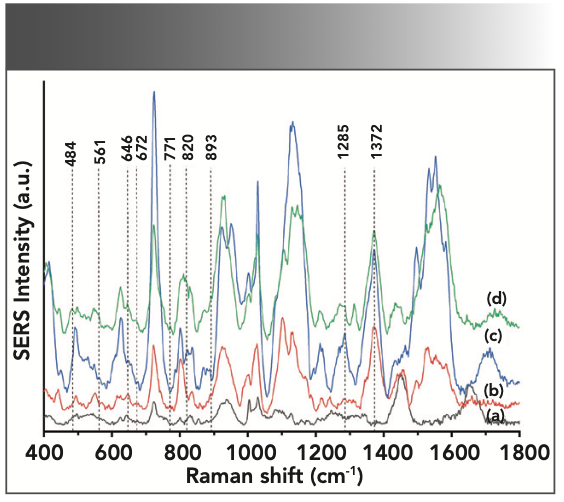
To confirm whether DCH and TYL in chicken could be identified, the average spectra of four groups of samples (blank group in curve a, DCH group in curve b, TYL group in curve c, and DCH+TYL group in curve d) can be seen in Figure 2. The SERS characteristic peaks of the DCH and TYL group at 484, 561, 646, 672, 771, 820, 893, 1285, and 1372 cm-1 were not repeated with those of the blank group. Thus, these peaks were preliminarily determined to distinguish DCH or TYL residues in chicken. Further comparing and analyzing the SERS spectra of the DCH group and the TYL group, the palpable SERS peaks of the DCH group were at 646, 771, 893, 1285, and 1372 cm-1, and the peaks of the TYL group at 561, 672, 820, 1285 and 1372 cm-1 could be observed. The SERS peaks of these two groups of DCH and TYL were not overlapped at 561, 672, 771, 820, and 893 cm-1, and the SERS peaks at 646, 1285, and 1372 cm-1 concurrently belonging to these two groups could not be considered SERS-identified peaks of DCH or TYL in chicken. The results illustrated that at 561, 672, 771, 820, and 893 cm-1 could be used as the SERS characteristic peaks of DCH and TYL residues in chickens. Considering whether these peaks truly belong to DCH and TYL, 672 and 771 cm-1 could be used as the characteristic peaks of DCH and TYL by analyzing the characteristic peaks of standard in Figure 1. The Raman peak of DCH in chicken was blue-shifted to 672 cm-1 compared with that of DCH standard at 673 cm-1. Therefore, 672 and 771 cm-1 could be regarded as SERS characteristic peaks to identify DCH and TYL in chicken.
FIGURE 2: The average SERS spectra of samples for four groups: (a) Blank group, (b) DCH group, (c) TYL group, and (d) DCH and TYL group.
Effect of Optimization Conditions on SERS Intensities
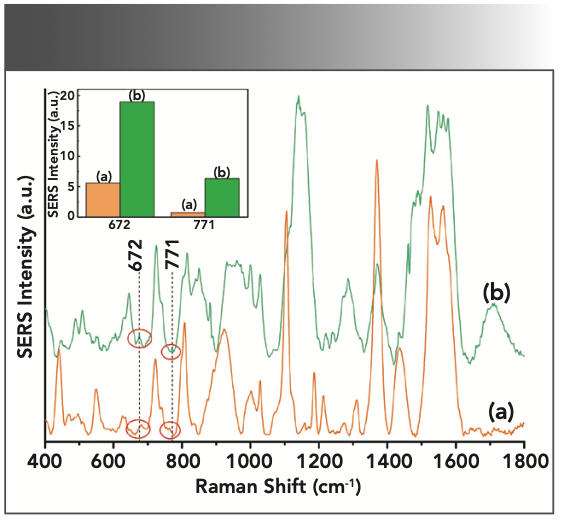
When the molecules of DCH and TYL aggregate on the rough surfaces of gold NPs with adsorption capacity, the Raman intensities of for both can be enhanced (17). When NaCl, magnesium sulfate, and other electrolytes are selected as emulsifying agents, their Raman intensities may be further increased or decreased (18). Therefore, the enhancement effect of NaCl on SERS intensities for chicken samples containing DCH and TYL was investigated in this paper. As observed from the illustration in Figure 3, SERS intensities at 672 and 771 cm-1 in the curves A were lower than those in curve B. The addition of Cl- can promote the polymerization of gold NPs, and plenty of hotspots would be generated to further enhance the SERS enhancement effect in this process. However, the SERS enhancement effect can be also inhibited in the case of a large amount of Cl-, because of the decline of the surface area ratio of gold NPs to the measured molecules following the growing amount of Cl- (19). From this, gold NPs were chosen as SERS enhancement substrate in the follow-up experiments.
FIGURE 3: The representative spectra of DCH and TYL group: (a) 30 μL gold NPs mixed with 50 μL NaCl (0.1 g/L) solution, (b) 30 μL of gold NPs. The inset was the mean SERS intensities at 672 and 771 cm-1.
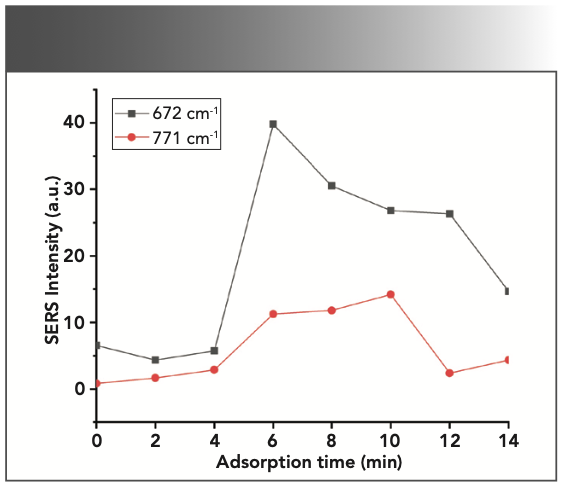
The adsorption time of molecules on the rough surface of gold NPs had a vital impact on the enhancement of SERS intensities. The influence of diverse adsorption time on SERS intensities of chicken samples containing DCH and TYL are displayed in Figure 4. In the range of 0 to 14 min, a large SERS intensity was found at 672 cm-1 when the adsorption time reached 6 min. If 6 min was selected as the best adsorption time, the detection limit of DCH in chicken would be affected because SERS intensity at 771 cm-1 was relatively weaker than that at 672 cm-1. When the adsorption time was extended to 10 min, SERS intensity at 771 cm-1 gradually reached the topical maximum, and the peak intensity at 662 cm-1 was also higher than that at 771 cm-1. Hereby, 10 min was used as the best adsorption time.
FIGURE 4: The effect of the different adsorption times on SERS intensities.
Classification Results of SERS Spectral Data
Spectral pretreatment has played an important role in near-infrared (NIR), Raman, and other spectral analysis. Because of the interference of emission noise, background noise, or instrument noise in the process of SERS spectrum acquisition, the spectral data inevitably contains some useless information.
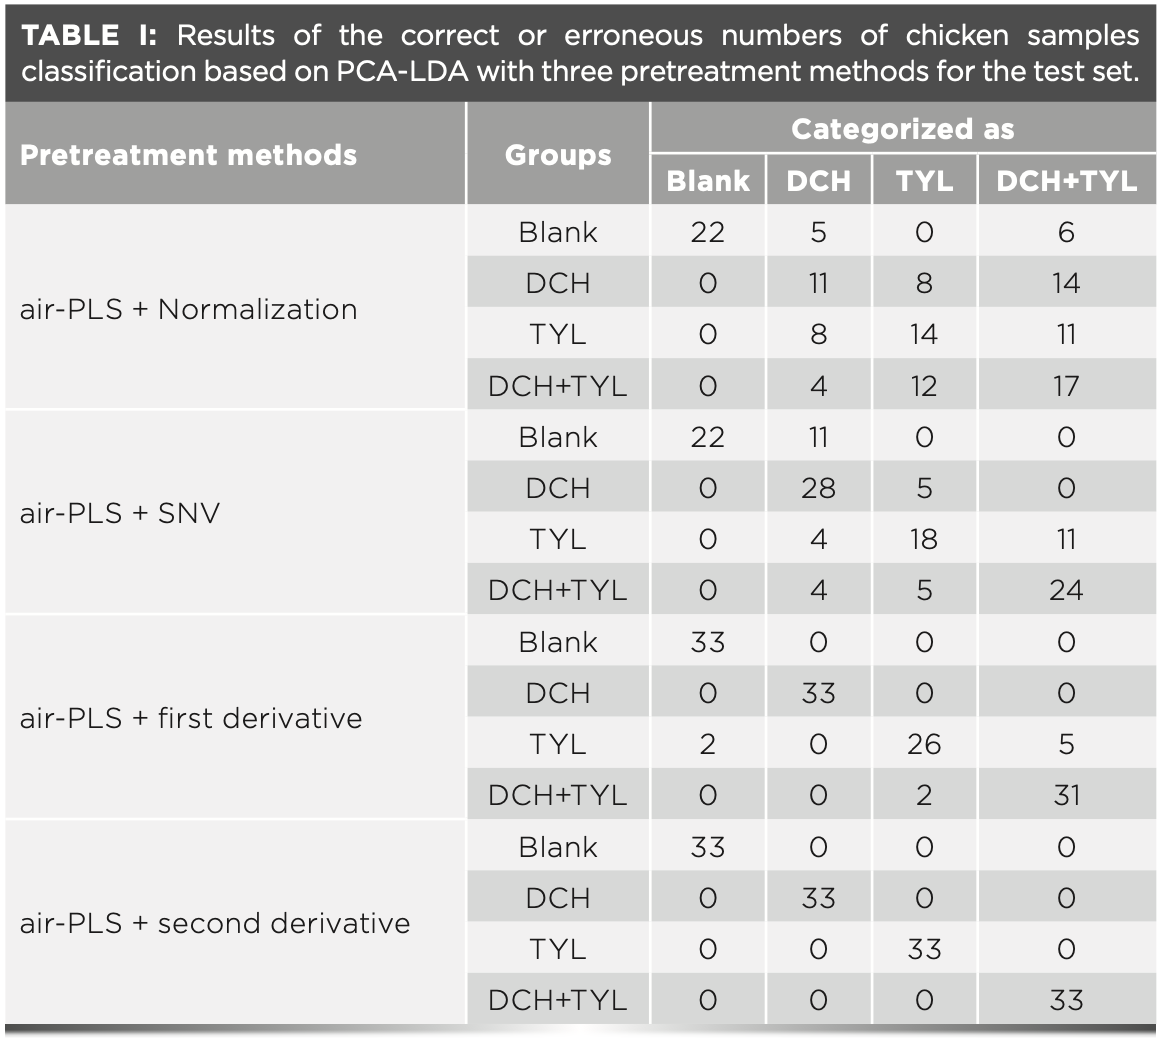
Consequently, it was essential to preprocess the SERS spectra of samples to improve the classification accuracy of samples. In this study, four spectral pretreatment methods were investigated; these pretreatment methods were air-PLS and normalization, air-PLS and SNV, air-PLS and first derivative, and air-PLS and second derivative. Table I revealed the results of numbers of chicken samples were classified correctly or incorrectly for the test set (n = 132) with four pretreatment methods based on PCA-LDA. By comparing the classification results for these four spectral preprocessing methods, air-PLS and normalization and air-PLS and SNV had relatively few correct numbers, and their classification accuracies were 48.5% and 69.7%, respectively. Nevertheless, air-PLS and SNV and air-PLS and second derivative had higher classification accuracies than the abovementioned preprocessing, and they were 93.1% and 100%, respectively. Thus, air-PLS and second derivative was selected as the optimum pretreatment method for classifying the four groups of chicken samples.
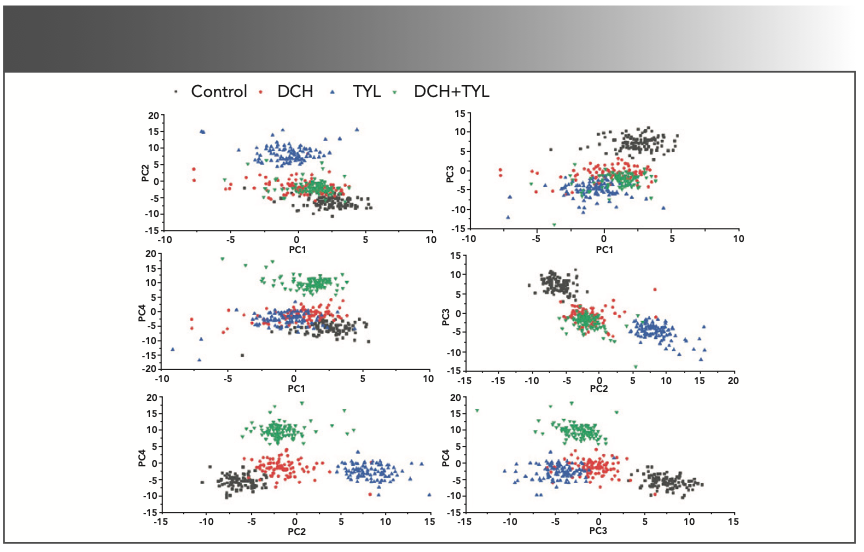
Principal component analysis (PCA), a multivariate statistical analysis technique, could be operated with the help of singular value disintegration of the data matrix or feature disintegration of the variance-covariance matrix (20). The SERS spectra pretreated of air-PLS and second derivative were performed in the PCA, and the two-dimensional (2D) scoring scatters diagram of the first four PCA were drawn as shown in Figure 5. In the scoring diagram of PC1 and PC2, the TYL group was separately concentrated in the upper area whereas the other three groups overlapped and crossed in the lower part, which showed that the TYL group could be identified from four groups samples. The blank group was separated and distributed in a certain area in the scoring diagram of PC1–PC3, PC2 and PC3, and PC3 and PC4. The DCH and TYL group was located in the upper left corner without overlaying and intersecting with the blank group, DCH group, or the TYL group in the scoring diagram of PC1–PC4, PC2–PC4, and PC3 and PC4. Because the DCH and TYL group did not overlay with the other three groups, it illustrates that the blank group and the DCH and TYL group could be effectively screened from the four groups of chicken samples. The DCH group was assembled with a spot of blank group samples through PC2–PC4 analysis, so the DCH group could not be split accurately from the blank group. According to the analysis of the scoring diagram of the first four PCA for the training set, the PCA algorithm was not able to completely distinguish these four groups of chicken samples. Therefore, the LDA model using the first four PCA scoring as the input values was established to increase the feature discrepancy of the four groups to availably filter and discriminate for them.
FIGURE 5: Two-dimensional (2D) scoring scatter diagrams of the first four PCA for the training set. Principal component (PC) numbers are labeled on each axis as PC1, PC2, PC3, and PC4.
LDA is a supervised learning method based on linear projection (21). SVM is a statistical learning way to identify, classify, and regression analyze for samples (22). To obtain better classification effects on four groups of chicken samples, PCA-LDA and PCA-SVM were used to build the classification models. According to the accuracy of modeling for the training set, the results explored that the classification accuracy of the SVM model was 99.6% with the optimal values of parameters C = 10 and g = 0.1, and classification accuracy of the LDA model for the training set was 98.5% under the condition of assumption prior probability equality (each chicken sample equivalently was selected) and keeping linear method. The classification accuracy of the SVM model for the test set was 97%, and yet the classification accuracy of the LDA model could reach 100%, which showed that four groups of samples were classified well using the LDA model. Accordingly, LDA was used as the optimal model for the classification of four groups of chicken samples. The sensitivity and specificity values of four groups of samples for the test set were revealed in Table II. The four groups of samples had poor sensitivity and specificity using the spectral pretreatment methods of air-PLS and normalization and air-PLS and SNV, which could not live up to the effect of exhaustive distinction. As far as the PCA-LDA model based on air-PLS and first derivative was concerned, the sensitivity values and the specificity values were 78.8–100% and 92.8–100%, respectively. The sensitivity value and the specificity value of the PCA-LDA model were 100% and 100% using air-PLS and second derivative as pretreatment method, respectively, which showed that this pretreatment method could correctly classify and sensitively distinguish each group from other groups. To summarize, this sensitive and rapid method of the identification of DCH and TYL residues in chicken could be applied as a detection means of chicken quality and safety issues in the future.

Conclusion
A rapid identification method for DCH and TYL residues in chicken was investigated based on SERS technology combined with multivariate data analysis. The influences of two kinds of enhancement substrates and adsorption time on SERS intensities were analyzed. The results certified that the SERS intensities of characteristic peaks of chicken samples could be enhanced by using gold NPs as enhancement substrates at 10 min of adsorption time. Air-PLS and second derivative were selected as the optimal spectral preprocessing methods after comparing four spectral preprocessing methods. The first four PCA scoring were used as the input values of the LDA model with a total accuracy of 100% for the test set. In conclusion, DCH and TYL residues in chicken could be identified based on SERS technology combined with a multivariate discriminant model.
Conflicts of interest
The authors declare that they have no competing interests.
Acknowledgments
This work has been financially supported by National Natural Science Foundation of China (no. 31660485) and Science and Technology Research Project of Jiangxi Education Department, China (no. GJJ160350).
References
(1) C.P. Haskins, G. Henderson, and C.E. Champ, Crit. Rev. Food Sci. Nutr. 59(17), 2709–2719 (2019).
(2) M. van Asselt, P.M. Poortvliet, E.D. Ekkel, B. Kemp, and E.N. Stassen, Poult. 97(2), 607–619 (2018).
(3) L. Canton, L. Alvarez, C. Canton, L. Ceballos, C. Farias, C. Lanusse, and L. Moreno, Food Addit. Contam. Part A Chem. Anal. Control Expo. Risk Assess. 36(7), 1055–1067 (2019).
(4) Q. Wu, X.Y. Peng, and Y.L. Wang, Microchem. 152, 1–13 (2019).
(5) S. Susakate, S. Poapolathep, C. Chokeja- roenrat, P. Tanhan, J. Hajslova, M. Giorgi, K. Saimek, Z. Zhang, and A. Poapolathep, J. Food Drug Anal. 27(1), 118–134 (2019).
(6) K. Zeng, X. Zhang, D. Wei, Z. Huang, S. Cheng, and J. Chen, Int. J. Food Sci. 55(1), 119–126 (2019).
(7) B. Yang, S.L. Jin, Y. Wang, H.W. Bao, J.M. Sun, L. Chen, H. Chung, and Y.M. Jung, Appl. Spectrosc. Rev. 54(10), 856–872 (2019).
(8) J.H. Cai, Y.C. Li, C.F. Liu, and X.Y. Wang, ACS Sustain. Chem. Eng. 7(18), 15154–15162 (2019).
(9) L.F. Xie, J.L. Lu, G.Y. Chen, T. Liu, and Z.Q. Tian, J. Phys. Chem. Lett. 11(3), 1022–1029 (2020).
(10) B.X. Hu, D.W. Sun, H.B. Pu, and Q.Y. Wei, Talanta 217, 120998 (2020).
(11) G.H. Yang, X.J. Fang, Q. Jia, H.X. Gu, Y.P. Li, C.Q. Han, and L.L. Qu, Microchimice Acta. 187(5), 310 (2020).
(12) X.H. Wang, T.T. Xu, Y.Q. Huang, K.Q. Lai, and Y.X. Fan, Spectroscopy and Spectral Analysis (Guang Pu Xue Yu Guang Pu Fen Xi) 39(1), 123–129 (2014).
(13) Q.Y. Peng, X.Y. Kang, and Q. Zhang, Int. J. Sci. Technol. Eng. 19(23), 316–322 (2019).
(14) K.M. Lee, D. Yarbrough, M.M. Kozman, T.J. Herrman, J. Park, R. Wang, and D. Kurouski, Food Control 114, 107243 (2020).
(15) W.R. Premasiri, Y. Chen, P.M. Williamson, D.C. Bandarage, C. Pyles, and L.D. Ziegler, Anal. Bioanal. Chem. 409(11), 3043–3054 (2017).
(16) N.G. Bastus, J. Comenge, and V. Puntes, Langmuir 27(17), 11098–11105 (2011).
(17) C. Battocchio, F. Porcaro, S. Mukherjee, E. Magnano, S. Nappini, and I. Fratoddi, J. Phys. Chem. C. 118(15), 8159–8168 (2014).
(18) Y.X. Luan, J.Y. Chen, G. Xie, C. Li, H. Ping, Z.H. Ma, and A.X. Lu, Microchim. Acta. 182(5), 995–1001 (2015).
(19) M.B. Pamela, Nanomaterials 7(6), 142 (2017).
(20) I. Goldenberg and G.I. Webb, Knowl. Inf. Syst. 62(7), 2835–2854 (2020).
(21) X.Y. Cui, T. Liu, X.S. Xu, Z.Y. Zhao, T.Y. Zhao, S. Chen, Z. Wang, Y.D. Wang, D.Y. Hu, S. Shan, G.Y. Sun, J.R. Sun, K.X. Song, and Y. Zeng, Spectrochim. Acta A Mol Biomol. Spectrosc. 240, 118543 (2020).
(22) Z. Zhang, Y. Luo, X. Deng, and W. Luo, Technol. Health Care 28(S1), 197–205 (2020).
Ting Wang, Haichao Yuan, Muhua Liu, Xiongfei Chen, Shuanggen Huang, Jinhui Zhao, Jian Chen, Sha Zhang, and Ning Xu are with the Key Laboratory of Modern Agricultural Equipment in Jiangxi Province and the College of Engineering at Jiangxi Agricultural University in Nanchang, China. Direct correspondence to: 9115328@qq.com ●
NIR Spectroscopy Explored as Sustainable Approach to Detecting Bovine Mastitis
April 23rd 2025A new study published in Applied Food Research demonstrates that near-infrared spectroscopy (NIRS) can effectively detect subclinical bovine mastitis in milk, offering a fast, non-invasive method to guide targeted antibiotic treatment and support sustainable dairy practices.
Nanometer-Scale Studies Using Tip Enhanced Raman Spectroscopy
February 8th 2013Volker Deckert, the winner of the 2013 Charles Mann Award, is advancing the use of tip enhanced Raman spectroscopy (TERS) to push the lateral resolution of vibrational spectroscopy well below the Abbe limit, to achieve single-molecule sensitivity. Because the tip can be moved with sub-nanometer precision, structural information with unmatched spatial resolution can be achieved without the need of specific labels.
New AI Strategy for Mycotoxin Detection in Cereal Grains
April 21st 2025Researchers from Jiangsu University and Zhejiang University of Water Resources and Electric Power have developed a transfer learning approach that significantly enhances the accuracy and adaptability of NIR spectroscopy models for detecting mycotoxins in cereals.
AI-Powered SERS Spectroscopy Breakthrough Boosts Safety of Medicinal Food Products
April 16th 2025A new deep learning-enhanced spectroscopic platform—SERSome—developed by researchers in China and Finland, identifies medicinal and edible homologs (MEHs) with 98% accuracy. This innovation could revolutionize safety and quality control in the growing MEH market.