A Look at Rapid Quantification of PFAS in Non-Potable Waters
Special Issues
The presence of per- and polyfluoralkyl substances (PFAS) in water is an important health and environmental concern. Liquid chromatography–mass spectrometry (LC–MS) has been established as the most suitable technology for monitoring these substances. A method is described, using EPA 8327, for PFAS analysis in groundwater, surface water, and wastewater.
Environmental scientists have documented a dramatic increase in the public interest about the occurrence of per- and polyfluoralkyl substances (PFAS) in water. Liquid chromatography mass spectrometry-based PFAS detection (LC–MS) has been established as the most suitable technology for monitoring these substances. Implementing robust methodologies for targeted monitoring, identification, and emergency response to emerging PFAS is challenging. Despite a vast PFAS-related scientific knowledge base, a lack of access and training for LC–MS instruments is a primary hurdle for expanded monitoring and identification. This paper presents data acquired according to draft method EPA 8327. This method requires minimal sample preparation and adequately assesses PFAS in various environmental samples, including groundwater, surface water, and wastewater.
Per- and polyfluoralkyl substances (PFAS) are a class of more than 5,000 man-made and commercially available chemicals (1). PFAS are stable, and have water, oil, grease, and heat-resistant properties. These substances have been extensively used in the manufacturing of industrial (such as firefighting foams) and household (such as carpets, clothing, cookware, and food packages) products since the 1940s. The properties of PFAS that assist manufacturers in producing durable products are also responsible for their persistence in the environment and human body. Therefore, PFAS are resistant to biodegradation and other conventional remediation technologies. Possible health effects in humans and animals from exposure to PFAS have been reported, including increased risk of cancer, endocrine, and development disruption (2,3).
Known PFAS are currently divided into ten subclasses (4). Perfluorooctanoic acid (PFOA) and perfluorooctanesulfonic acid (PFOS) have been historically the most studied chemicals. PFOA and PFOS belong to perfluoroalkyl carboxylic acids (PFCAs; base structure: CnF2n+1COOH) and perfluoroalkane sulfonic acids (PFSAs: CnF2n+1SO3H) classes, respectively. Hexafluoropropylene oxide (HFPO), from the perfluoroether carboxylic acids class (PFECAs; base structure: CnF2n+1-O-CmF2m+1-COOH), also known as GenX, has received focused attention since its recent discovery in the environment (5). GenX was introduced in the market as a replacement of PFOA and PFOS, together with other shorter chained PFAS, as a result of the PFOA Stewardship Program. This program involved eight major PFAS manufacturers in the United States that voluntarily phased out PFOA and PFOS-related compounds by 2015 (6). The shift in PFAS manufacturing processes towards the shorter chain compounds has been confirmed by the changes of PFAS fingerprint in wastewaters (7).
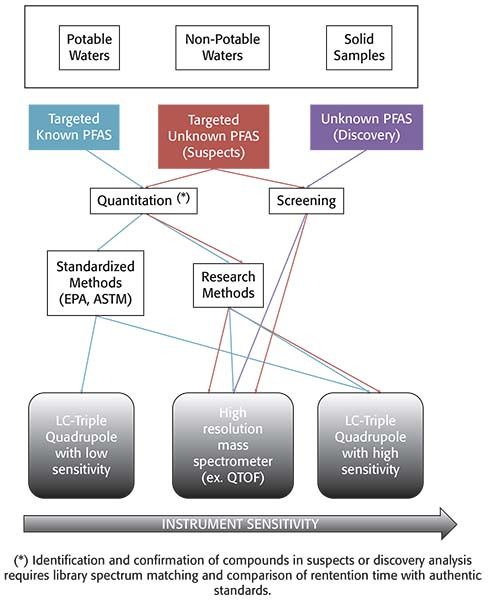
The occurrence and fate of PFAS in the environment has been studied by the scientific community for two decades. Analytical methods have been developed and normally validated for specific studies, including variable lists of target compounds. Liquid chromatography mass spectrometry (LC–MS) detection (either triple quadrupole or high-resolution instruments) is required for the extremely low detection limits required for quantification of known PFAS and the identification of new ones in environmental samples. In the United States, LC–MS-based PFAS methods have had a limited reach in the environmental field outside of research laboratories. However, the recent emergence of public concern regarding the presence of PFAS in the environment, especially in water, have required laboratories to provide rapid and accurate results to relevant stakeholders. Figure 1 describes various workflows that laboratories may need to implement, depending on the end-goal for PFAS analysis. Nakayama and associates published an extensive review of the latest global trends for quantitation of PFAS and screening of new compounds in 2019 (8). In this review, research methods allow for more flexibility, especially as it applies to samples that can be analyzed using a single method and pre-treatment step.
Figure 1: Guidance tool: select sample type, type of compounds, goal of analysis, and type of method.
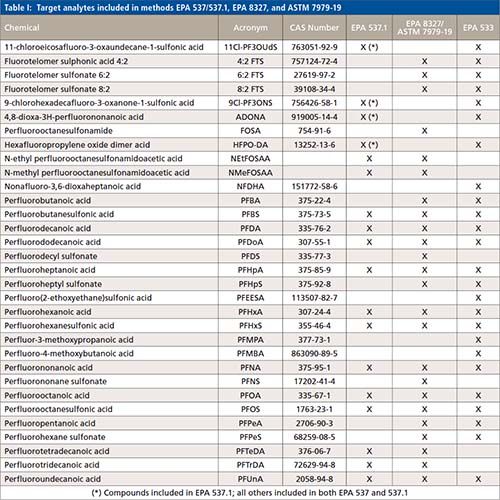
Over the past year, the US Environmental Protection Agency (EPA) published several standardized methods to partially address the current needs of environmental labs and other relevant stakeholders. Namely, standardized methods that allow for faster turn-around-times. In November 2018, EPA method 537.1 (Determination of selected per- and polyfluorinated alkyl substances in drinking water by solid phase extraction and liquid chromatography–tandem mass spectrometry [LC–MS/MS]) (9) was published. EPA 537.1 was an update of EPA 537 (determination of selected perfluorinated alkyl acids in drinking water by solid phase extraction and liquid chromatography–tandem mass spectrometry [LC–MS/MS]) (10) to include four additional compounds: HFPO-DA (GenX), ADONA, 11Cl-PF3OUdS and 9Cl-PF3ONS. These two methods were only validated for the analysis of drinking water; hence, their performance was not demonstrated in non-potable waters. In December 2019, the EPA published a new method for the analysis of PFAS in drinking water, EPA method 533 (Determination of per- and polyfluoroalkyl substances in drinking water by isotope dilution anion exchange solid phase extraction and liquid chromatography–tandem mass spectrometry) (11). This method expanded the target compounds to focus on the shorted chain substances. Table I lists the target compounds included in each of the methods published by EPA for analysis of PFAS in drinking water. The Department of Defense (DOD) is also invested in the standardization of analytical methods for the assessment of PFAS in drinking water. While the DOD requires laboratories to use method EPA 537 or EPA 537.1 for drinking water analysis, the DOD allows in-house developed methods for the analysis of other environmental samples. These methods are acceptable provided that the laboratories demonstrate adherence and compliance with the quality criteria established in the current version of DOD’s Quality Systems Manual (Version 5.3) (12).
Draft method EPA 8327 (Per-and polyfluoroalkyl substances [PFAS] using external standard calibration and multiple reaction monitoring [MRM] liquid chromatography–tandem mass spectrometry [LC–MS/MS]) was published in the summer of 2019 (13). Draft method EPA 8327 is similar to ASTM 7979 (Standard test method for determination of per- and polyfluoroalkyl substances in water, sludge, influent, effluent, and wastewater by liquid chromatography–tandem mass spectrometry [LC–MS/MS]), originally published in 2016 (14). This method expands the list of target compounds as well as sample types available for analysis, including non-potable waters. The scope draft method EPA 8327 is the quantification of 28 selected PFAS with minimal sample preparation (similar to “dilute and shoot” approaches) in non-potable waters (ground water, surface water, and wastewater). The elimination of solid phase extraction in this method reduces analysis times and experimental bias, and minimizes PFAS contamination during sample pre-treatment. This paper presents the results from assessing PFAS in non-potable waters (groundwater, surface water, and wastewater) according to draft method EPA 8327, and aims to demonstrate the reliable and robust performance of the method.
Materials and Methods
Reagents
A commercial mixture of PFAS, including targets and isotopically labeled compounds, from Wellington Laboratories were used (Catalog no. PFCA-24PAR and MPFCA-24ES). These standards were diluted to working standards with 95:5 (v/v) acetonitrile:water, in accordance to EPA Method 8327.
Instrumental Conditions
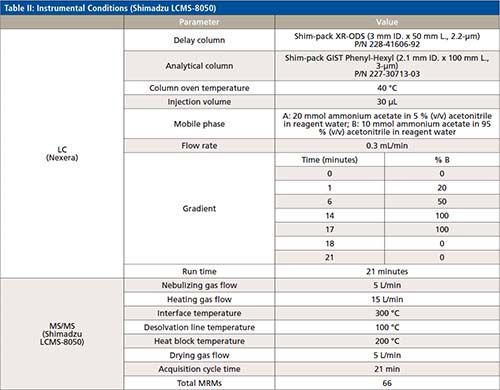
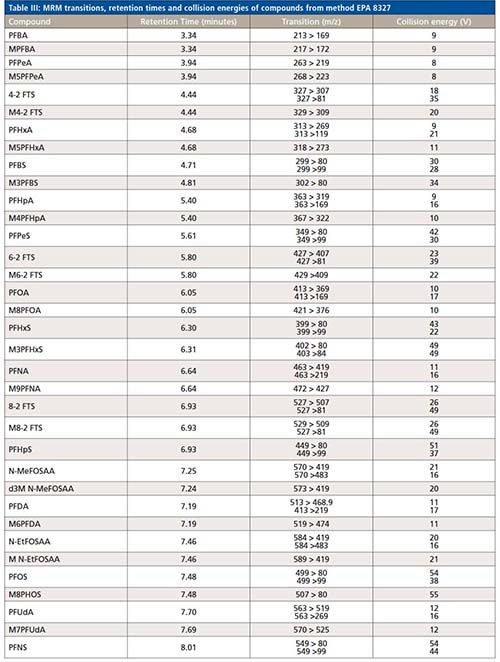
The LC–MS/MS analysis of 43 PFAS (24 targets and 19 surrogates, listed in Table I) was performed using a Shimadzu Nexera UHPLC system coupled with LCMS-8050 triple quadrupole mass spectrometer. A detailed description of the LC–MS/MS parameters is included in Table II. A Shim-pack GIST Phenyl-Hexyl, 2.1 mm × 100 mm and 3.0-μm particle size (Shimadzu P/N: 227-30713-03) analytical column was used to conduct the analysis, along with a Shimadzu Shim-pack XR-ODS 50 mm × 3.0 mm x 2.2-μm (Shimadzu P/N: 228-41606-92) as delay column. The delay column was installed for minimizing possible PFAS contamination from the solvents being used. Mobile Phases A and B were the same as those listed in EPA method 8327 for a binary gradient: 20 mM ammonium acetate in 95:5 water:acetonitrile and 10 mM ammonium acetate in 95:5 acetonitrile:water for A and B, respectively. A 0.3 mL/min flow rate was used in the 21 min gradient, an allowed modification of the gradient listed in EPA method 8327. The total run time of 21 min included re-equilibration for both the delay and the analytical column. This gradient (described in Table II) was developed to ensure maximum resolution between peaks in the shortest time possible with minimum co-elution of isomers.
All compound specific parameters, including precursor ion, product ion, and collision energies were optimized using flow injection analysis (FIA), bypassing the analytical column using Lab Solutions software. The lower ESI heater temperature selected reduces HF loss and minimizes false identification of fluorotelomer acids. The MRM transitions are listed in Table III. A total of 66 MRMs was monitored. The targets monitored in this work are anionic, hence, analyzed by electrospray ionization in negative mode. However, new research suggests cationic and zwitterionic PFAS might ionize better in positive mode (15). The ultra-fast acquisition rate of 555 MRM/sec of the LCMS-8050 used in this work allows for the inclusion of more targets (to be analyzed in positive and negative mode), without compromising the sensitivity in a single run. Additional details about the method and configuration can be found elsewhere (16).

Calibration Curve and Quality Control Samples
The working standards were used to create a calibration curve ranging from 5 to 200 ng/L, with the injection solvent consisting of 50:50 water:methanol, with 0.1% acetic acid in order to match the injection solvent for the extracted samples. Filtration was not performed on the calibration standards. Quality control samples (QCs) were prepared as the calibration standards.
Sample Preparation
Replicated samples, including reagent water, groundwater, surface water, and wastewater were analyzed during this study. Each sample was diluted 50:50 with methanol and 0.1% acetic acid, spiked with isotopically labeled surrogates, and vortexed for 2 min. The samples were then filtered through 0.2 μm syringe filters, and analyzed by LC–MS/MS.
Results and Discussion
Calibration Curve and Quality Control Samples
Data presented in this paper were acquired in two batches, and analyzed in consecutive dates. Each batch included the analysis of 39 injections (9 calibration standards, 4 blanks [reagent, method, and travel blanks], 6 QCs [LLOQ, LCS, and CCV] injected along the sequence according to EPA requirements, and 20 samples [reagent water, ground water, surface water and wastewater]).
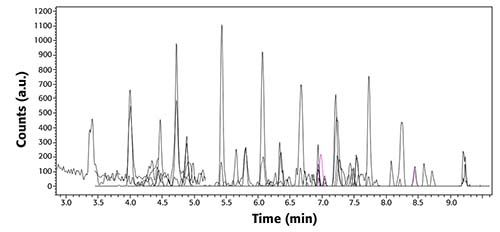
Calibration curves were performed for all PFAS targets, using a nine-point calibration curve, ranging from 5 to 200 ng/L. Figure 2 shows a total ion chromatogram and MRMs from a 5 ng/L standard; this figure demonstrates the separation and peak shape of targets at the lowest concentration included in the calibration curve.
Figure 2: TIC (black) chromatograms and MRM transitions (other colors) of all PFAS in EPA Method 8327 at a concentration of 5 ng/L.
The linearity of the curve was determined using a 1/x weighting factor, and not forcing through zero. Excellent linearity was obtained with correlation coefficients (r2) greater than 0.99 for all analytes or transitions in the two batches analyzed for collecting the data presented in this paper. Residuals of each standards were within ±30% difference from its true concentration. More detailed information about the calibration curve results can be found elsewhere (16).
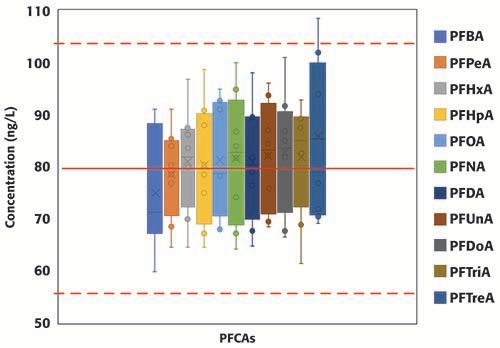
A total of eight continuing calibration verification standards (QCs) were injected in the two batches consecutively analyzed for this study. Surrogates and targets were spiked at 80 ng/L (in sample equivalent). Figure 3 summarizes the concentrations of all surrogates, grouped by PFAS class, from EPA 8327 in the eight QCs samples; the red solid line represents the true concentration (80 ng/L), and the dotted red lines set the limits of the acceptable concentration range according to EPA guidelines (±30% of the expected value, equivalent to 56 and 104 ng/L). For the PFCAs class, the concentration range increases with carbon chain length; no clear trends were observed for the other classes of PFAS. All results, except for one injection of d3-NMeFOSAA, were within ±30% of the expected value, and, moreover, most to the results were within ±20% of the expected value. Figure 4 summarizes the concentrations of the eleven PFCAs included in the method. Similar trend to that observed for the PFCAs surrogates was observed for the targets. For the targets, including the other classes not shown in Figure 4, results were well within EPA’s acceptable range (±30% of the expected value) and even the stricter bracket of ±20%. The percent relative standard deviation was <20% for all compounds (results not included here) in the two batches analyzed. The results summarized in Figures 3 and 4 demonstrate the robustness and reproducibility of the method validated in this work. It is also noteworthy that maintenance was not required for maintaining the performance of the instrument after the analysis of at least 40 environmental samples (approximately 28 h of operation).
Figure 3: Concentration of surrogates included in method EPA 8327 measured in replicated QCs standards (n=8) injected during two consecutive batches (total number of injections, including calibration standards, QCs samples and samples: 78).
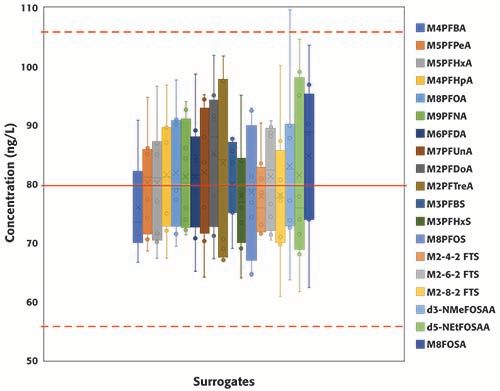
Figure 4: Concentration of PFCAs included in method EPA 8327 measured in replicated QCs standards (n=8) injected during two consecutive batches (total number of injections, including calibration standards, QCs samples and samples: 78).
Environmental Samples
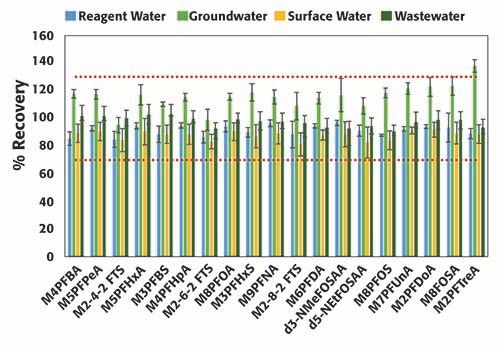
Forty environmental samples were analyzed in two consecutive batches. Figure 5 summarizes the surrogate (spiked at 160 ng/L) recoveries from 16 representative samples collected from various sources (reagent water, groundwater, surface water, and wastewater), and prepared as described in the Materials and Methods section, in accordance to EPA method 8327. Samples were analyzed in a random order in the two batches. Surrogates %recovery ranged between 82% and 92% in reagent water, groundwater, surface water, and wastewater; these values are well within the acceptable ranges (70-130%). The percent recoveries in the groundwater samples were consistently higher than in the other sample types; however, they were still within limits accepted by EPA, and ranged between 95% and 123%, except for M2PFTreA (138%). As samples were analyzed randomly, the difference could be attributed to matrix enhancement in the groundwater samples. EPA method 8327 utilizes an external calibration; the matrix enhancement could be minimized by using an internal calibration or isotopic dilution for calculating the PFAS concentrations. The %RSDs were less than 10% (half of the acceptable criteria listed in EPA method 8327), and no major differences were observed across samples types. The reproducibility in the results from the surrogate recoveries corroborates the robustness of the system inferred from the results of the QCs.
Figure 5: Percent recovery of surrogates with corresponding %RSD in replicated (n=4) samples from each matrix type: reagent water, groundwater, surface water, and wastewater.
Conclusions
Multiple analytical methods for the monitoring of PFAS have been developed and validated over the past two decades. However, one of the challenges environmental stakeholders face for understanding the global occurrence of PFAS and the effectiveness of mitigation strategies is the lack of standardized methods. Secondly, the recent increase in PFAS by the public requires laboratories to provide results quickly. This paper demonstrates the reliable and robust quantification of PFAS, according to latest EPA method for the analysis of environmental samples different from drinking water, with minimal sample preparation; hence, it allows laboratories to increase the sample throughput, and ensure stakeholders receive information in a timely manner.
References
- US Food and Drug Administration, Per and Polyfluoroalkyl Substances (PFAS). Available at https://www.fda.gov/food/chemicals/and-polyfluoroalkyl-substances-pfas. Accessed January 2nd, 2020.
- US Environmental Protection Agency, PFOA, PFOS and Other PFASs. Available at https://www.epa.gov/pfas/basic-information-pfas. Accessed January 2nd, 2020.
- Centers for Disease Control and Prevention, Per- and Polyfluorinated Substances (PFAS) Factsheet. Available at https://www.cdc.gov/biomonitoring/PFAS_FactSheet.html. Accessed January 2nd, 2020.
- M. Sun, E. Arevalo, M. Strynar, A. Lindstrom, M. Richardson, B. Kearns, A. Pickett, C. Smith, and R.U. Knappe. Environ. Sci. Technol. Lett. 3(12), 415–419 (2016).
- Z. Wang, J.C. DeWitt, C.P. Higgins, and I.T. Cousins, Environ. Sci. Technol. 51, 2508–2518 (2017).
- US Environmental Protection Agency, Fact Sheet: 2010/2015 PFOA Stewardship Program. Available at https://www.epa.gov/assessing-and-managing-chemicals-under-tsca/fact-sheet-20102015-pfoa-stewardship-program#what. Accessed January 2nd, 2020.
- E.F. Houtz, R. Sutton, J.S. Park, and M. Sedlak, Water Res.95, 142–149 (2016).
- S.F. Nakayama, M. Yoshikane, Y. Onoda, Y. Nishihama, M. Iwai-Shimada, M. Takagi, Y. Kobayashi, and T. Isobe, Trends Anal. Chem. 151, 115410 (2019).
- J.A. Shoemaker, P.E. Grimmett, and B.K. Boutin. Method 537: Determination of selected perfluorinated alkyl acids in drinking water by solid phase extraction and liquid chromatography/ tandem mass spectrometry (LC/MS/MS). (US EPA, Office of Research and Development, Washington, D.C., Version 1.1, September 2009).
- J.A. Shoemaker and D.R. Tettenhorst. Method 537.1: Determination of selected perfluorinated alkyl acids in drinking water by solid phase extraction and liquid chromatography/ tandem mass spectrometry (LC/MS/MS). (US EPA, Office of Research and Development, Washington, D.C., Version 1.0, November 2018).
- L. Rosenblum and S. Wendelken. Method 533: Determination of Per- And Polyfluoroalkyl Substances in Drinking Water by Isotope Dilution Anion Exchange Solid Phase Extraction and Liquid Chromatography/Tandem Mass Spectrometry. (US EPA, Office of Research and Development, Washington, D.C., Version 1.0, December 2019).
- US Department of Defense, Department of Defense Consolidated Quality Systems Manual (QSM) for Environmental Laboratories Version 5.3. Available at https://www.denix.osd.mil/edqw/documents/manuals/qsm-version-5-3-final/. Accessed January 2nd, 2020.
- US Environmental Protection Agency, Method 8327 Per- and polyfluoroalkyl substances (PFAS) using external standard calibration and multiple reaction monitoring (MRM) liquid chromatography/ tandem mass spectrometry (LC/MS/MS). Available at https://www.epa.gov/sites/production/files/2019-06/documents/proposed_method_8327_procedure.pdf. Accessed January 2nd, 2020.
- ASTM D7979-19, Standard Test Method for Determination of Per- and Polyfluoroalkyl Substances in Water, Sludge, Influent, Effluent, and Wastewater by Liquid Chromatography Tandem Mass Spectrometry (LC/MS/MS). (ASTM International, West Conshohocken, PA, 2019)
- G. Munoz, P. Ray, S. Mejia-Avendaño, S.V. Duy, D.T. Do, J. Liu, and S. Sauvé, Anal. Chim. Acta,1034, 74–84 (2018).
- Analysis of Per- and Polyfluoroalkyl Substances (PFAS) Specified in EPA M8327 using the LCMS-8050 Triple Quadrupole Mass Spectrometer, Shimadzu Scientific Instruments Application Note.
Ruth Marfil-Vega is the Environmental Marketing Manager at Shimazdu Scientific Instruments, in Columbia, Maryland. Brahm Prakash is a Strategic Scientist at Shimazdu Scientific Instruments, in Columbia, Maryland. Direct correspondence to: rmmarfilvega@shimadzu.com
Rapid, Portable Mid-Infrared Spectroscopy Identifies Aflatoxins in Peanuts
March 10th 2025Researchers have developed a portable mid-infrared (IR) spectroscopic method combined with chemometric analysis to rapidly and non-destructively detect aflatoxin contamination in Aspergillus-infected peanuts. This approach offers a field-deployable alternative to traditional wet chemistry methods, with high sensitivity and specificity in identifying toxic metabolites such as aflatoxins.
More Than Just Acronyms at EAS 2023
November 14th 2023Award recipient John McLean of Vanderbilt University said hybrid techniques do not exist purely as combinations of letters, slashes, and hyphens—they have been built on the shoulders of decades’ worth of analysis intended to refine and simplify workflow.
Determination of Very Low Abundance Diagnostic Proteins in Serum Using Immunocapture LC–MS/MS
July 1st 2017There is growing interest in the determination of endogenous proteins in biological samples for diagnostic purposes, because a concentration increase or decrease of such proteins can allows us to monitor the state of a pathological condition such as cancer. Immunocapture LC–MS/MS analysis combines the workflow of conventional immunological assays with LC–MS analysis. This article describes typical challenges, such as cross reactivity and the mass spectrometer’s dynamic range, as well as the advantages of isoform differentiation and multiplexing.
Ion Mobility Spectrometers as Chromatographic Detectors
July 1st 2017Interest in connecting ion mobility spectrometry (IMS) to GC and especially to LC is now growing. One favorable property of IMS is that it can work with ambient pressure and can be easily connected to a gas or liquid chromatograph. Analytical applications of GC–MS and LC–MS are very different and encompass investigations into food, medical science, environment, drugs of abuse, chemical warfare agents, and explosives.
Quantitative Drug Metabolite Profiling without Radiolabels Using HPLC–ICP-MS
July 1st 2017In drug development, quantitative determination of a candidate drug and its metabolites in biofluids is an important step. The standard technique for quantitative metabolite profiling is radiolabeling followed by HPLC with radiodetection, but there are disadvantages to this approach, including cost and time, as well as safety and ethical concerns related to administering radiolabeled compounds to humans. Frank Vanhaecke and his research group at Ghent University have been developing an alternative technique, and he recently spoke to us about this work.