Infrared Spectroscopy
Infrared (IR) spectroscopy had its beginning in the early 1900s, when William Weber Coblentz demonstrated that chemical functional groups exhibited specific and characteristic IR absorptions. In this early work, Coblentz collected the IR spectra of ~135 compounds with an accuracy that still stands the test of time some 60 years later. Interest in the method grew during World War II, when a method for characterizing synthetic rubber formulations was needed for the war effort. The early to mid 1940s saw the first commercial instruments come on the market from both Beckman and Perkin Elmer. In 1957, Perkin Elmer introduced the first low-cost IR spectrophotometer, the Model 137, priced at just $3800. Several years later, the Coblentz Society was formed to educate early practitioners in the art. The IR method was used widely, but experienced a significant resurgence in the sciences with the advent of Fourier transform IR (FT-IR) instruments in the late 1960s and early 1970s. These instruments could collect spectra in a matter of seconds, and, by signal averaging, spectra of very high quality could be measured. Although instruments of that era were very large and bulky, current instruments are approaching the size of a cell phone. Today, the method is widely used in fields as diverse as planetary modeling, chemical characterization, climate monitoring, chemical threat detection, forensics, and disease detection, to name a few.
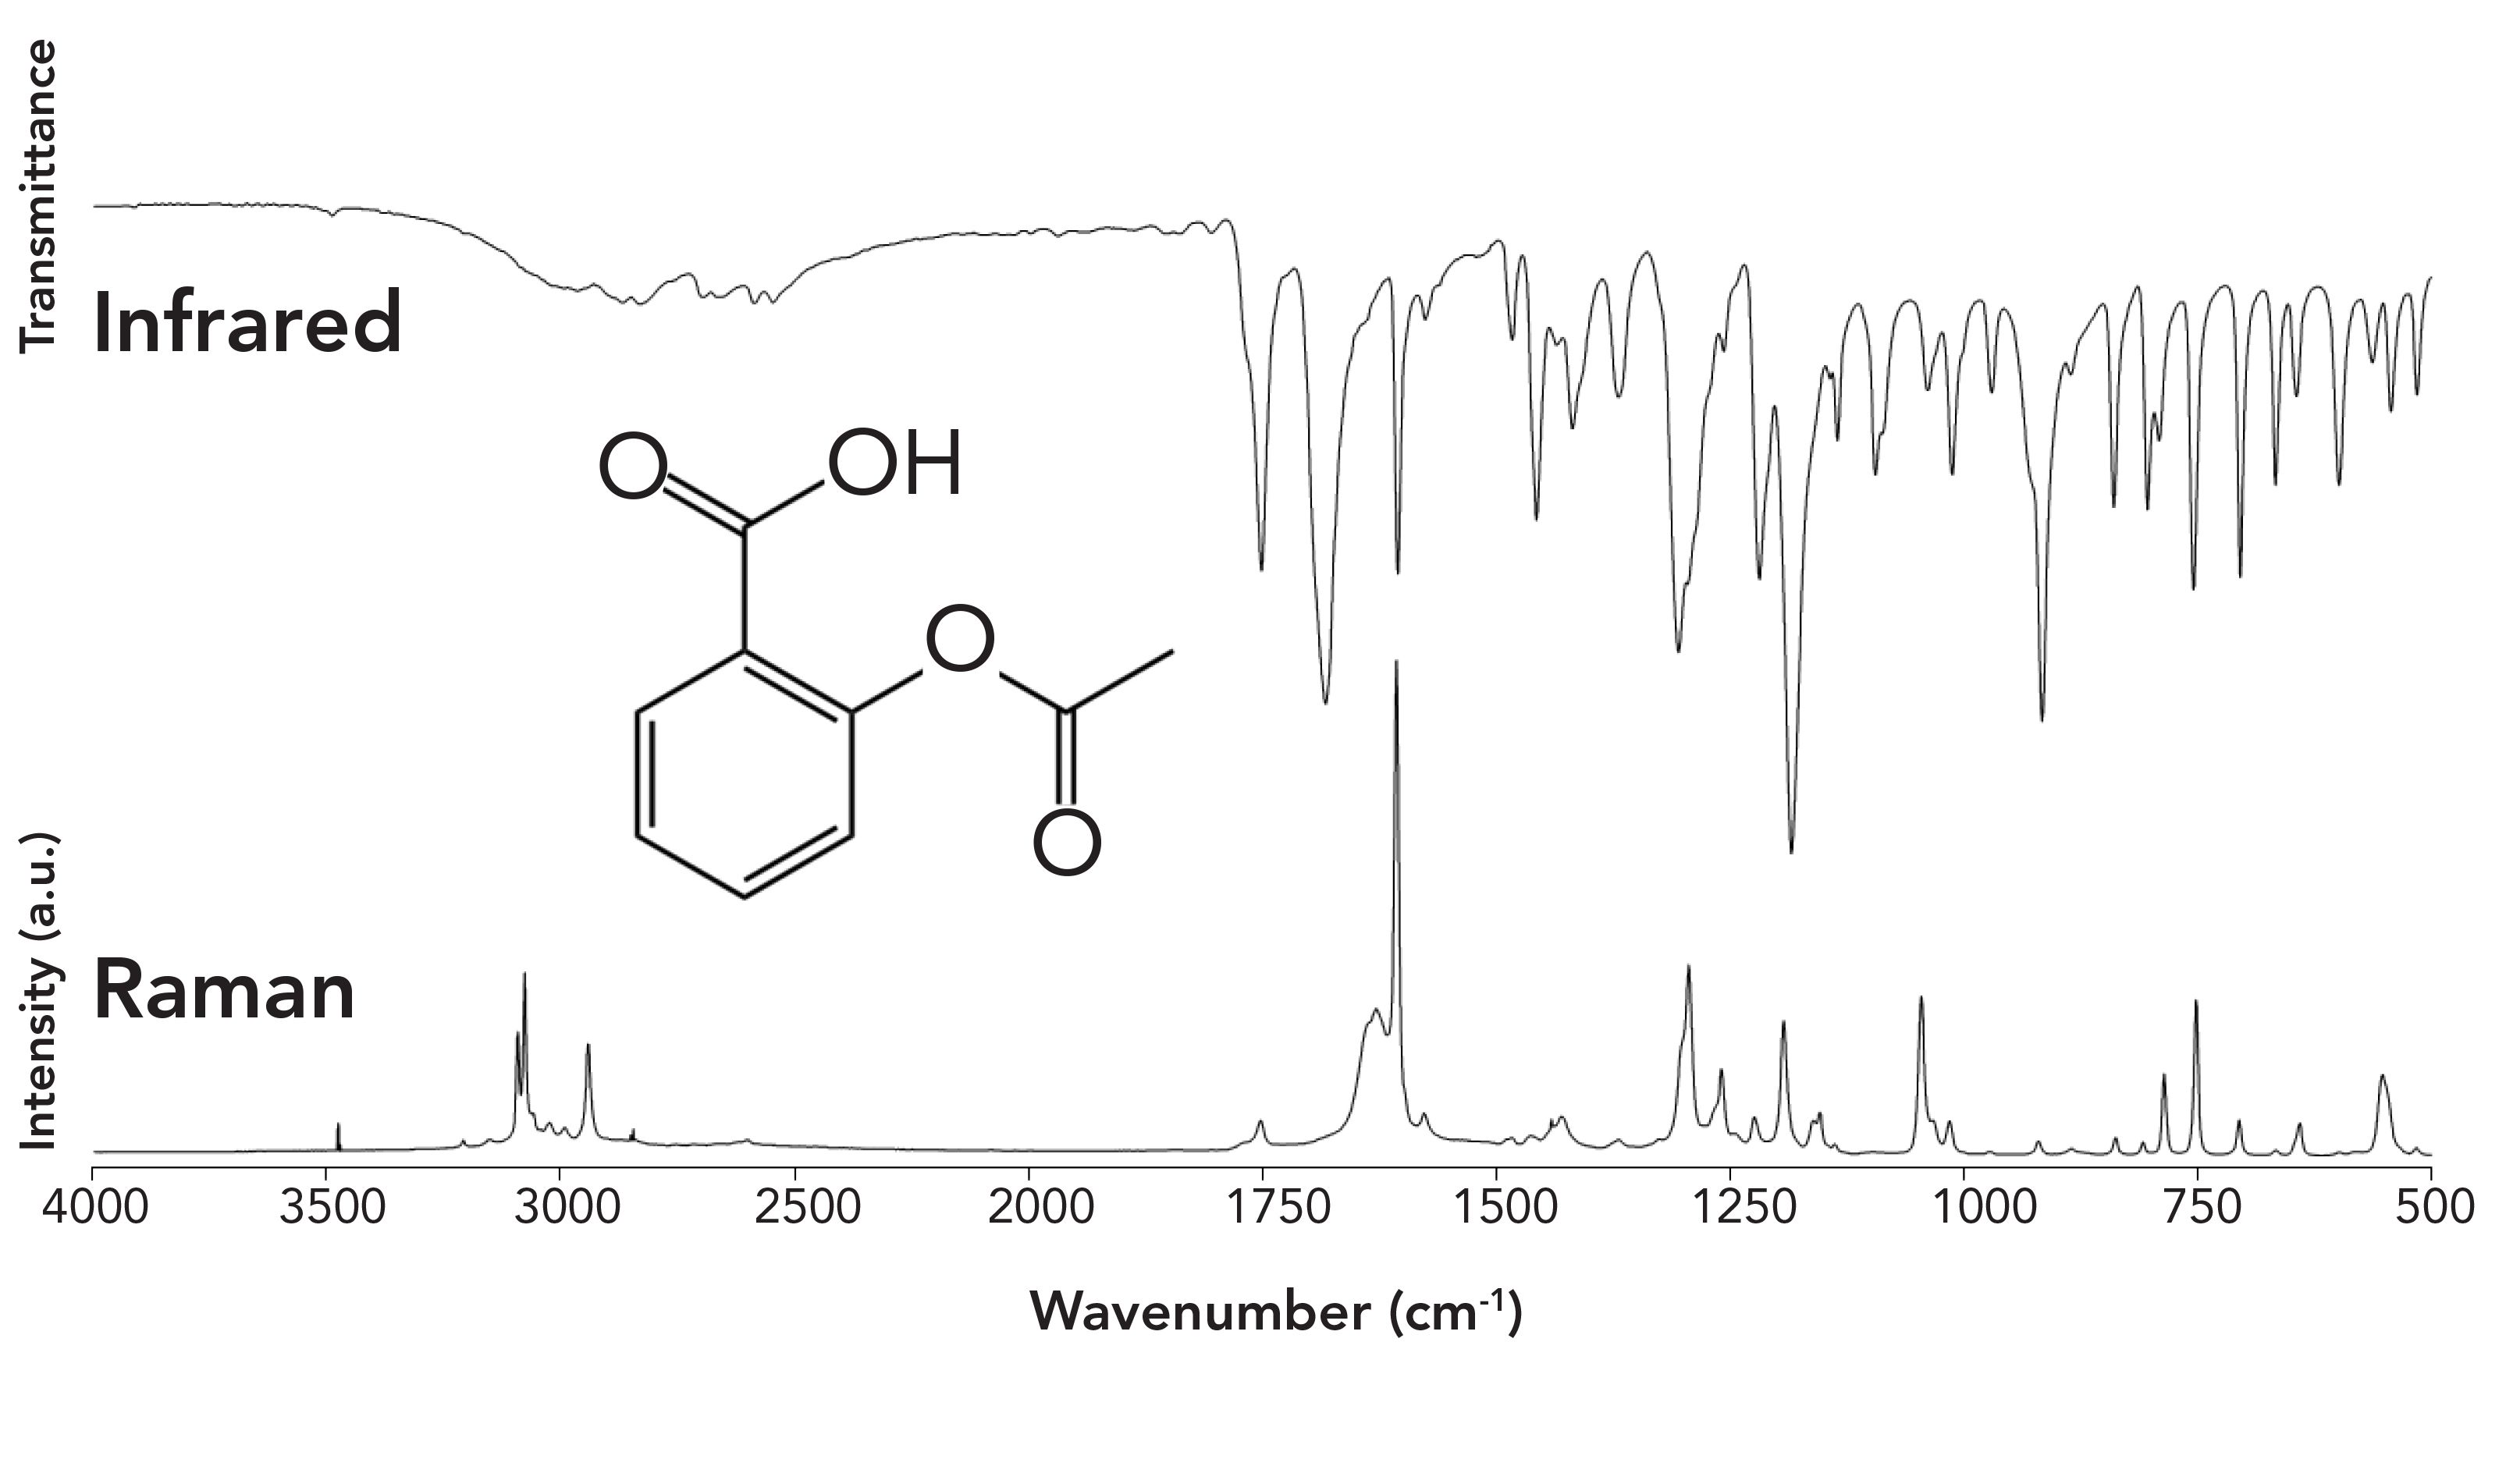
The mid-IR spectrum ranges in wavelengths from 2.5 to 50 micrometers. To correlate these wavelengths with bond energies, the wavenumber (cm-1) is used, which is simply the number of wavelengths contained in one centimeter. The corresponding wavenumbers relating to the above wavelength range is 4000 to 200 cm-1, respectively. For qualitative work, a transmission spectrum is collected by passing these wavelengths through a very thin sample (~10 micrometers thick), and recording how much light is absorbed by the sample. Figure 1 illustrates the IR and Raman spectra of acetyl salicylic acid (aspirin).
Figure 1: Infrared and Raman spectra of acetyl salicylic acid (aspirin).

Both spectra are rich in information, but to contrast the two methods, the IR method is sensitive to molecules possessing heteronuclear bonds and molecular vibrations that are asymmetric. For example, the features near 1751 and 1683 cm-1 arise as a result of the C=O stretch of the ester and acid carbonyl groups, respectively. In contrast, the Raman method is sensitive to homonuclear bonds and molecular vibrations that are symmetric. Thus, the C=C stretch located near 1600 cm-1 is the most intense transition in the Raman spectrum. Both IR and Raman spectra are unique for a given compound and are considered fingerprints for that compound. Indeed, in 1962, Ellis R. Lippincott testified before the United States Congress that an IR spectrum is a unique fingerprint that could be used in patent litigation.
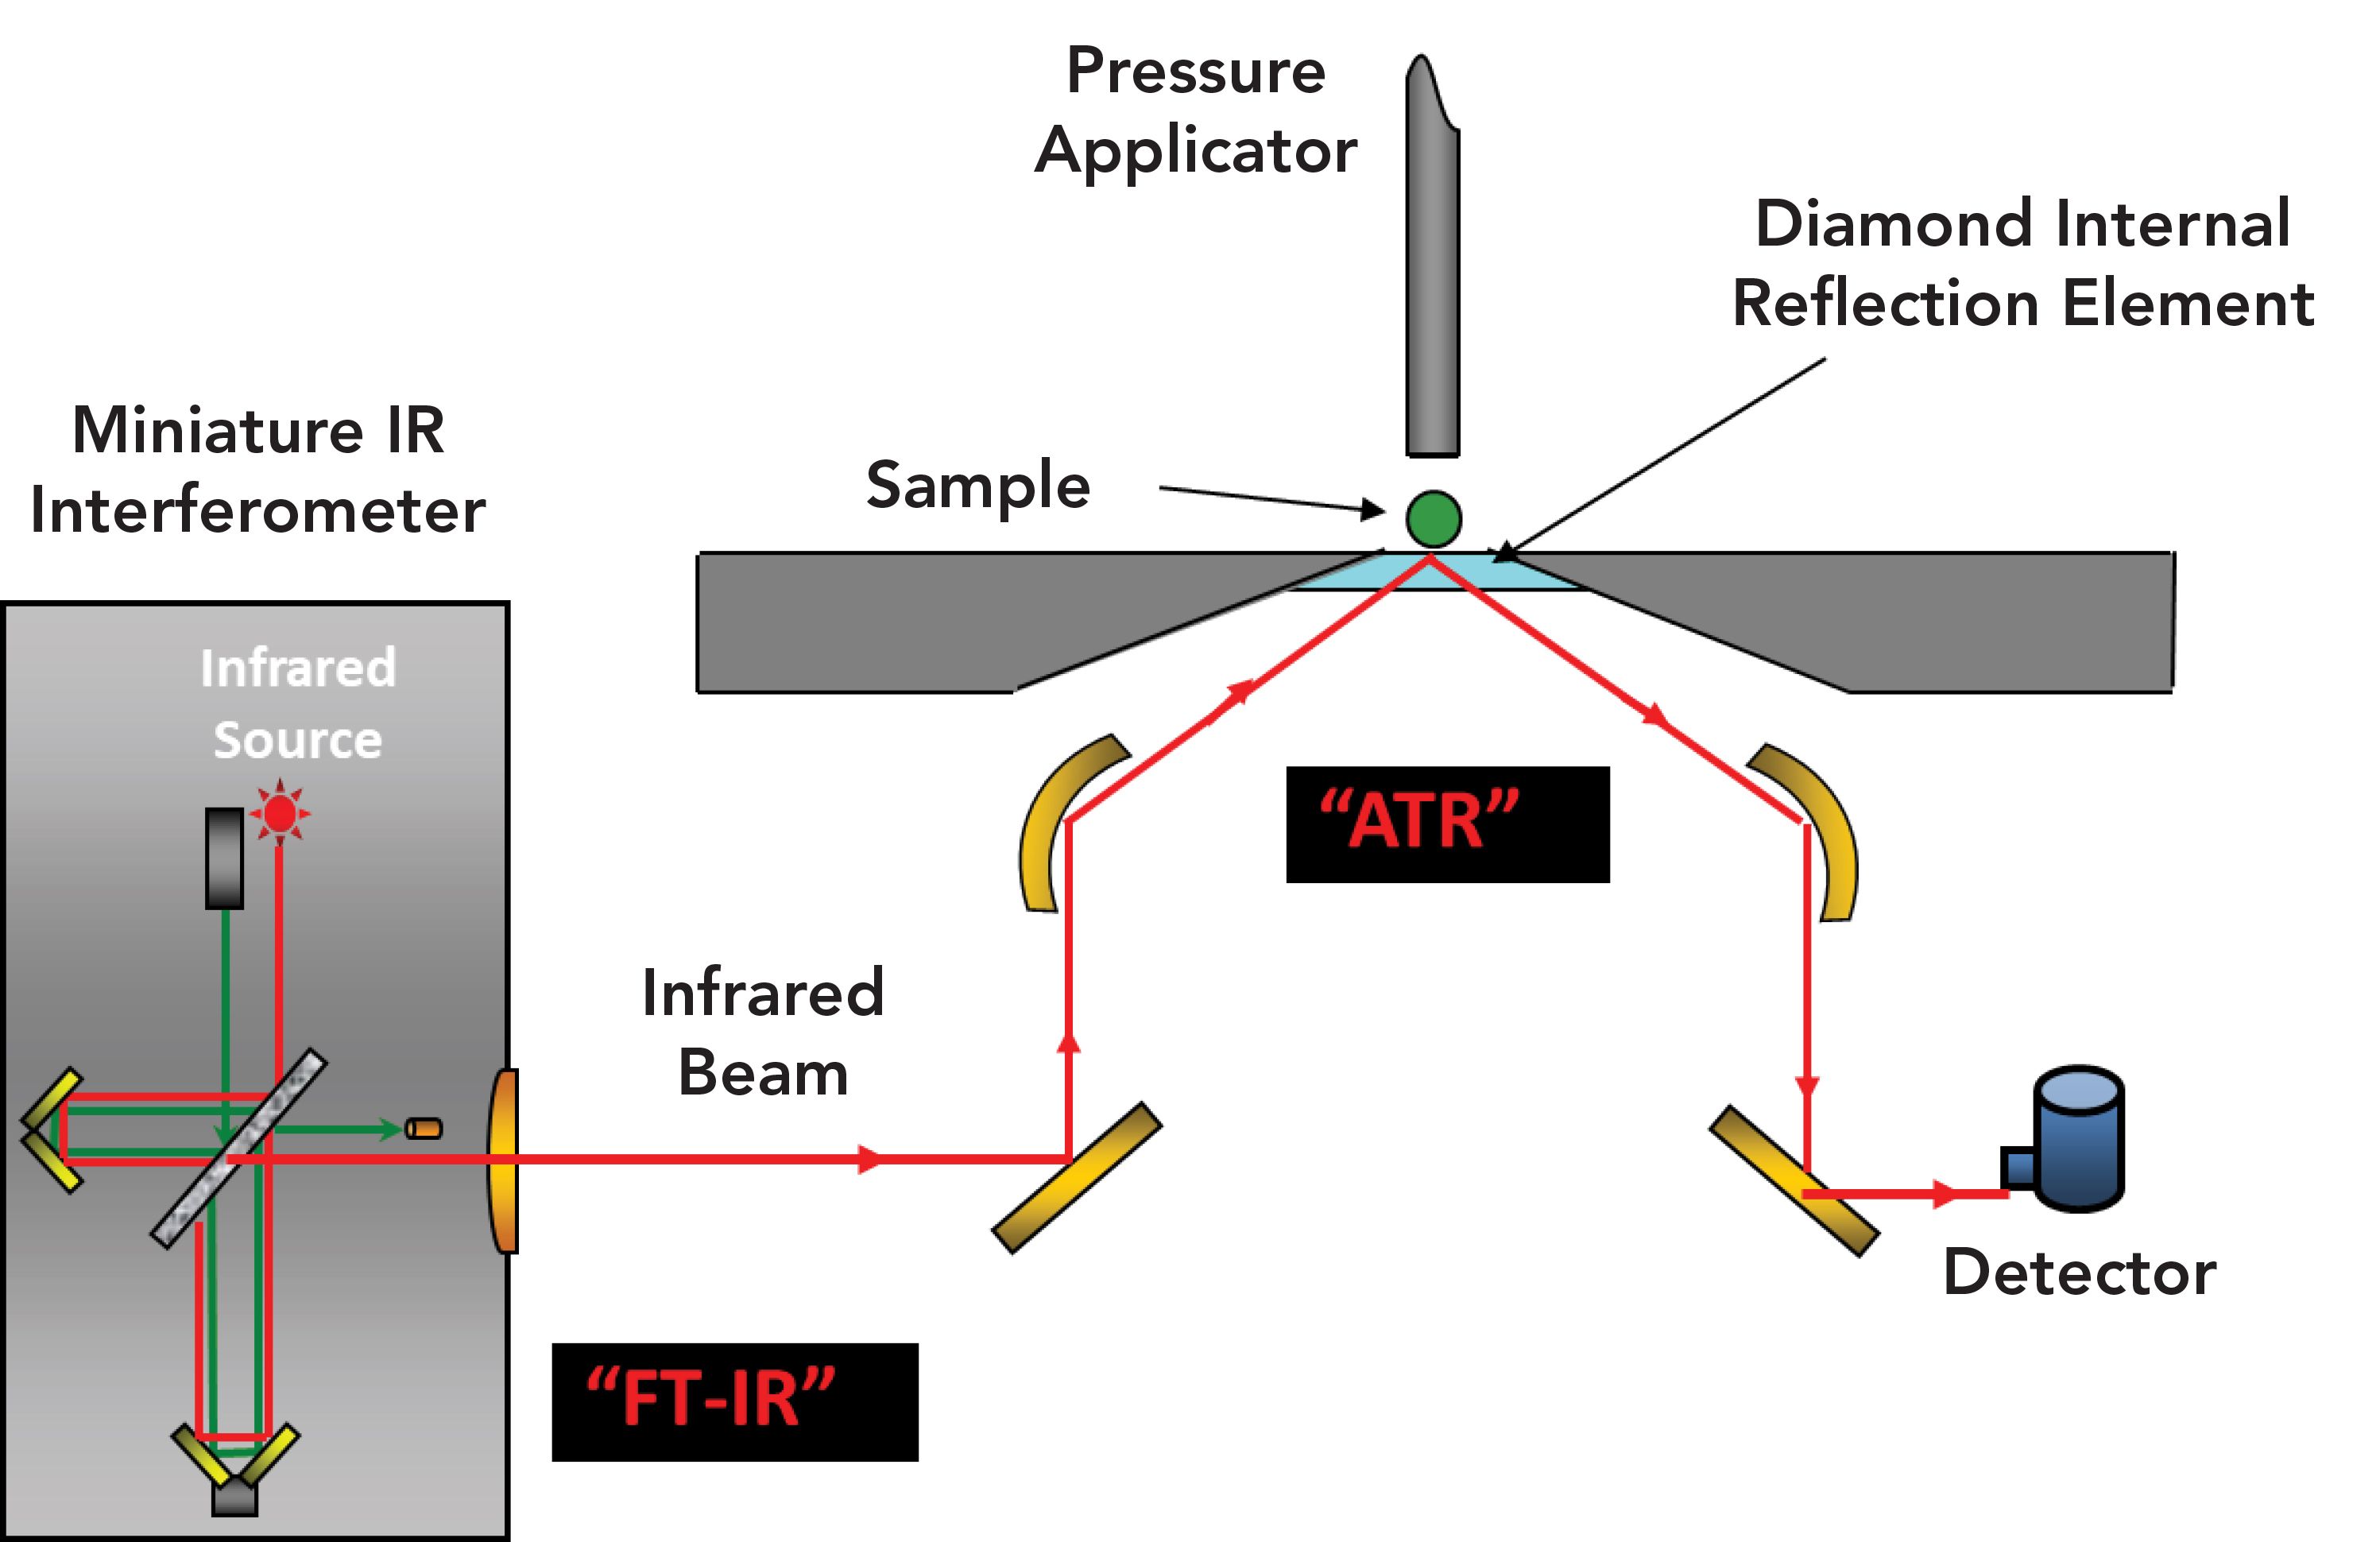
In the late 1980s, two more significant developments took place: the development of novel sampling accessories, most notably attenuated total internal reflection (ATR) sampling accessories, and the development of IR microscopes. ATR accessories allowed any sample to be measured on a routine basis. Previously, the samples had to be in a specific form (a thin film less than 10 micrometers thick) to obtain a suitable transmission spectrum. This requirement involved considerable sample preparation or specialized accessories. Using the ATR method, the sample is brought into intimate contact with an internal reflection element (IRE). Figure 2 illustrates a typical ATR accessory.
Figure 2: A Typical ATR Accessory (diagram provided by RedWave Technology).

Contact between the sample and the IRE is achieved using a pressure applicator. Although several IREs are available, the most common ones are made of synthetic diamond. Diamond is both chemically inert and IR-transparent, but is also hard, and, as a result, can withstand high pressures. At the diamond–sample interface, the IR light penetrates into the sample only a few micrometers. As a result, highly absorbing samples like aqueous solutions can be easily studied without significant sample preparation. Today, the vast majority of IR spectra are collected using ATR accessories.
Although the first IR microscope (the PerkinElmer 85) was introduced in the 1950s, its use was limited because it was interfaced to a prism or grating spectrometer. The limited light throughput associated with micro-metersized samples and the serial data collection of the spectrophotometer translated into long scan times by today’s standards. In the mid 1980s, these microscopes were interfaced to FT-IR instruments. The reduced collection times, along with computer averaging, made it possible to analyze samples whose size approached the wavelengths of IR light.
In the late 1990s and early 2000s, the IR microscopes began to be outfitted with both linear and two-dimensional array detectors, along with motorized stages. These detectors allowed one to obtain IR maps and images from micrometer-sized spatial domains over large areas. In addition, the IR microscope could be used in a variety of different modes which included transmission, reflection, and ATR microspectroscopy. This latter method had the advantage of increasing the spatial resolution of the measurement by changing the refractive index of the IRE employed.
Recently, IR spectroscopy has been coupled with atomic force microscopy (AFM), and a new generation of IR microscopes has been outfitted with tunable IR lasers. AFM-coupled IR microscopes allow one to collect spectra on spatial domains much smaller than the wavelength of light. However, these microscopes have a high price tag, and are not considered routine analytical instruments. Similar to the AFM–IR microscopes, IR microscopes outfitted with solid-state lasers are expensive, and not considered routine. In addition, the spectral range of these systems is limited to ~1800–900 cm-1.
It remains to be seen where the technology will take IR analysis in the future, but the method is one of the most important tools in the arsenal of many scientists throughout the world.
André J. Sommer is the Director of the Molecular Microspectroscopy Laboratory at Miami University in Oxford, Ohio.


AI Shakes Up Spectroscopy as New Tools Reveal the Secret Life of Molecules
April 14th 2025A leading-edge review led by researchers at Oak Ridge National Laboratory and MIT explores how artificial intelligence is revolutionizing the study of molecular vibrations and phonon dynamics. From infrared and Raman spectroscopy to neutron and X-ray scattering, AI is transforming how scientists interpret vibrational spectra and predict material behaviors.
Real-Time Battery Health Tracking Using Fiber-Optic Sensors
April 9th 2025A new study by researchers from Palo Alto Research Center (PARC, a Xerox Company) and LG Chem Power presents a novel method for real-time battery monitoring using embedded fiber-optic sensors. This approach enhances state-of-charge (SOC) and state-of-health (SOH) estimations, potentially improving the efficiency and lifespan of lithium-ion batteries in electric vehicles (xEVs).
New Study Provides Insights into Chiral Smectic Phases
March 31st 2025Researchers from the Institute of Nuclear Physics Polish Academy of Sciences have unveiled new insights into the molecular arrangement of the 7HH6 compound’s smectic phases using X-ray diffraction (XRD) and infrared (IR) spectroscopy.