Infrared Specular Reflection Calculated for Polymer Films on Polymer Substrates: Models for the Spectra of Coated Plastics
Infrared reflection spectroscopy is a tool that can be used to study coated plastics, but the spectra can show unexpected features. In this report, we calculate the specular reflectance for a flat surface of two different polymers as well as how their spectra change when the other polymer is added as a film with a thickness of up to 2.5 ?m. One of the unusual phenomena we observe is that "derivative"-shaped substrate bands invert in sign as the other polymer is added as a coating. We also show how the reflection of the surface changes and becomes polarized as the angle of incidence increases.
Infrared reflection spectroscopy is a tool that can be used to study coated plastics, but the spectra can show unexpected features. In this report, we calculate the specular reflectance for a flat surface of two different polymers as well as how their spectra change when the other polymer is added as a film with a thickness of up to 2.5 µm. One of the unusual phenomena we observe is that "derivative"-shaped substrate bands invert in sign as the other polymer is added as a coating. We also show how the reflection of the surface changes and becomes polarized as the angle of incidence increases.
With support from the National Institutes of Justice, our laboratories recently worked on the spectroscopy of fabrics for nondestructive, standoff (~1 m) detection of biological fluid stains (for example, bloodstains) as a crime-scene survey tool. This application largely demands reflection, scattering, or emission measurements. The nature of the measurement we hope to make constrains the methods and approaches we can take. We felt that a mid-infrared (MIR) reflection imaging approach was best suited to our particular application.
Diffuse reflection (DR) is a method more commonly applied in cases where the absorption of incident radiation is weak.
One of the main reasons DR is not often applied to MIR analysis of strongly absorbing materials is that the spectra we obtain are frequently not recognizable even to a specialist trained in infrared spectral identification. Instead, the reflection spectra we observe are often low in intensity because of strong absorption in the sample. The spectra may have peaks in unexpected places, and none where one might expect an absorption peak. The spectra may change with angle of incidence and detection, and may be very sensitive to how the sample is prepared.
The Specular Component of Reflection
The source for all these problems is front-surface specular reflection. When the surface is rough or irregular, as with a fabric, such a front-surface reflection is called Fresnel diffuse reflection (FDR). It is always present, resists intuition, and analytical spectroscopists (like the authors) tend to hate even thinking about it. In DR measurements we do everything in our power to ignore it, and we would make it go away if we could — but we can't.
FDR usually does not exhibit features expected in an absorption spectrum. But that doesn't mean it is featureless: It has plenty of features, in fact too many features that are all in the "wrong" places. Underlying the complex nature of FDR is a phenomenon most of us didn't learn about in school; the dispersion of optical constants in real materials (1).
We study the infrared absorption spectrum of matter because it contains characteristic features related to the chemical composition of the matter. From an optical standpoint, matter can be characterized by its refractive index, n. The refractive index is frequency and wavelength dependent, and is also a complex quantity, meaning that it can be written as the sum of a real and an imaginary part:

In equation 1, the roman n is the real component of index, lower case i is the square root of negative 1, and k is the imaginary refractive index. The imaginary index k is related to the linear absorption coefficient, α, by equation 2:

where λ is the wavelength of light. Thus, the imaginary refractive index k varies with wavelength along with the absorption coefficient. In other words, if you know the absorption coefficient for matter, you also know its imaginary index.
The two parts of the complex refractive index in equation 1 are related to one another by a relationship known as a Kramers-Kronig transform. The Kramers-Kronig transform is a relationship that can be derived from the fact that matter polarizes in response to the electric field of light. As a result of the relationship between the real and imaginary components of the refractive index, absorbances of matter are unavoidably accompanied by swings in refractive index that look nominally like first derivatives of the absorption bands. The stronger these absorbances are, the more extreme the oscillation of the refractive index is around the absorption bands. Let us look at a couple of real cases for the polymers that we will examine in this manuscript.
Figures 1a and 2a show n and k for a portion of the MIR spectral region as a function of wavelength for two polymers, polystyrene and acryloid B67. The optical constants for polystyrene were reported by Folks and colleagues (2), while those for acryloid B67 are newly reported here (the absorption coefficient was shown previously [3]). Note that k follows the molecular vibrational absorptions for these materials as required by equation 2. Converting the axis to wavenumbers, the presence of a carbonyl band in the spectrum of acryloid B67 (1728 cm-1 ) is readily observed.
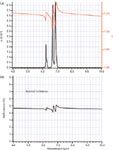
Figure 1: (a) Real (red, right axis) and imaginary (black, left axis) refractive index components for polystyrene. (b) Calculated specular reflection for polystyrene at normal incidence.
Both polymers in Figures 1 and 2 show dispersion features in their real refractive index accompanying their absorption bands. The intensity of the acryloid absorption spectrum is substantially stronger than that of polystyrene, so that while the variation of n for polystyrene is not very large — only about 0.05 units peak-to-peak — the variation of n for the acryloid polymer approaches half a unit. On average over this spectral range, the real index for polystyrene is about 1.55; acryloid B67 is slightly higher, about 1.6. However, the strong oscillations in the acryloid index mean that the relative ordering of the two polymers in terms of n reverses several times over this wavelength range, and there are several points at which they are equal, such as around 8.5 µm, and again around the 5.5-µm wavelength. At the former, the acryloid shows strong absorption of light, while at the latter the absorption is relatively weak, lying on the short wavelength side of the strong and narrow carbonyl band.
Figures 1b and 2b show the normal incidence specular reflection from planar semi-infinite slabs of polystyrene and acryloid B67, respectively, calculated from the optical constants in the corresponding Figures 1a and 2a. The specular reflection from a flat surface of these materials bears a far greater relation to the real index of the materials, n, than to the absorption, α, or imaginary index, k. This is the basic reason that Fresnel specular reflection and FDR bear so little resemblance to the expected molecular absorption features: They're related to the molecular absorptions through a transform.
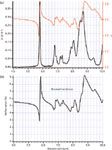
Figure 2: (a) Real (red, right axis) and imaginary (black, left axis) refractive index components for acryloid B67. (b) Calculated specular reflection for acryloid B67 at normal incidence.
The FDR of materials where the surface roughness is larger than the wavelength of the light involved is directly related to the simple specular reflection at a planar surface weighted over many angles of incidence. If we ignore the possibility for multiple reflections, and consider only collimated incident radiation and detect only a collimated component of FDR, then the angle of incidence in play becomes a simple function of the angle between incidence and detection. Thus, a study of simple specular reflection is very informative about the nature of FDR, even on a complex surface.
FDR on fabrics and other materials with diffusely reflecting surfaces is always present, but if it is compared to an appropriate standard, the intensity of FDR is usually not large: Consistent with Figures 1 and 2, it would normally not exceed 10% of the total incident intensity, and is usually closer to 5% for common organic materials with average refractive indices near 1.5, and sometimes less. If the volume, or Kubelka-Munk, component of DR is large enough, then the specular component is usually ignored. For intermediate intensities of the volume component, the FDR leads to shifts in apparent peak positions and nonlinearity in reflection-absorption with concentration of the absorber. In the event of very low volume DR, attenuation peaks may not appear at the positions of absorption bands at all.
Most practitioners of vibrational spectroscopy perform experiments in which they can neglect the dispersion of optical constants — dilute transmission measurements, for instance. For this reason, we often don't spend much time thinking about the specular component of reflection. However, under some conditions, shifts in peak positions and nonlinearities can be observed in transmission, ATR, diffuse transmission and reflection, transflection, grazing angle, and other experimental measurements as a result of the way optical constants change because of molecular absorptions. These are among the most common spectral "artifacts" observed in linear absorption-based vibrational spectroscopy (artifacts because of sampling, heterogeneity, and instrumentation are likewise very common). Sometimes, these dispersion-based artifacts are so large that they dominate the behavior of substances. For example, the fact that liquids with strong dispersion caused by absorption bands can be used to make narrow infrared transmission filters was discovered in the 19th century (4,5). Likewise, a strong absorption combined with a low real index can produce narrow MIR regions in which the dielectric constant becomes negative, leading to very high reflection like a metal (and for the same reason) (6). Neither of the polymers for which data are shown in Figures 1 and 2 will exhibit reststrahlen bands of this sort in the mid-infrared because their dielectric constants never fall low enough.
The MIR DR spectrum of fabrics is, in many places, dominated by FDR because of strong absorption. For this reason, we were interested in looking specifically at FDR and trying to understand how it might change when a fabric is coated with another absorbing dielectric film material. We approached this problem by assuming that the fibers in our fabric were large and irregularly aligned so that diffraction effects could be ignored and a geometrical optics perspective could be assumed. In that event, an understanding of the spectral features expected of a coated fiber could be obtained by studying the reflectance from a planar surface as a function of the angle of incidence, because the fiber surface could be considered a summation of planar surfaces at different angles.
In this limiting condition, thin film calculations based on realistic optical constants are more accurate than experimental measurements, since a range of samples consisting of perfect films on perfect substrates is difficult to obtain for a variety of reasons. Hence, all the figures presented below are based on the optical constants of Figures 1 and 2, with their specular reflection spectrum calculated using the matrix approach developed by Abeles (7). The models are based on a semi-infinite slab of one polymer coated with a thin film of a second, with air as the medium of incidence. This can serve as a model or guide to the FDR effects on coated fibers, or coated polymers of any sort, when both are dielectric media.
Thin Films of Acryloid B67 on Polystyrene at Normal Incidence
The specular reflection from uncoated polystyrene is illustrated in Figure 1b. In Figure 3, this curve is repeated as the first spectrum in a series with coatings of acryloid B67 ranging in thickness from 0 µm to 2.5 µm in steps of 0.1 µm. Simplistically, one might have expected the specular reflection spectrum to look like a sum of Figures 1b and 2b, but this is not exactly the case.
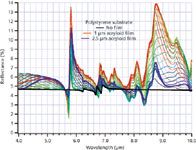
Figure 3: Calculated specular reflection of polystyrene coated with films of acryloid B67 for film thicknesses of 0â2.5 µm.
Although the overlap of the many curves obscures the detail slightly, the overall reflectance for the acryloid-coated polystyrene is usually a bit higher than for film-free polystyrene. If we were observing the reflectance of the assembly with a method that integrates across the wavelength band (for example, with a camera and bandpass filter), the presence of the film would generally increase the overall reflectance.
At first glance, it appears that the calculated spectrum is perhaps a weighted sum of the two independent films. However, closer inspection reveals some unusual features. The polystyrene derivative feature near 6.25 µm, for instance, appears to invert in sign in the presence of the film. This is a substrate dispersion feature in a window of low absorption for the film. Meanwhile, the acryloid feature near 5.8 µm appears as the film thickens and never inverts. This is a film dispersion feature in a region of transparency for the substrate.
At the two wavelengths, 8.5 and 5.5 µm, where the two materials have the same real refractive indexes, we observe that the reflection is constant with film thickness at the former, but varies with thickness at the latter generally rising in the presence of the film. This is a result of the fact that the film shows strong absorbance at the latter, but not at the former, wavelength. The substrate shows little absorption at either wavelength.
Thin Films of Polystyrene on Acryloid B67 at Normal Incidence
Inversion is characteristic of substrate dispersion features, while film dispersion features never invert, as shown below.
We reverse the order of materials in Figure 4, showing thin films of polystyrene on a substrate of pure acryloid B67 in steps of 0.1 µm up to a total thickness of 2.5 µm. In this case, it is the strong acryloid dispersion feature near 5.8 µm that inverts in the presence of the film, while the weaker polystyrene feature near 6.25 µm appears and does not invert.
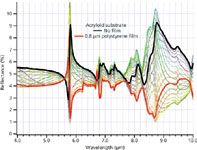
Figure 4: Calculated specular reflection of acryloid B67 coated with polystyrene for film thicknesses of 0â2.5 µm.
For this material ordering, the overall reflectance, integrated across the wavelength region, generally decreases in the presence of the film. A camera view of this wide band would show regions coated with the film to darken.
As in the preceding case, the reflectance near 5.5 µm remains constant, a region of equal refractive index and little absorbance in both materials. At the 8.5-µm wavelength, the reflectance varies in the presence of the film, oscillating around the value for the substrate alone.
General Thickness Dependence of Bands
Figures 3 and 4 provide a general perspective on the effects of a film on substrate specular reflection features. Figures 5 and 6 show detail on how the features change with thickness.
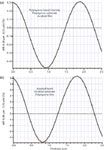
Figure 5: Substrate dispersion features: (a) Calculated strength of the derivative feature of polystyrene near 6.25 µm when it is coated by thicknesses of acryloid B67 between 0 and 2.5 µm; (b) calculated strength of the derivative feature of acryloid B67 near 5.8 µm when it is coated by thicknesses of polystyrene between 0 and 2.5 µm.
In Figure 5, the strength of dispersion features associated with both substrates are compared. This comparison is made by plotting the difference between the maximum and minimum reflectance for a specific dispersion feature as a function of film thickness. For the polystyrene substrate, the plot shows the strength of the feature near 6.25 µm as indicated by the differential of reflectance between 6.26 and 6.22 µm. For the acryloid substrate, the strength of the 5.8-µm feature is indicated by the differential of reflectance between 5.8 and 5.74 µm. In each case, the differential begins as a positive value and inverts, then reverses. For polystyrene, the period of the inversion is 2.0-µm at this wavelength, corresponding to an optical thickness of about 3.2 µm, a bit more than a half wavelength. For acryloid B67, the period is about 2.0 µm, for an optical thickness of 3.1 µm of the polystyrene film, again just more than a half wavelength. In both instances, the oscillation is nominally a cosine wave, but starting slightly on the down slope of the oscillation at zero film thickness.
Figure 6 shows a similar plot for bands of the same materials as films. In each case, the bands start out with zero intensity (there are offsets in each case because of the underlying shape of the substrate reflection spectrum). Each film band increases in intensity up to about a quarter wavelength optical thickness, and then decreases. The polystyrene band has a clear sinusoidal shape, while the acryloid band is a damped sinusoid. In each case, the maximum intensity of the oscillation is significantly greater than the intensity of the band for the pure material. The strong absorbance of acryloid in the region of its dispersion feature causes a loss of interference effects between the two interfaces of the film even over a 2.5-µm film thickness, and it begins to settle toward the strength the feature shows for the pure acryloid. Polystyrene's absorbance is so much lower that a much greater thickness would be needed to see this dampening.
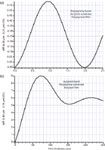
Figure 6: Film dispersion features: (a) Calculated strength of the derivative feature of polystyrene near 6.25 µm when it coats acryloid B67 with thicknesses between 0 and 2.5 µm; (b) calculated strength of the derivative feature of acryloid B67 near 5.8 µm when it coats polystyrene with thicknesses between 0 and 2.5 µm.
Angle and Polarization Dependence
To this point, all the simulations have been at normal incidence, so polarization of light was undefined. For non-normal incidence, the reflectance depends on the polarization state of the incident light.
Figure 7 shows the thickness dependence of the polystyrene substrate dispersion feature at 6.25 µm for angles of incidence at 0°, 30°, and 60°. The Brewster angle for polystyrene is a bit less than 60° at this wavelength. Figure 7a shows the behavior of the reflectance for s-polarized light, while 7b shows the same for p-polarized light.
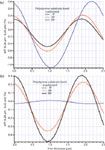
Figure 7: Strength of the 6.25 µm derivative feature of polystyrene specular reflection as a function of the angle of incidence when it is coated by acryloid B67 having thicknesses between 0 and 2.5 µm. (a) s-polarized and (b) p-polarized.
For s-polarized light, the reflectance increases monotonically with angle for a simple dielectric material. Thus, the film-free polystyrene substrate has a greater and greater overall reflectance at increasing angles, and the derivative-shaped dispersion feature also increases in strength. But in the presence of the film, the polystyrene feature inverts and reverses as it did at normal incidence, with a thickness dependence whose cycle is slightly longer than at normal incidence.
Reflectance for p-polarized light passes through a minimum at the Brewster angle, after which the phase of the reflected light is shifted by 180°. Consequently, the polystyrene dispersion feature weakens and then inverts with the angle for a film-free substrate. Likewise, the oscillation of the feature normally observed in the presence of a film also changes sign past the Brewster angle.
Figure 8 shows the behavior of the acryloid film band near 5.8 µm as a function of angle for both s- and p-polarizations. For s-polarization, the behavior at 0° is qualitatively retained, but at higher intensity with larger angles of incidence. That is, there is no inversion, and the oscillation is dampened by absorption toward the value exhibited by a film-free acryloid substrate. However, the plot for p-polarization shows a very interesting phenomenon: As the angle approaches the Brewster angle for the substrate, peak positions for film bands in the reflectance begin to shift and change intensities. For this reason, the plot in Figure 8b is not produced by taking the difference in maximum and minimum reflectance values, but as a simple reflectance at a single wavelength, 8.77 µm. The reflectance for p-polarized light at the 60° angle for polystyrene at this wavelength is low — only about 0.1%. The addition of the film leads initially to a drop in reflectance because the calculation is not exactly for the Brewster angle. However, the reflectance ultimately rises to 1.2% for about a ¼-wave thickness of the polymer. Thus, for p-polarized light near the Brewster angle for the substrate, the uncoated substrate would have almost negligible reflectance. The presence of a film would dramatically increase the reflectance at the wavelength of an absorption peak of the film.
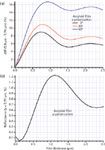
Figure 8: (a) Calculated strength of the derivative feature near 5.8 µm for the s-polarized specular reflection of acryloid B67 as a function of angle when it coats polystyrene. (b) Calculated p-polarized specular reflection at 5.77 µm for the polystyrene (substrate)âacryloid B67 (film) system at an angle of 60° incidence.
From Figures 7 and 8, it is apparent that p-polarization, particularly near the Brewster angle for the substrate polymer, may hold some features of interest. Figure 9 illustrates this, showing the p-polarized reflection spectrum for varying films thickness of acryloid on polystyrene at 60°, near the Brewster angle of the substrate. As expected, the reflectance of polystyrene is very small under these conditions. More interesting is the shape of the reflection caused by the presence of thin films of acryloid. Not only does the film give rise to noticeable reflectance compared to the substrate alone, but a quick comparison to the imaginary index for acryloid in Figure 2 will show that the reflection spectrum bears a striking resemblance to the absorption spectrum of the film material, albeit with the complication of an interference-induced oscillation.
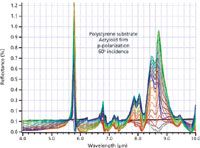
Figure 9: Calculated p-polarized specular reflection of polystyrene coated with thicknesses of acryloid B67 between 0 and 2.5 µm when the angle of incidence is 60°.
Conclusions
Taken together, the simulations presented above illustrate the complexity of specular reflection and FDR that is unavoidable in MIR diffuse reflection studies of coated dielectric materials. Oscillations of the specular reflectance of up to several percent of the incident intensity occur because of dispersion of the optical constants of the material near absorption features. When coated, these features for the substrate material diminish and invert, then reverse sinusoidally. Absorption in the film at the same wavelength will ultimately remove these oscillations of the substrate reflectance when the film is thick enough. The behavior is strongly angle- and polarization-sensitive, changing sign for p-polarization at angles beyond the Brewster angle.
Unlike substrate bands, derivative shaped features because of dispersion in the film optical constants generally don't reverse with thickness, but instead grow and diminish with thickness. Beyond the Brewster angle of the substrate, they may ultimately invert for thick absorbing films.
The behavior of the film or substrate system is quite complex over a broad wavelength range because of the varying optical constants of the two materials. Applications for the specular component of reflectance can be found especially in the spectral regions dominated by high substrate absorption, which limit the measured reflectance to phenomena occurring on the topmost surfaces of diffusely reflecting materials.
For example, the results shown above suggest that the presence of a sub-micrometer film is detectable, and even a rough estimate of its thickness can be obtained from measurements of the substrate bands alone in regions of strong substrate absorption. A comparison measurement of an uncoated reference substrate can provide relative intensities of dispersion features for comparison to a potentially coated material. Because of the wavelength dependence of the inversion phenomenon for substrate features, a comparison of the strengths of features at two wavelengths could put upper limits on the thickness of any possible film, regardless of its nature, provided it is a dielectric material. Likewise, accurate deposition of a nonabsorbing film to a substrate could assure that dispersion "artifacts" are minimized in the diffuse reflection spectrum of a material over a modest wavelength range.
Similarly, coating uniformity on a surface could be mapped by focusing on strong absorption features of the substrate that cause FDR to dominate their reflectance. Wear of an exposed coating could also be studied in this way.
The use of polarized infrared light with an angle of incidence near the Brewster angle of the substrate may, for certain samples, provide unique information about submicrometer thin films on those substrates if conditions are such that reflections from below the surface are avoided. In this case, conventional infrared spectral identification can be applied to the reflection spectrum because the bands take the shape of the film absorptions.
Overall, specular and Fresnel diffuse reflection are tools that we rarely seek to use in chemical analysis, yet they show some promise for the investigation of surfaces and coatings. Under normal circumstances, DR is done under conditions that minimize the specular component of reflection. However, if the volume component of reflection is minimized — either by using a semi-infinite substrate or working with wavelengths of strong substrate absorption — then the specular component may have information that can be readily interpreted.
Acknowledgments
This project was supported by Award No. 2011-IJ-CX-K055 awarded by the National Institute of Justice, Office of Justice Programs, U.S. Department of Justice. The opinions, findings, and conclusions or recommendations expressed in this publication, program, or exhibition are those of the authors and do not necessarily reflect those of the Department of Justice.
M.L. Myrick and Stephen L. Morgan are professors in the Department of Chemistry and Biochemistry at the University of South Carolina in Columbia, South Carolina. Direct correspondence to: myrick@mailbox.sc.edu.
References
(1) Absorption and Scattering of Light by Small Particles, C.F. Bohren and D.R. Huffman, Eds. (John Wiley, New York, New York, 1983).
(2) W. Folks, S. Pandey, G. Pribil, D. Slafer, M. Manning, and G. Boreman, Int. J. Infrared Millimeter Waves 27, 1553 (2006).
(3) M.R. Pearl, H. Brooke, J. McCutcheon, S.L. Morgan, and M.L. Myrick, Appl. Spectrosc. 65, 876 (2011).
(4) C. Christiansen, Ann. Phys. 23, 298 (1884).
(5) C. Christiansen, Ann. Phys. 24, 439 (1885).
(6) Reflection Spectroscopy, G. Kortum, Ed. (Springer, Berlin, Germany, 1969).
(7) Optical Properties of Thin Solid Films, O.S. Heavens, Ed. (Dover, New York, New York, 1991).

AI Shakes Up Spectroscopy as New Tools Reveal the Secret Life of Molecules
April 14th 2025A leading-edge review led by researchers at Oak Ridge National Laboratory and MIT explores how artificial intelligence is revolutionizing the study of molecular vibrations and phonon dynamics. From infrared and Raman spectroscopy to neutron and X-ray scattering, AI is transforming how scientists interpret vibrational spectra and predict material behaviors.
Real-Time Battery Health Tracking Using Fiber-Optic Sensors
April 9th 2025A new study by researchers from Palo Alto Research Center (PARC, a Xerox Company) and LG Chem Power presents a novel method for real-time battery monitoring using embedded fiber-optic sensors. This approach enhances state-of-charge (SOC) and state-of-health (SOH) estimations, potentially improving the efficiency and lifespan of lithium-ion batteries in electric vehicles (xEVs).
New Study Provides Insights into Chiral Smectic Phases
March 31st 2025Researchers from the Institute of Nuclear Physics Polish Academy of Sciences have unveiled new insights into the molecular arrangement of the 7HH6 compound’s smectic phases using X-ray diffraction (XRD) and infrared (IR) spectroscopy.