Interpretation of Raman Spectrum of Proteins
In this month’s column, I review the band assignments of a protein spectrum, pointing out why it can be useful to know the band assignments when attempting to use the Raman spectra to understand the functionality of proteins. In fact, the American Chemical Society (ACS) has just issued a virtual issue of Journal of Physical Chemistry entitled “Protein Crowding and Stability,” discussing how the protein conformation impacts its biological functionality. I address how the Raman spectra can help with the determination of protein structure.
Because of the successes of Raman spectroscopy in recent years in many fields, including biomedical applications, its use is attracting interest. Although successful applications require the use of sophisticated software algorithms to tease out the information from complex data sets, it still can be useful to understand the origin of some of the characteristic spectral features. In the case of proteins, the CH–NH region does not show huge variations, but the fingerprint region is quite variable, and spectroscopic assignment of the chemical origin of a significant number of those variations can be made. With this type of information, it then becomes possible to begin to infer biochemical changes or function from the spectra.
In this column, I review what is known about the Raman spectra of proteins. What is discussed is not new information; it is available in numerous sources (1–4). My hope is that individuals thinking about using Raman spectroscopy in their research can benefit from my explanation.
Representative Spectrum of a Protein
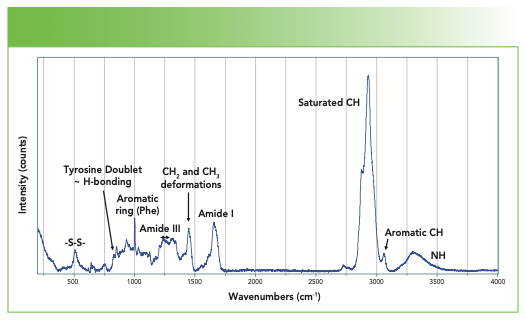
Figure 1 shows the spectrum of a fingernail, with the major bands of interest indicated. We treat each region individually. The nails are composed of α-keratin that has a high content of alanine, leucine, arginine, and cysteine, assembled into a helix similar to the α-helix, and with a coiled arrangement that provides the strength of a fibrous structure.
FIGURE 1: Full Raman spectrum of a fingernail.
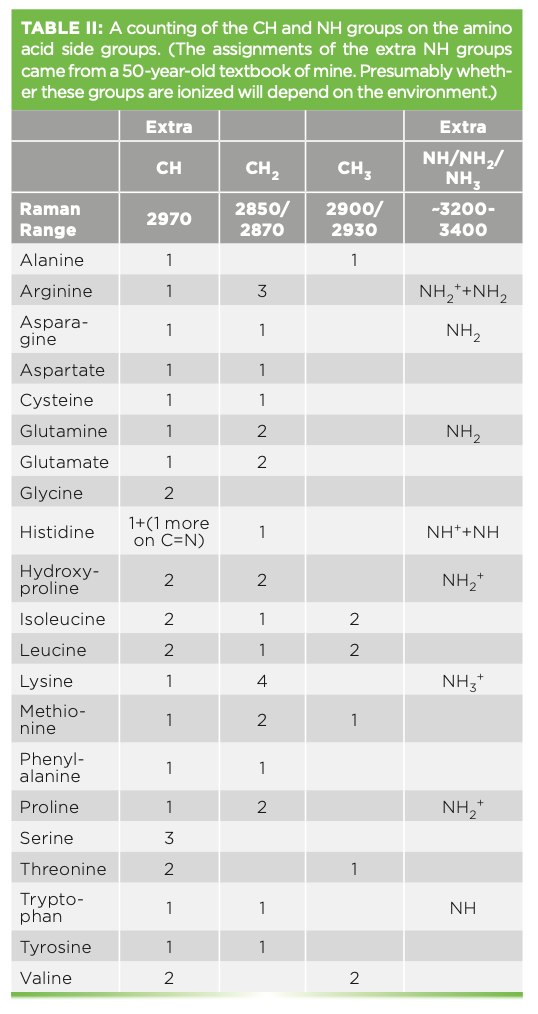
In forming a protein, there is a condensation of two amino acids to form each peptide bond that is shown in Figure 2. R represents the side groups that provide the identification of each particular amino acid. The amide I and amide III bands represent motion of atoms of the peptide backbone. Both the amide I and amide III bands reflect coupled vibrations of the backbone, which depend on the secondary structure of the protein. Note that there is one NH group and one CH group associated with every amino acid in the backbone. But there are additional NH and CH groups from particular amino acid sidegroups that are tabulated in Table II.
FIGURE 2: Schematic representation of the condensation of two amino acids to form a peptide.

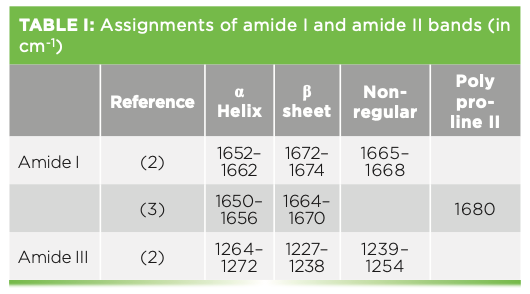
When the spectra of individual regions are shown, they are shown with bandfitting, which is used to analyze a protein’s structure. In reviewing a few articles that make assignment of amide bands, there is not always agreement in the band assignments. Table I lists the frequencies of the amide I and III bands, with reference to two publications indicating the variations. Despite this lack of absolute assignment, it has still been found to be useful to bandfit and determine rough estimates of relative amounts of structure.
In addition to these amide bands, which involve coupled motions of the carbonyl stretch, the backbone C–N stretch, and the NH bend, there are also NH stretches. Because the NH bond can readily H-bond, the peak frequency moves around and broadens. There are also CH bands, all of which fall below 3000 cm-1 except for the aromatic CH at ~3060 cm-1. First, we look at the CH–NH region and then the carbonyl region.
CH–NH Stretches
Because I am going to try to make sense of the structure in the CH and NH region, I found it useful to tabulate the additional NH and CH bands that arise from the side group structures and note where their peak frequencies are believed to fall, which is shown in Table II.
The fitting has revealed three relatively broad bands in the NH region for this protein (Figure 3). One would expect these bands to reflect changes in conformation and hydrogen bonding interactions in the molecule in the vicinity of the NH groups.
FIGURE 3: CH–NH region of the spectrum, bandfitted with the band assignments indicated.
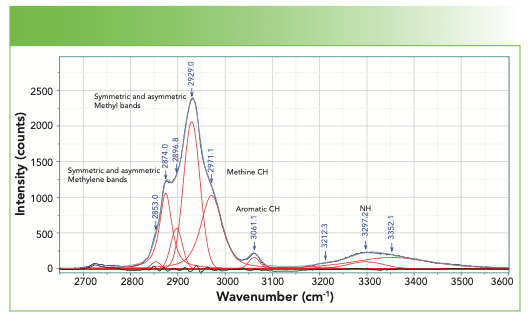
In the CH region, the highest frequency band is the aromatic CH that appears at 3061 cm-1, the value that is most often quoted for an aromatic CH. Note that this band can move 10–15 cm-1 in some modified compounds.
In the saturated CH region, we fit five bands and can match these bands to predictions from assignments of classical organic molecules. The methylene group often has symmetric and asymmetric stretches respectively near 2850–2900 cm-1, whereas a methyl group has symmetric and asymmetric stretches respectively at approximately 2875–2920 cm-1 (5). The band at 2971 cm-1 is assigned to the methine CH. Generally, the envelope of CH bands looks quite similar from protein to protein, but a careful evaluation of the spectra of proteins with a small number of known differences might enable a careful interpretation in regard to the integrated intensities of these bands.
Amide I and Aromatic Bands
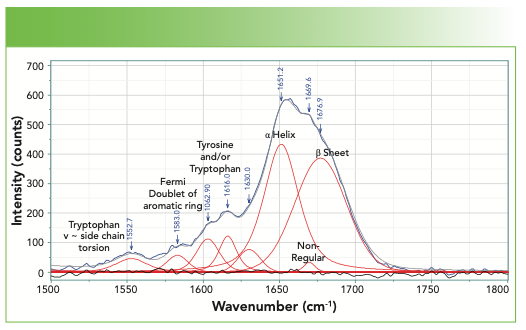
Figure 4 shows the spectrum in the amide I region. In addition to the bands of the amide backbone, there are aromatic bands that have also been assigned (4). For anyone interested to see how much the bands in the Amide I region change in different chemical environments, reference 6 is a good place to start (6).
FIGURE 4: Spectrum of a fingernail in the region of the Amide I, including some aromatic bands below 1620 cm-1.
Disulfide Stretch and Other Bands that Reflect the Presence of S
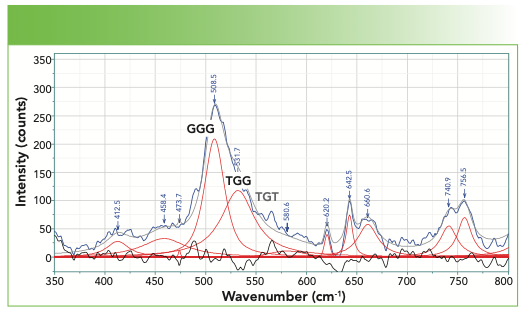
There is one more region where the spectra are not complex, and that is the region around 500 cm-1, where the -S-S- stretch appears (Figure 5). The two bands that appear in the fit above 500 cm-1 are labeled GGG and TGG, where the G and T refers to the gauche or trans dihedral angles of the following unit:
-C-C-S-S-C-C-
There is a third possibility that can also be observed—TGT, with the peak at approximately 540–545 cm-1 (its position is labeled in gray in Figure 5 because it is missing in this protein spectrum). There are also C-S bands of the cysteine or methionine unit containing the sulfur; the frequency falls between 630–760 cm-1, depending on sidegroups and other considerations. For anyone who is more interested, refer to the literature (2).
FIGURE 5: The spectrum of the disulfide stretches.
In addition, if the sulfur atoms on cysteine or methionine are not bound up with sulfur atoms on other amino acids, there can be free -SH groups (unless the environment is quite basic), whose stretches appear in the region between 2500–2600 cm-1.
Fingerprint Region
Finally, we examine the bulk of the fingerprint region not yet considered, which is 800–1500 cm-1 in Figure 6. The bandfitting has identified many more bands than those whose origins have been labeled. The user needs to realize that in this region of the spectrum there is extensive mixing of motion of the atoms so mathematical normal modes analysis is often necessary. However, the bands that are labeled are well established. The aromatic ring stretch for phenylalanine stands out and is easily recognizable. Note that tyrosine, which also has a ring, does not exhibit a band here because of its parasubstitution. However, the Fermi resonance doublet at 1580 and 1600 cm-1 represents these two amino acids that have aromatic rings. In addition, the band at 1616 cm-1 is assigned to both the tyrosine and the tryptophan.
FIGURE 6: Spectrum of a fingernail in the fingerprint region between 800–1500 cm-1.
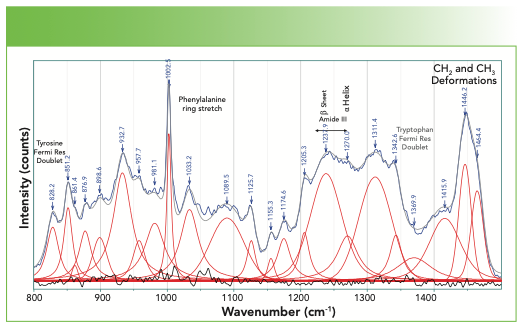
The amide III band also falls in this region, and the fitting reveals two bands that identify the presence of the α-helix and β-sheet.
The spectral region of Figure 6 also includes two Fermi resonance doublets that have been used to characterize these proteins. The doublet near 860 and 830 cm-1 is assigned to tyrosine, and its relative intensity, which varies between 0.3 and 6.7, has been shown to be an indicator of H-bonding (4).
The spectrum of tryptophan also exhibits a Fermi resonance doublet, with lines at approximately 1360–1340 cm-1. When the relative intensity is greater than 1.1, the sidegroup is sitting in a hydrophobic environment, but when it is less than 0.9, it is in a hydrophilic environment. The location of this doublet is indicated in Figure 6, but the label is gray rather than black because the absence of the higher frequency component makes its assignment in this spectrum questionable.
How Much Have You Absorbed?
I am going to display a series of figures with protein spectra of related origins. See if you can discern some of the spectral differences from protein to protein. For easy comparison, all spectra will be scaled to the CH stretch at 2930 cm-1.
The cuticle, whose spectrum is shown in Figure 7, was a piece of skin that I removed from next to my fingernail. It is composed of dead skin cells, and the protein composition of skin cells is keratin. The skin cells that I collected from my epidermis are also composed of keratin but with lipids as well. What are the outstanding differences between the spectra in Figure 7? I see that the fingernail has much more disulfide. I also see that the structure in the amide I region is different. And I also see that the skin has features of lipids that are on the skin. You may remember the characteristics of the lipid spectra from a previous column.
FIGURE 7: Raman spectra (from top to bottom) of a cuticle, fingernail, and skin cell.
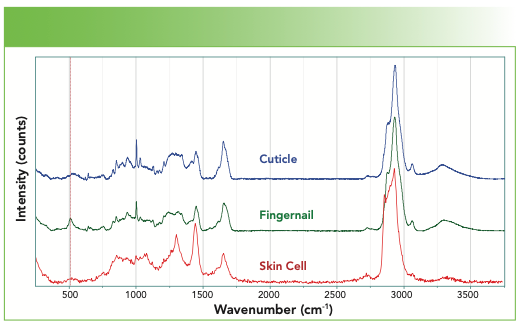
Figure 8 overlays the spectra of fingernail, a liquid egg white, a dried egg white, and the membrane inside of an egg shell. Can you see the presence of water in the liquid egg white in Figure 8? That’s easy, but can you discern the presence of the NH in the water spectrum? What other differences can you see between the spectra?
FIGURE 8: From top to bottom, Raman spectrum of a fingernail, liquid egg white, dried egg white, and the membrane inside the shell of a chicken egg.
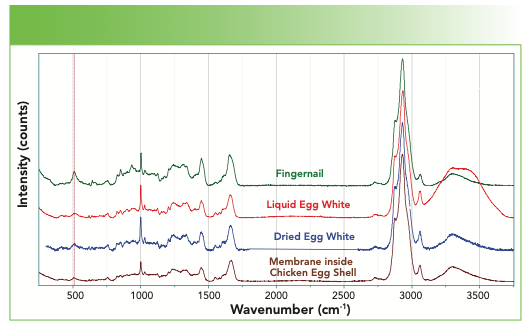
Figure 9 overlays the spectra of fingernail, chicken fascia, chicken tendon, pink muscle excited at 532 nm, and pink muscle excited at 638 nm. You can see that the chicken tendon has much more detail in the fingerprint region. Can that be used to infer something about the structure of the collagen with its important mechanical properties? This is a fibrous protein that is composed of 65% collagen. On each chain, every third amino acid is a glycine, and many others are proline and hydroxyproline and they assemble into a left-handed helix. Three of these left-handed helices assemble into a right-handed helix with 30 residues per turn. There is cross-linking between chains via H-bonds and intermolecular ester linkages; with aging, the H-bonds convert to covalent cross links. All of this provides strength to the tendon. On the other hand, muscle also contains collagen, but is dominated more with actin and myosin for contractility, and troposin and tropomyosin for regulatory function. What differences do you see in these spectra that can be related to their composition?
FIGURE 9: From top to bottom, Raman spectrum of a fingernail, chicken fascia, chicken tendon, pink muscle (532 nm excitation), and pink muscle (638 nm excitation).
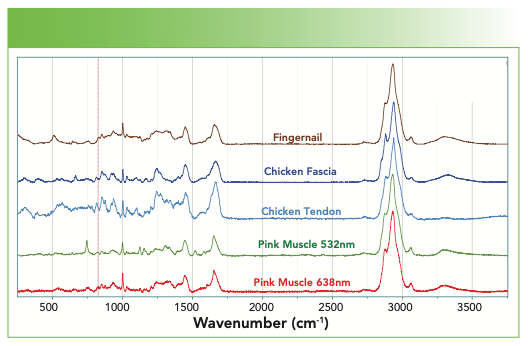
Figure 9 also has a trick for which I did not prepare you. Why are the two spectra of the pink muscle different when excited at different wavelengths? Why is the muscle pink? Animal muscles can be pink because of the presence of myoglobin, mitochondria, or both. They contain hemes whose absorption in the visible results in resonance enhancement, especially when exciting with a green laser which overlaps with the absorption of the heme. The extra sharp bands in the spectrum excited in the green are resonance-enhanced bands of the heme (7).
Conclusion
In reviewing these spectra and the information on interpretation, I do not expect that you will be an expert. In fact, I spent much more time writing this article than I expected, because I had a general idea of what was present in the spectra, but did not understand it enough to put it in words with confidence that I would get the information correct. But if you spend some time going over this, and then need to work with Raman spectra of proteins, you will have a heads up on what you are looking at. Once you are aware of the possibilities, you can choose the tool that is most appropriate for you to get the information that you need—band-fitting, chemometrics, or 2D-COS. Good luck and have fun!
References
(1) A.T. Tu, Raman Spectroscopy in Biology: Principles and Applications (Hoboken, John Wiley, 1982).
(2) T. Kitagawa and S. Hirota, in Handbook of Vibrational Spectroscopy – Applications in Life, Pharmaceutical and Natural Sciences, vol. 5, John M. Chalmers and Peter R. Griffiths, Eds. (Wiley & Sons, Hoboken, NJ, 2002), pp. 3426–3446.
(3) R. Tuma, J. Raman Spectrosc. 36, 307–319 (2005).
(4) D. Nemecek, J. Stepanek, and G.J. Thomas, Jr., Proteins and Nucleoproteins Curr. Protocols in Protein Sci. 71(1), 17.8.1–17.8.52 (2013).
(5) George Socrates, Infrared and Raman Characteristic Group Frequencies Tables and Charts (Wiley & Sons, Hoboken, NJ, 2001).
(6) N.C. Maiti, M.M. Apetri, M.G. Zagorski, P.R. Carey, and V.E. Anderson, J. Am. Chem. Soc. 236, 2399–2408 (2004).
(7) F. Adar, M. Gouterman, and S. Aronowitz, J Phys. Chem. 80, 2184–2191 (1976).
Fran Adar is the Principal Raman Applications Scientist for Horiba Scientific in Edison, New Jersey. Direct correspondence to: SpectroscopyEdit@mmhgroup.com. ●

AI-Powered SERS Spectroscopy Breakthrough Boosts Safety of Medicinal Food Products
April 16th 2025A new deep learning-enhanced spectroscopic platform—SERSome—developed by researchers in China and Finland, identifies medicinal and edible homologs (MEHs) with 98% accuracy. This innovation could revolutionize safety and quality control in the growing MEH market.
New Raman Spectroscopy Method Enhances Real-Time Monitoring Across Fermentation Processes
April 15th 2025Researchers at Delft University of Technology have developed a novel method using single compound spectra to enhance the transferability and accuracy of Raman spectroscopy models for real-time fermentation monitoring.
Nanometer-Scale Studies Using Tip Enhanced Raman Spectroscopy
February 8th 2013Volker Deckert, the winner of the 2013 Charles Mann Award, is advancing the use of tip enhanced Raman spectroscopy (TERS) to push the lateral resolution of vibrational spectroscopy well below the Abbe limit, to achieve single-molecule sensitivity. Because the tip can be moved with sub-nanometer precision, structural information with unmatched spatial resolution can be achieved without the need of specific labels.