LC–MS-MS Determination of Malachite Green and Leucomalachite Green in Fish Products
Special Issues
Although not currently used in U.S. or European aquaculture, malachite green (MG) is still an effective and inexpensive fungicide that is used in other countries, particularly in Asia. During metabolism, MG reduces to leucomalachite green (LMG) (Figure 1), which has been shown to accumulate in fatty fish tissues. Trace levels of MG and LMG residues continue to be found in fish products. In a 2005 report, MG was found in 18 out of 27 live eel or eel products imported from China to Hong Kong local market and food outlets, resulting in a government recall and destruction of all remaining products (1).
Although not currently used in U.S. or European aquaculture, malachite green (MG) is still an effective and inexpensive fungicide that is used in other countries, particularly in Asia. During metabolism, MG reduces to leucomalachite green (LMG) (Figure 1), which has been shown to accumulate in fatty fish tissues. Trace levels of MG and LMG residues continue to be found in fish products. In a 2005 report, MG was found in 18 out of 27 live eel or eel products imported from China to Hong Kong local market and food outlets, resulting in a government recall and destruction of all remaining products (1).

Figure 1
Detection of MG and LMG has been reported by using UV–vis spectroscopy, fluorescence spectrometry, and mass spectrometry (MS) coupled to high performance liquid chromatography (HPLC) separation. Among these detection techniques, the sensitivity and selectivity are poor with UV–vis spectroscopy, and the fluorescence detection requires a postcolumn oxidation (for example, with lead oxide) to convert LMG to MG. Only MS has demonstrated the ability to detect both LMG and MG without postcolumn oxidation as well as with superior sensitivity and selectivity (2). In particular, liquid chromatography coupled with tandem MS (LC–MS-MS) analysis has proven to be an excellent technique for the complex samples typically found in food safety applications.
Trace-level analysis of complex samples such as animal tissue presents certain challenges for analytical methods. The sensitivity of LC–MS-MS analysis can be affected by the chemical noise produced by a complicated sample matrix. Highly selective reaction monitoring (H-SRM) is a more advanced form of selective reaction monitoring (SRM), a longstanding quantitative technique used on triple-quadrupole mass spectrometers for quantitation. H-SRM can eliminate chemical noise, lower detection limits, and reduce the likelihood of generating false positives — all key aspects for food safety applications. More stringent tolerances account for the higher selectivity of the analyte, which leads to lower limits of quantitation (LOQs) and increased precision and accuracy especially at the limits of detection, thus giving the user more confidence in the quantitative assays (3).
In this article, an LC–MS-MS method to detect MG and LMG in roasted eel meat using a triple-quadrupole mass spectrometer operated in H-SRM mode is reported. The method is sensitive and selective, and has been validated for routine detection of < 0.5 μg/kg of MG and LMG. Moreover, the capability of using H-SRM to reduce the chemical noise in complex sample matrices to improve detection of ultralow-level MG and LMG is demonstrated.
Experimental
Chemicals and Reagents
All chemicals were of reagent grade or better. MG oxalate salt and LMG were from Sigma-Aldrich (St. Louis, Missouri), and d6-LMG from WITEGA (Berlin, Germany).
Sample Preparation
In general, eel meat tissues are fatty, and roasted eel meat contains additional cooking oil and flavor chemicals, making the sample matrix complicated. The extraction of MG and LMG from roasted eel meat involves sample extraction, liquid–liquid extraction, and one or two steps of solid-phase extraction (SPE) cleanup. A similar method using the liquid–liquid extraction (with methylene chloride) and one-step SPE cleanup (with strong cation exchange) also was reported for analysis of MG and LMG in both the raw and the processed eel products (4). For extraction of MG and LMG in other raw fish meats, the procedure could be simplified (5).
Extraction: To 5.00 g of homogenized roasted eel meat, 50 μL of a 1-μg/mL solution of d6-LMG was added as internal standard as well as 1 mL of 0.25-g/L hydroxylamine hydrochloride (NH2OH-HCl), 1 mL of 0.05 M p-toluenesulfonic acid, 2 mL of 0.1 M ammonium acetate buffer (pH 4.5), and 40 mL of acetonitrile. Then the sample was homogenized for 2 min and the mixture was centrifuged at 3000 rpm for 3 min. The supernatants were collected into a 250-mL separation funnel and then the meat was extracted once more with 20 mL of acetonitrile.
Liquid–Liquid Extraction: To the acetonitrile crude extract in the separation funnel, 30 mL of methylene chloride and 35 mL of deionized water was added and then shaken for 2 min. Then the methylene chloride was collected and the aqueous phase was extracted one more time with 20 mL of methylene chloride. After evaporating the combined methylene chloride solvent to dryness, it was reconstituted in 3 mL of 2:98 formic acid–acetonitrile.
SPE: An Oasis 60 mg/3 cc MCX cartridge (Waters, Milford, Massachusetts) was conditioned with 3 mL of acetonitrile and 3 mL of 2% (v/v) formic acid aqueous solution. The sample was loaded (at ~0.2 mL/min) and then washed with 2 mL of 2:98 formic acid–acetonitrile and 6 mL of acetonitrile. Then the sample was eluted with 4 mL of 5:95 (v/v) 5 M ammonium acetate (pH 7)–methanol. The methanol was evaporated at 45 °C under reduced pressure and then diluted to 1.0 mL with an initial mobile phase of 70:30 (v/v) water (0.1% v/v formic acid)–methanol. Finally, it was filtered with a 0.45-μm syringe filter before injection into the LC–MS-MS system.
For very fatty roasted eel tissues, before the SPE with the MCX, the extracts after liquid–liquid extraction were cleaned up with a Superclean 60 mg/3 cc LCAlumina N cartridge (Waters) using the following procedure:
- Condition the cartridge with 3 mL of acetonitrile
- Load the sample, collect the eluate
- Wash with 3 mL of acetonitrile, collect the eluate to be combined with the eluate in the second step
- Add 120 μL of formic acid to the combined eluate.
Chromatography Conditions: The study used the Surveyor HPLC system (Thermo Fisher Scientific) with a 50 mm × 2.1 mm, 5-μm Hypersil GOLD CN column (Thermo Fisher Scientific). Mobile phase A was methanol, and mobile phase B was water with 0.1% (v/v) formic acid. The flow rate was 220 μL/min, and the injection volume was 10 μL.
MS Conditions: The mass spectrometer was the TSQ Quantum Discovery MAX (Thermo Fisher Scientific) with an ESI+, 4000-V source. The capillary temperature was 350 °C, and the source CID was set to -10 V. The collision gas used was argon (1.5 mTorr). See Table I for SRM transitions. The scan time was 0.1 s.

Table I: SMR transitions and collision energy values for MG and LMG
Results and Discussion
Figure 2 shows the comparison of SRM and H-SRM chromatograms of a matrix matched standard (that is, standard spiked into a blank roasted eel extract sample after sample preparation) containing 0.02 pg/μL (0.2 pg on-column) MG and 0.1 pg/μL (1 pg on-column) LMG and with 1 pg/μL internal standard.

Figure 2
As shown, with H-SRM, signal-to-noise ratios (S/N) have improved significantly from 2–5 to 20–25. Note that the S/N improved despite the absolute signal (measured by the peak areas) decreasing by approximately half, indicating that the gains in S/N are from eliminating noise (isobaric interferences) in the sample matrix. The instrument detection limit in the current matrix is thus estimated to be 0.1 pg for MG and 0.5 pg for LMG with H-SRM based upon 10x S/N. These detection limit values, corresponding to 0.004 μg/kg and 0.02 μg/kg for MG and LMG in meat tissues, respectively, have far exceeded our current requirement to detect < 0.5 μg/kg of MG and LMG in roasted eel meat.
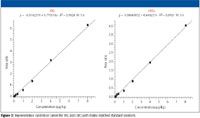
The response linearity was evaluated over the range of 0.05–8.0 μg/kg using matrix matched standard solutions. The correlation coefficients obtained are > 0.99 (weighting factor = 1/x). Figure 3 shows the representative calibration curves.

Figure 3
The analytical method was validated by analyzing fortified roast eel samples at 1-, 2-, and 5-μg/kg levels for both LG and LMG, corresponding to 0.5x, 1x, and 2.5x minimum required performance limit (MRPL), respectively. Seven replicates were performed at each level. The results are summarized in Table II. Excellent recovery values of 90–106% were obtained with RSD% ranging from 3.7% to 11%.

Table II: Recovery % (RSD %) of MG and LMG (ISTD corrected) in roasted eel meat (n = 7)
Conclusions
The LC–MS-MS method was shown to be highly sensitive and selective as well as appropriate for detecting MG and LMG in roasted eel meat. The method shows excellent linearity (0.05–8.0 μg/kg), accuracy (90–106% recovery), and reproducibility (4–11% RSD), far exceeding the European Union's requirement of MRPL of 2 μg/kg of MG and LMG. Additionally, H-SRM was shown to reduce the chemical noise effectively in the complicated sample matrix, which should be useful to improve the method sensitivity and specificity further (that is, to eliminate both false positive and false negative) in support of the FDA and EU's enforcement of a "zero tolerance" policy toward the use of MG and LMG for aquaculture.
This method has been implemented at the Jiangsu Entry-Exit Inspection and Quarantine Bureau laboratory in China for routine monitoring of < 0.5 μg/kg (MG and LMG) in roasted eel and other fish products (with variations of sample preparation procedures). The analytical method development was shown to be highly appropriate for detecting trace levels of these substances in food.
Tao Ding, Jingzhong Xu, Bin Wu, Huilan Chen, and Chongyu Shen are with the Food Laboratory APFIC, Jiangsu Entry–Exit Inspection and Quarantine Bureau (JSCIQ), Nanjing, China. Fei Liu is with Thermo Fisher Scientific in Shanghai, China. Kefei Wang is with Thermo Fisher Scientific in San Jose, California.
References
(1) http://news.gov.hk/en/category/healthandcommunity/050819/html/050819en05002.htm
(2) D.R. Doerge, M.I. Churchwell, T.A. Gehring, Y.M. Pu, and S.M. Plakas, Rapid Commun. Mass Spectrom. 12, 1625-1634 (1994).
(3) T. Ding et al., Chin. J. Chromatography 24(4), 331-334 (2006).
(4) H. Tang PO, T. Tso. S.C., and C. Ho, "Determination of Malachite Green and Leucomalachite Green in Fish Products," 5th International Symposium on Hormone and Veterinary Drug Residue Analysis, Antwerp, Belgium, May 16-19, 2006.
(5) B. Roudaut, B. Delepine, M. Bessiral, and P. Sanders, "Malachite Green and Leucomalachite Green in Fish Flesh by Liquid Chromatography Tandem Mass Spectrometry (Validation of a Confirmatory Method)," 2nd AOAC International Symposium on Recent Advances in Food Analysis, Prague, Czech Republic, November 2-4, 2005.

High-Speed Laser MS for Precise, Prep-Free Environmental Particle Tracking
April 21st 2025Scientists at Oak Ridge National Laboratory have demonstrated that a fast, laser-based mass spectrometry method—LA-ICP-TOF-MS—can accurately detect and identify airborne environmental particles, including toxic metal particles like ruthenium, without the need for complex sample preparation. The work offers a breakthrough in rapid, high-resolution analysis of environmental pollutants.
Trending on Spectroscopy: The Top Content of 2024
December 30th 2024In 2024, we launched multiple content series, covered major conferences, presented two awards, and continued our monthly Analytically Speaking episodes. Below, you'll find a selection of the most popular content from Spectroscopy over the past year.