Lineshapes in IR and Raman Spectroscopy: A Primer
Spectroscopy
Infrared and Raman bands are typically described in terms of peak location and peak height. The shape of the peak-its form, width, and asymmetry-is less well understood. Bandshapes largely depend upon interactions between vibrating molecules and their environment. An understanding of this relationship may enhance spectral interpretation and can explain unexpected behaviors, in both qualitative and quantitative analyses. This paper presents basic concepts that influence line shapes and shows the complex lineshape changes in an apparently simple system of acetone and water.
Infrared (IR) and Raman bands are typically described in terms of peak location and peak height. The shape of the peak-its form, width, and asymmetry-is less well understood. Bandshapes largely depend upon interactions between vibrating molecules and their environment. An understanding of this relationship may enhance spectral interpretation and can explain unexpected behaviors, in both qualitative and quantitative analyses. This article presents basic concepts that influence line shapes and shows the complex lineshape changes in an apparently simple system of acetone and water.
Standard physical chemistry humor holds that you start any model with a sphere, whether fitting cows or electron orbitals. Spectral interpretation starts with a similar first approximation: The vibrational spectra are built from harmonically oscillating independent molecules. However, spectra show unexpected bumps, peak shifts, and strange line shapes that change with temperature and concentration, so the truth is more complex. Cows sometimes have horns.
This introductory article cannot fully encompass chemical dynamics and line shapes. Instead, we focus on general concepts, simply presented, without (much) mathematics or higher order complications. For instance, phenomena such as Fermi resonance and inversion doubling will not be addressed, although they affect even simple molecules like ammonia (1).
Basic Theory
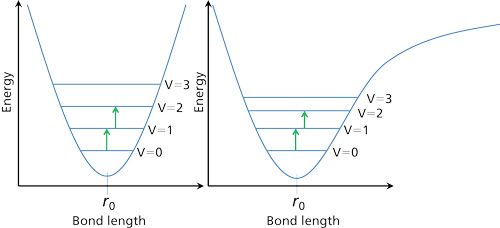
The harmonic oscillator model results in a sequence of evenly spaced, well-defined vibrational energy levels, as seen in the left of Figure 1 (2). Transitions between these energy levels occur by absorption of energy, giving rise to extremely sharp peaks in the absorption spectrum. However, real molecules vibrate anharmonically, rotate, translate, and interact with their environment.
At equilibrium, most molecules are in the ground vibrational state (as determined by the Boltzmann distribution). Some of these molecules transition to an excited state when the IR radiation or Raman excitation strikes the sample. Then, dynamics take over.
Vibrationally excited molecules relax to the ground state within a few picoseconds (10-12 s). This is called the lifetime (or amplitude correlation time, τa). Initially, all of the excited molecules are vibrating together (coherently), but motion and slight differences in vibrational frequencies randomize the oscillations-known as dephasing-also within a few picoseconds (the coherence lifetime, τc). The spectrometer can only “see” the molecules while they are both excited and coherently vibrating. These phenomena combine to produce an effective lifetime, τ, that is dominated by whichever mechanism (relaxation or dephasing) results in the fastest decay (3).
The first crucial rule for understanding the physics of lineshapes is that as the effective lifetime shortens, the linewidth broadens. Essentially this effect occurs because of the energy-time uncertainty principle, which can be stated as ΔEτ ≥ ½Ä§. ΔE is the spread of energies (essentially the line width) and ħ is Planck’s constant divided by 2π. Since ħ is a constant, ΔE must increase as τ decreases to maintain the relationship. Derivation of this equation is beyond our scope; see the references for details (2,3).
There are two interesting limiting cases (3). In the first limiting case, relaxation is much faster, meaning the coherence time is long by comparison (τc >> τa). Alternately, molecular motions may be rapid, causing dephasing to be faster (τc << τa). In the first case (τc >> τa), the excited molecule relaxes before dephasing sets in. This is the case for solids, where the environment is relatively static. Within the solid, molecules can experience a statistical distribution of environments, and the line shape takes on the bell curve or Gaussian profile.
In the second case (τc << τa), dephasing is the dominant signal loss channel. Dephasing occurs in gases where molecules are in rapid continuous motion. The resulting line shape is Lorentzian, sharp in the center but with long wings.
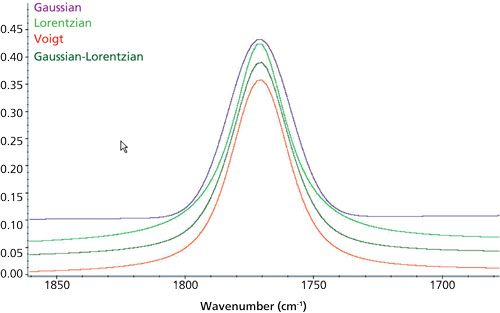
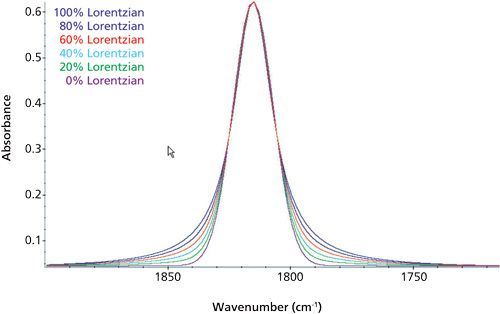
Liquids exist between these limits, where interactions prevent extremely rapid motion, but the molecules are not locked in place. As a result, τc ≈ τa, which results in lineshapes with features of both Gaussian and Lorentzian character. The simplest model for this situation is a combined Gaussian-Lorentzian (G–L) profile, represented as A*L + (1 - A)*G with A being the fraction of Lorentzian character (0 ≤ A ≤1). A more complex description for liquids is the Voigt profile, where the Gaussian and Lorentzian characters are convoluted (combined in the Fourier transform integral). The mathematical form for a Voigt profile allows the Gaussian and Lorentzian portions to have different line widths. Figures 2 and 3 show various shape changes when center frequency, peak height, and linewidths are held constant but the bandshape function changes (4).

Unexpected Bumps: Hot Bands and Isotope Bands
Normally, vibrational bands involve transitions from the ground state to the first excited state (v = 0 to v = 1). However, thermal energy can cause vibrational hot bands to arise. Hot bands result when the first vibrational energy level is significantly populated. The excitation can then cause a transition from the first excited state to the second (v = 1 to v = 2). In a harmonic oscillator, this would occur at the exact same frequency as the v = 0 to v = 1 transition (the left of Figure 1). However, anharmonicity lowers the v = 2 energy slightly, making the 1→2 transition slightly lower in energy than the 0→1 transition (the right of Figure 1). Thus, hot bands appear as an asymmetry or shoulder on the low frequency side of a peak. Hot bands are more pronounced at low frequencies (easier to populate the v = 1 level) and in elevated temperature situations.
Isotope shifts occur because of the dependence of vibrational frequency on mass. Simply stated, as the mass of an oscillator increases, the frequency goes down (5). For example, the Raman spectrum of the carbon tetrachloride symmetric stretch shows five bands at high resolution, because of 12C35Cl4, 12C35Cl337Cl, 12C35Cl237Cl2, 12C35Cl37Cl3, and 12C37Cl4 shifting in that order to lower frequencies (mass increases), and with peak heights proportional to the relative isotopic concentrations of each. These peaks are closely spaced, because the change in reduced mass is small; at low resolution, this effect makes the peak look distorted; at high resolution, individual peaks appear. The similar isotope shift seen in HCl vapor is a standard physical chemistry experiment, where isotopes of both hydrogen and chlorine cause peak shifts.
Molecules on the Move
Intermolecular interactions strongly affect lineshapes in liquids. Dipolar forces and hydrogen bonding are two crucial players in this. We examine the acetone–water binary mixture system as an illustration. In pure acetone, the carbonyl groups on adjacent molecules align weakly because of their dipoles. The high vapor pressure (easy evaporation) of acetone results as the molecules don’t hold together tightly. As water is added, hydrogen bonding between water and the carbonyl oxygen takes over as a stronger force, and the environment of the acetone molecules changes rapidly. Hydrogen bonding also acts like a discharge path for the vibrational energy, causing the carbonyl vibration to relax rapidly (6).
The spectra shown here were collected using a Thermo Scientific Nicolet iS50 Fourier transform infrared (FT-IR) spectrometer and its built-in attenuated total reflectance (ATR) capability with diamond crystal. The Peak Resolve algorithm of the Thermo Scientific OMNIC software was used for the curve fitting.
The carbonyl peak around 1700 cm-1 and the lower frequency C-H bands show a variety of differing responses to the increasing water concentration. Figure 4 (carbonyl) and Figure 5 (CH) show this clearly.
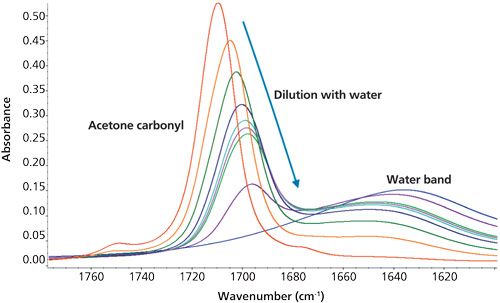
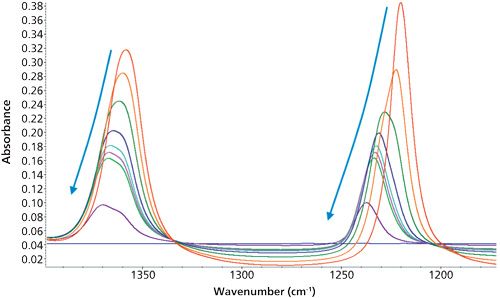
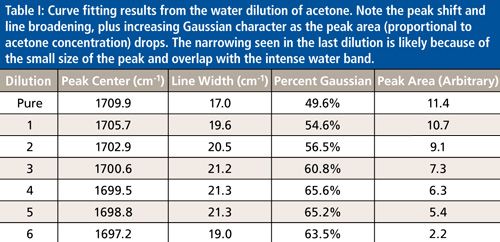
The carbonyl peak shifts to lower frequency (red shifts) as hydrogen bonding lowers the vibrational energy. The band also broadens because of the rapid energy relaxation caused by the hydrogen bonds (shorter lifetime = broader peak). The peak height changes both because of the dilution factor and the changing bandwidth that spreads the signal over a wider range. At the same time, the peak assumes an increasingly Gaussian shape. The results of fitting the spectra with a Gaussian–Lorentzian combination band are shown in Table I. The band is still just the carbonyl mode, but any spectral interpretation must recognize these complex changes.
Interestingly, the -CH3 modes are affected differently. The methyl groups don’t like being pushed closer together so the tighter association caused by hydrogen bonding shifts their vibration to higher frequency (blue shift). The band still broadens because of collisionally induced relaxation (shorter lifetime again). However, there is even more going on here.
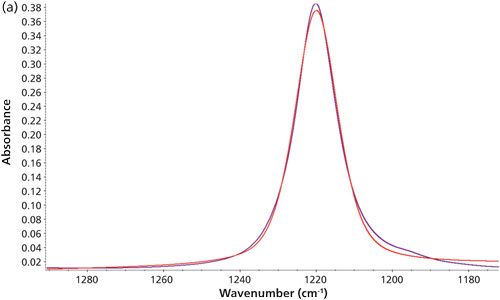
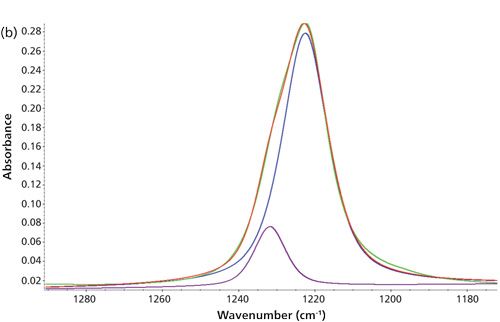
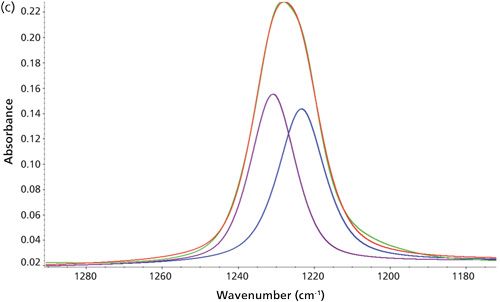
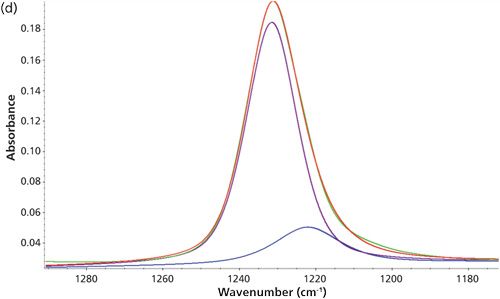
Close examination of both C-H bands reveals the appearance of a new peak. Initially, a single peak is required to fit the pure acetone band. We fixed the location of this peak (±1.5 cm-1) and then added a second peak to the fitting routine. This second peak was also found to be stable in location (also ±1.5 cm-1) even when left free to change. The resulting fits are shown in Figure 6. This combination of two bands easily fits the profile. The apparent peak shift is caused by the changing relative importance of two acetone environments. The band at 1219–1222 cm-1 is due to self-associated acetone, while the 1230–1233 cm-1 band is likely because of an acetone–water complex. There is no water band in this region and the highly dilute acetone shows that the initial band is largely gone. These observations support the idea that two different domains exist within the liquid. The first, corresponding to the acetone–acetone interactions of the pure liquid, drops quickly while the second-associated with a water–acetone complex-becomes increasingly pronounced (though decreasing in intensity because of dilution).
Conclusion
While the description here has focused on visible changes to the spectra, such changes in mixtures can easily impact a calibration. Temperature also changes lineshapes because of changes in associative or repulsive interactions. The peak height does not change linearly, but shows impacts of peak shifting, broadening, and splitting. Building a calibration based on peak height alone could lead to errors. The peak area is responding linearly, as the total area under the curve relates to the concentration-there is no water band growing in the same region-so area calibrations would be more stable.
Lineshapes of materials respond to intermolecular interactions. These effects cause bands to shift, narrow or broaden and even change their fundamental shape. Strange humps and shoulders or unexpected doublets can appear because of isotopes or changing associations. At a qualitative level, this can influence peak assignments and peak tables. Furthermore, these changes can affect quantitative calibrations if improperly used. Understanding lineshapes, even in a cursory manner, will assist in the assignment and analysis of IR and Raman bands.
References
(1) G. Herzberg, Molecular Spectra and Molecular Structure Vol. II: Infrared and Raman Spectra of Polyatomic Molecules (Von Nostrand, New Jersey, 1945).
(2) M. Diem, Introduction to Modern Vibrational Spectroscopy (New York, John Wiley and Sons, 1993), Chapter 2.
(3) W.G. Rothschild, Dynamics of Molecular Liquids (New York, John Wiley and Sons, 1984), Chapter 4.
(4) P. Pelikán, M. Ceppan, and M. Liška, Applications of Numerical Methods in Molecular Spectroscopy (Boca Raton, CRC Press, 1993), Chapter 2.
(5) C.W. Garland, J.W. Nibler, and D.P. Shoemaker, Experiments in Physical Chemistry, 7th Edition (New York, McGraw-Hill, 2003), Chapter XIV.
(6) M. Bradley and J. Krech, J. Phys. Chem.97(3), 575–580 (1993).
Mike Bradley is the marketing manager for FT-IR and FT-IR microscopes at Thermo Fisher Scientific in Madison, Wisconsin. Direct correspondence to: Mike.bradley@thermofisher.com
AI Shakes Up Spectroscopy as New Tools Reveal the Secret Life of Molecules
April 14th 2025A leading-edge review led by researchers at Oak Ridge National Laboratory and MIT explores how artificial intelligence is revolutionizing the study of molecular vibrations and phonon dynamics. From infrared and Raman spectroscopy to neutron and X-ray scattering, AI is transforming how scientists interpret vibrational spectra and predict material behaviors.
Real-Time Battery Health Tracking Using Fiber-Optic Sensors
April 9th 2025A new study by researchers from Palo Alto Research Center (PARC, a Xerox Company) and LG Chem Power presents a novel method for real-time battery monitoring using embedded fiber-optic sensors. This approach enhances state-of-charge (SOC) and state-of-health (SOH) estimations, potentially improving the efficiency and lifespan of lithium-ion batteries in electric vehicles (xEVs).
New Study Provides Insights into Chiral Smectic Phases
March 31st 2025Researchers from the Institute of Nuclear Physics Polish Academy of Sciences have unveiled new insights into the molecular arrangement of the 7HH6 compound’s smectic phases using X-ray diffraction (XRD) and infrared (IR) spectroscopy.
