MidIR Testing Reveals Supply Chain Mismanagement
This article shows the benefits and ease with which mid-infrared testing can reveal supply change mismanagement events and help to quickly identify and correct mishaps.
The Underwriters Laboratory (UL) standard requires companies that manufacture AC power distribution equipment to affix a permanent label to their products, which conveys a wide range of information regarding product installation and safe use throughout its lifetime. Essential product information is disclosed, including electrical rating, precautions, compatibility with electrical systems, warning messages, and environmental ratings. A registry number from a Nationally Recognized Testing Laboratory (NRTL) is also included to ensure the traceability of the electronic device.Intertek performs certification of devices for this manufacturer and carries the ETL (Electrical Testing Laboratories) label, indicating that the device meets the UL specification.
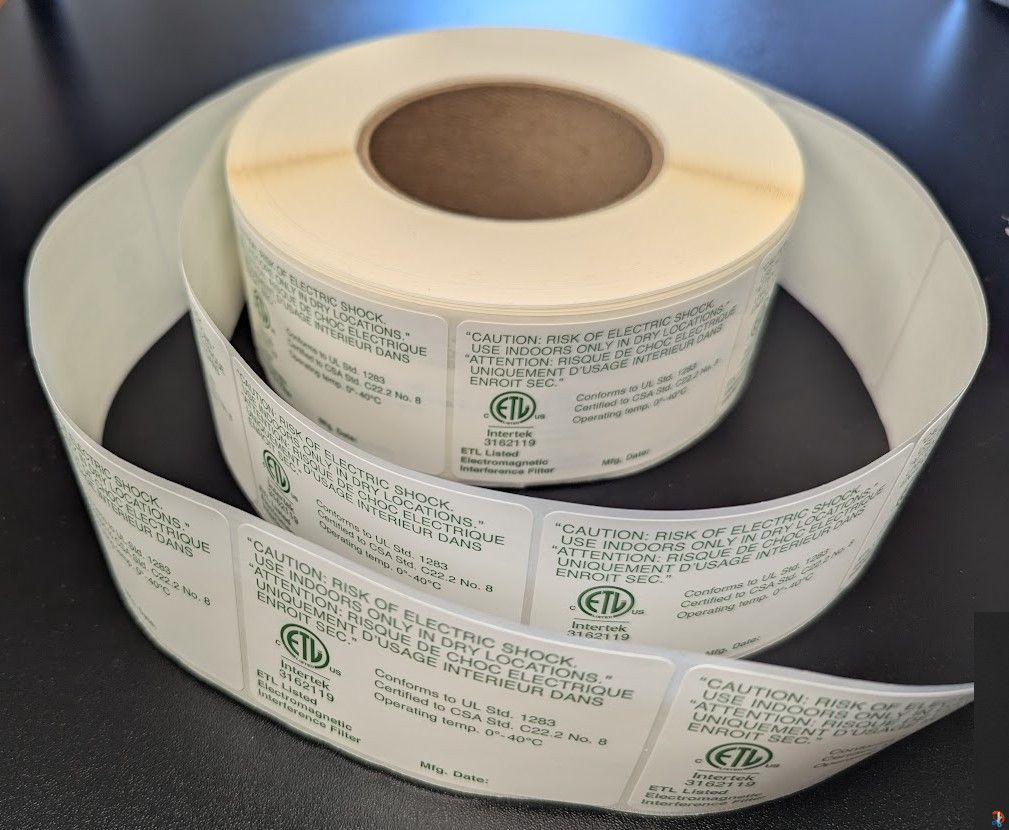
Electrical device original equipment manufacturers (OEMs) often subcontract label printing and specify what information is written on the label as well as the label’s UL permanency requirements (see Photo 1).


Photo 1: Example of printed labels required for electrical devices.
The UL 969 is a critical standard cited for adhesive-backed labels used for permanent product identification. This UL standard covers adhesive-attached labels and in-mold labels used as permanent nameplates or markers providing product information and instructions (1). The standard outlines specific criteria regarding the permanence and legibility of the labels as well as the test procedures required to determine compliance. For example, UL 969 specifies that the label must meet a specific flammability rating and comply with certain other environmental conditions.
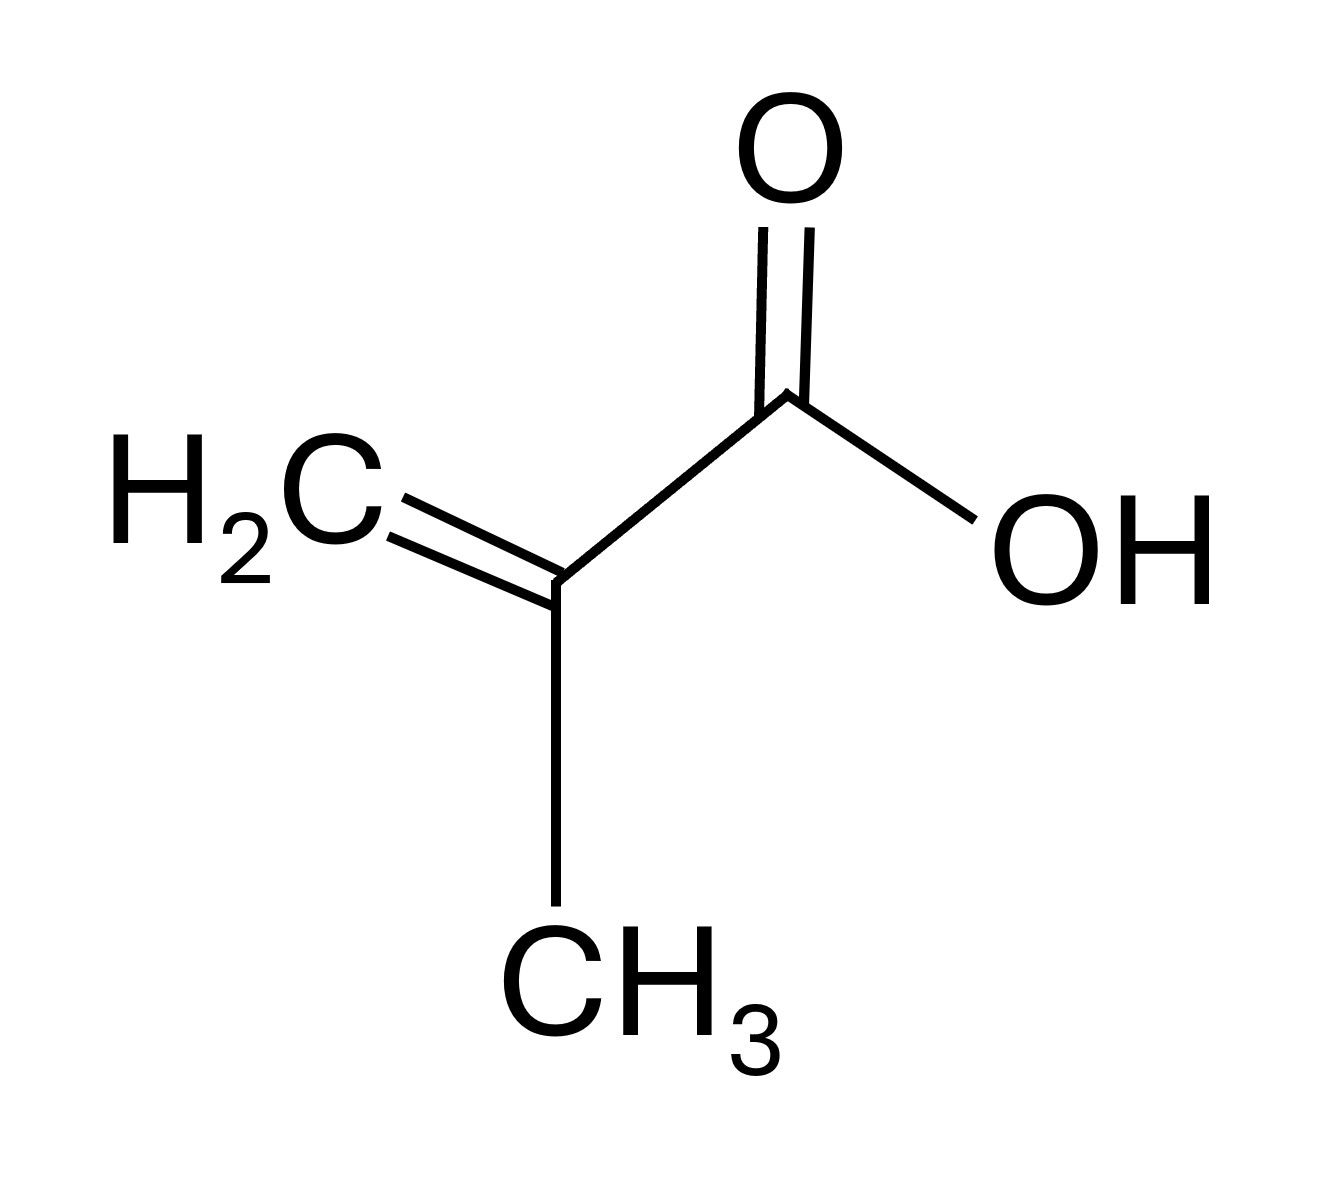
Acrylic acid and its esters, known as acrylates, are used as ingredients in various products, including paints, coatings, textiles, adhesives, and plastics. Acrylic emulsion polymers are readily formulated into overprint varnishes and inks to impart water resistance, rub resistance, alkaline resistance, and high gloss (3). They can also be incorporated into paper and paperboard product barrier coatings, improving oil, grease, and water resistance.The most essential components of acrylic adhesives are the starting monomer, the initiator or catalyst, and the functional additives such as tougheners (3,4). Several types of monomers are used depending on the source, including methyl methacrylate, ethyl methacrylate, 2-ethylhexyl methacrylate, cyclohexyl methacrylate, and ethyl acrylate (3). Figure 1 illustrates the chemical structure of methacrylic acid, a standard monomer employed in synthesizing acrylic adhesives.


Figure 1: Chemical structure of methacrylic acid, a commonly used acryic polymer starting material.
Before 1974, label adhesives were modified with crosslinked acrylic monomers reinforced with elastomers and reactive polymers to achieve adhesion and durability. However, around 1974, DuPont introduced Cavalon, a second-generation acrylic adhesive that utilized chlorosulfonated polyethylene and related materials as tougheners (3). This provided greater durability and reliability due to the more efficient transfer of stress to the rubbery phase. A nitrogen-containing aromatic initiator initiates the polymerization process (3, 4). Modifiers, such as tackifiers and plasticizers, can be added to enhance adhesion properties or achieve better low-surface-energy adhesion.These minor differences in chemical additives and processes may result in labels with slightly different chemical compositions and lifetime performance.
OEM manufacturers of UL-approved electronic equipment will reference UL 969 requirements when subcontracting label printing. Labels sold that meet the UL969 requirements are considered suitable and reduce in-house testing and supply chain complexity.However, it is the responsibility of the label printing company to ensure the label materials meet UL 969 specification requirements and that the appropriate testing is performed regularly to demonstrate this level of quality. Nonetheless, fraudulent labels may occasionally be supplied, with fact sheets containing misleading or incorrect UL approval status. For electronic manufacturers who rely on their suppliers to adhere to the UL specifications, it is challenging to catch fraudulent labels based on visual inspection and chemical fact sheet information to identify labels that don’t meet the UL approval rating.
Analytical tools such as mid-infrared spectroscopy can objectively evaluate the adhesive chemistry to determine consistency with prior lots.Mid-infrared measures the absorbance of infrared light by the sample in the range from 4000 to 450 cm-1.When the molecule absorbs light it will vibrate at specific frequencies. These absorbed frequencies are directly related to bonding and molecular functionality, which can be used to determine the sample's composition. The absorption versus frequency plot is known as a spectrum.The spectra of two or more samples can be plotted and compared to industry standards to determine if molecular structure and composition are consistent.Spectral vibrations that are similar contain similar molecules, whereas when peak shifting, differences in peak ratios, or disappearance of bands occur, materials have different chemical compositions.
Mid-infrared is commonly used for molecular structure identification of solids, gases, and liquids. In adhesive manufacturing, this technique measures the quality of incoming raw materials (chemical ingredients) and identifies defects during the polymerization process (6). The instrument is also used to examine the quality of the final product, ensuring consistency and confirming that the products meet the chemical and quality requirements (5-7).
A significant advantage of mid-infrared spectroscopy is that it does not typically require lengthy sample preparation, extraction procedures, or measurement times. A very small sample can be used for the analysis with little preparation. The user simply places the sample material directly onto the ATR (attenuated total reflectance) diamond crystal for analysis.The infrared light beam interacts with the sample through an evanescent wave of electromagnetic radiation.The sample absorbs light at specific frequencies related to its molecular makeup, and the detector measures the transmitted light.For both solids and liquids, the penetration depth of the infrared beam into the sample is on the order of several microns. For solids, pressure is applied to ensure intimate contact between the sample and the ATR crystal.
Acquiring a mid-infrared spectrum of materials is a convenient way for non-chemists to identify when a product's chemical composition changes. This technique is useful when proprietary formulation information is not fully disclosed on material data sheets and quality assurance between lots is required.
Experimental
A PerkinElmer Spectrum Two™ FT-IR equipped with an Attenuated Total Reflectance (ATR) accessory was used in these experiments. The spectral range measured was from 4000 to 450 cm-1, with 1 cm-1 data spacing.A consistent force was applied using a pressure arm to obtain contact between the solid sample and the diamond ATR crystal.
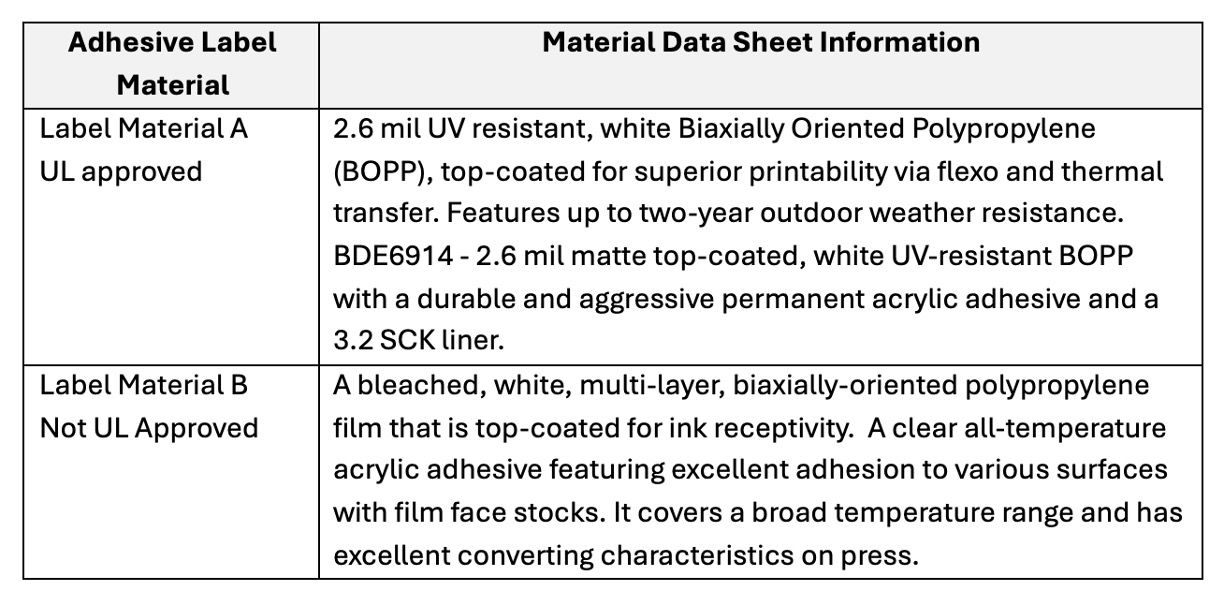
Two different sources of blank labels, “Label Material A” and “Label Material B”, were obtained and used as reference spectra for the adhesive layer. The adhesive used in Label Material A is UL-approved, while the adhesive in Label Material B is not.The material information data sheets provided by the manufacturer of the Labels are found in Table I.Little information about the chemical composition or differences in the adhesives used is disclosed.


Table I. Material data sheet from two sources of acrylic adhesive labels used as reference spectra


The reference spectra were recorded by placing a 3/4 inch sample of the label, adhesive side down, onto the diamond ATR crystal.The adhesive side of the label is shown in Photo 2.
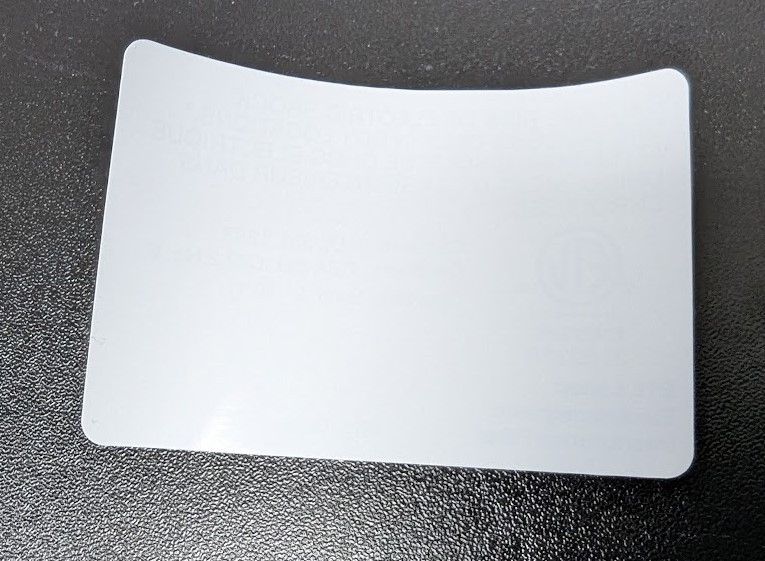
Photo 2: Backside of label with adhesive layer.
The spectra of nine printed labels were measured similarly.Labels from three printing lots were provided by ZeroSurge, Inc.Samples 11-1, 11-2, and 11-3, printed in 2024, and samples 13-1, 13-2, and 13-3, printed before 2018 were from Printing Supplier A; and samples 14-1,14-2, 14-3, printed in 2025 were from Printing Supplier B.
Results and Discussion
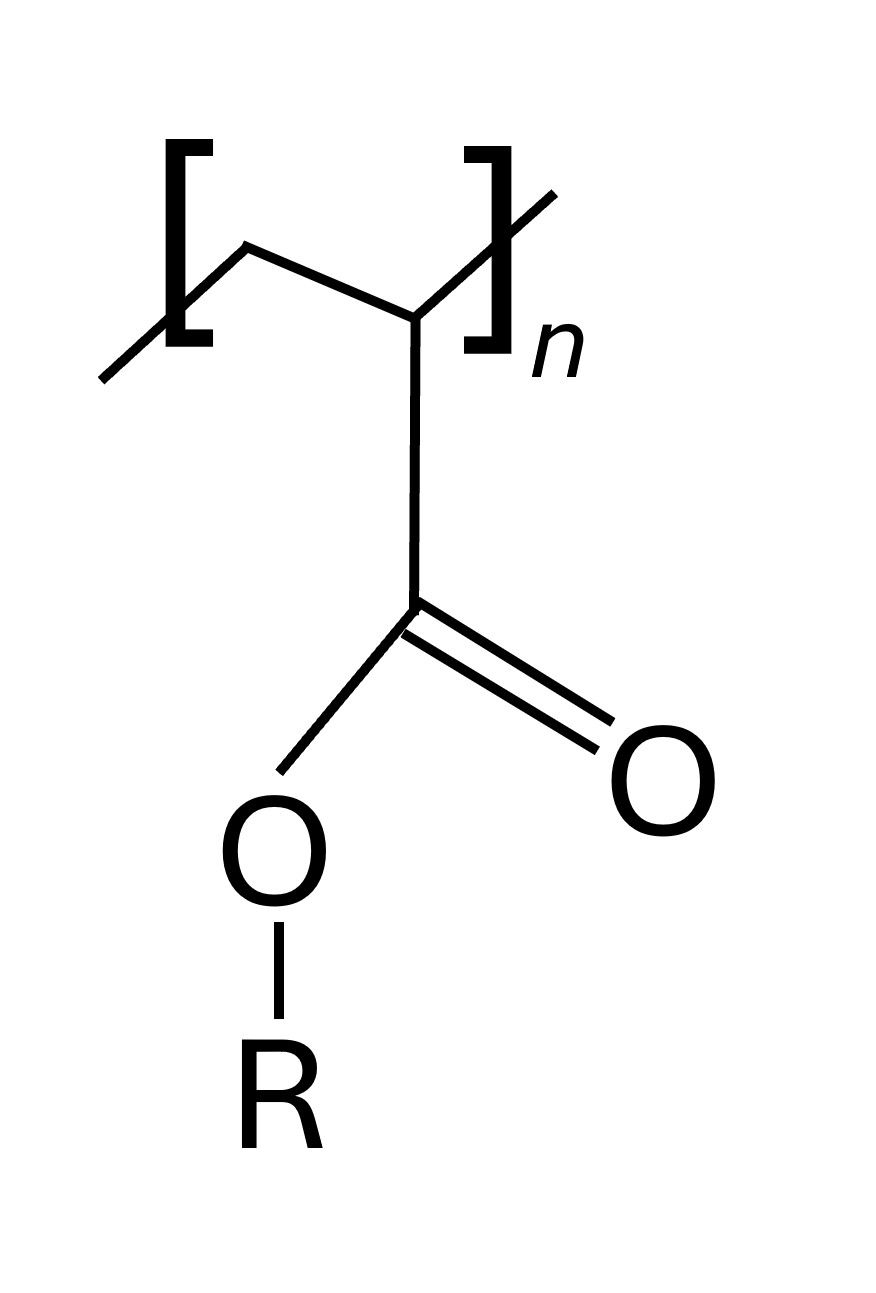
The molecular composition of adhesive labels manufactured by companies is generally a proprietary formulation. In general, acrylic adhesive molecules are polymers prepared from acrylate monomers. These plastics are known for their transparency, resistance to breakage, and elasticity. Poly (methyl methacrylate) or PMMA is a widely used acrylic polymer.Acrylic acid is often used to increase cohesion and the glass transition temperature (Tg) and is a functional monomer for chemical cross-linking (3). Figure 2 shows the general structure of an acrylic polymer.These are esters formed from the polymerization of acrylic acid and other additives to generate a long-chain polymer with specialty properties. The R group depends on the proprietary ingredients used during the polymerization reaction.


Figure 2.Generalized chemical structure of an acrylic polymer.
Mid-infrared analysis is well documented to determine the chemical structure of acrylic polymers and to monitor chemical changes during the polymerization process (2,5-8).Figure 3 contains the mid-infrared absorption spectra of the two reference standards.At first glance, the spectral fingerprint looks similar. However, a more detailed inspection reveals several significant differences between the two spectra when looking at the aliphatic (~3000 to 2800 cm-1) and fingerprint (~1500 to 500 cm-1) regions.These differences suggest chemical differences exist between the two acrylic polymer adhesives used for label manufacture.For example, in the aliphatic region, there is a slight difference in band position for the CH2 asymmetric stretch position in the adhesive used in Label Material B and the appearance of a CH2 symmetric stretching band near 2860 cm-1, likely due to a different type of chemical moiety used in the R group attached to the acrylic ester.

, and Blue is Label Material B.")
Figure 3. Aliphatic and fingerprint regions of Adhesive Reference Standards. Red is Label Material A (UL-approved), and Blue is Label Material B.
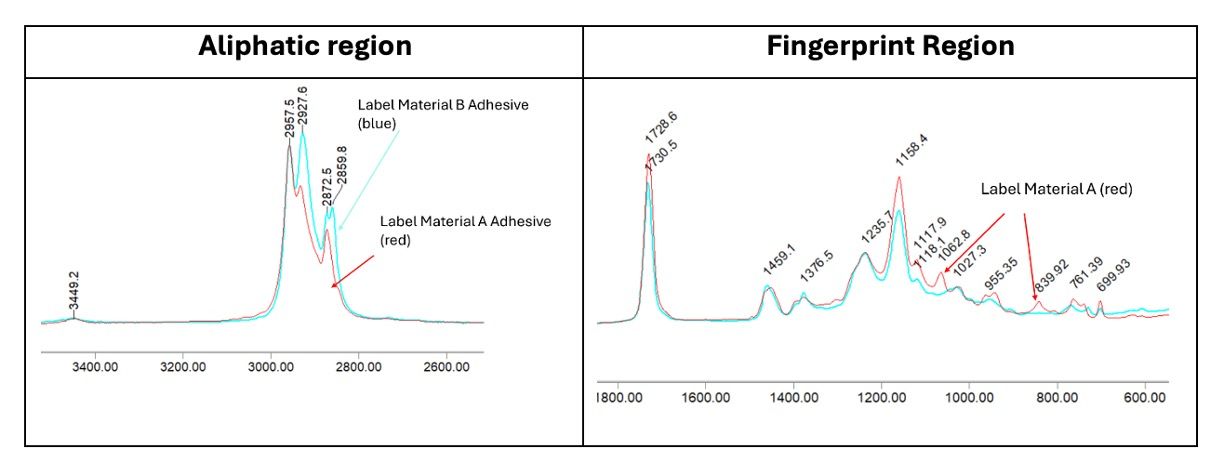
In the functional group region, the peak position of the ester carbonyl stretch differs slightly, representing slight differences in the dipole moment and anharmonicity of the molecule. The C=C absorption peak at 1636 cm-1 was absent in both spectra, indicating that all acrylic monomers containing C=C bonds (double bonds) had reacted entirely to develop a cross-linking structure (9).
Table II summarizes the differences in spectral absorbance bands for the two sources of adhesive labels.The adhesive used in Label Material B has a unique band at 2859.8 cm-1, whereas Label Material A has unique bands at 1303.7 cm-1, 1062.8 cm-1, and 839.9 cm-1.These differences are likely due to variations in the chemical ingredients used in the polymerization process, such as monomers or functional additives. There are also differences in CH2 splitting of the rocking frequencies between 760 and 730 cm-1 (8).


Table II. Functional group assignments for Label Adhesive References. Unique bands are highlighted in yellow.
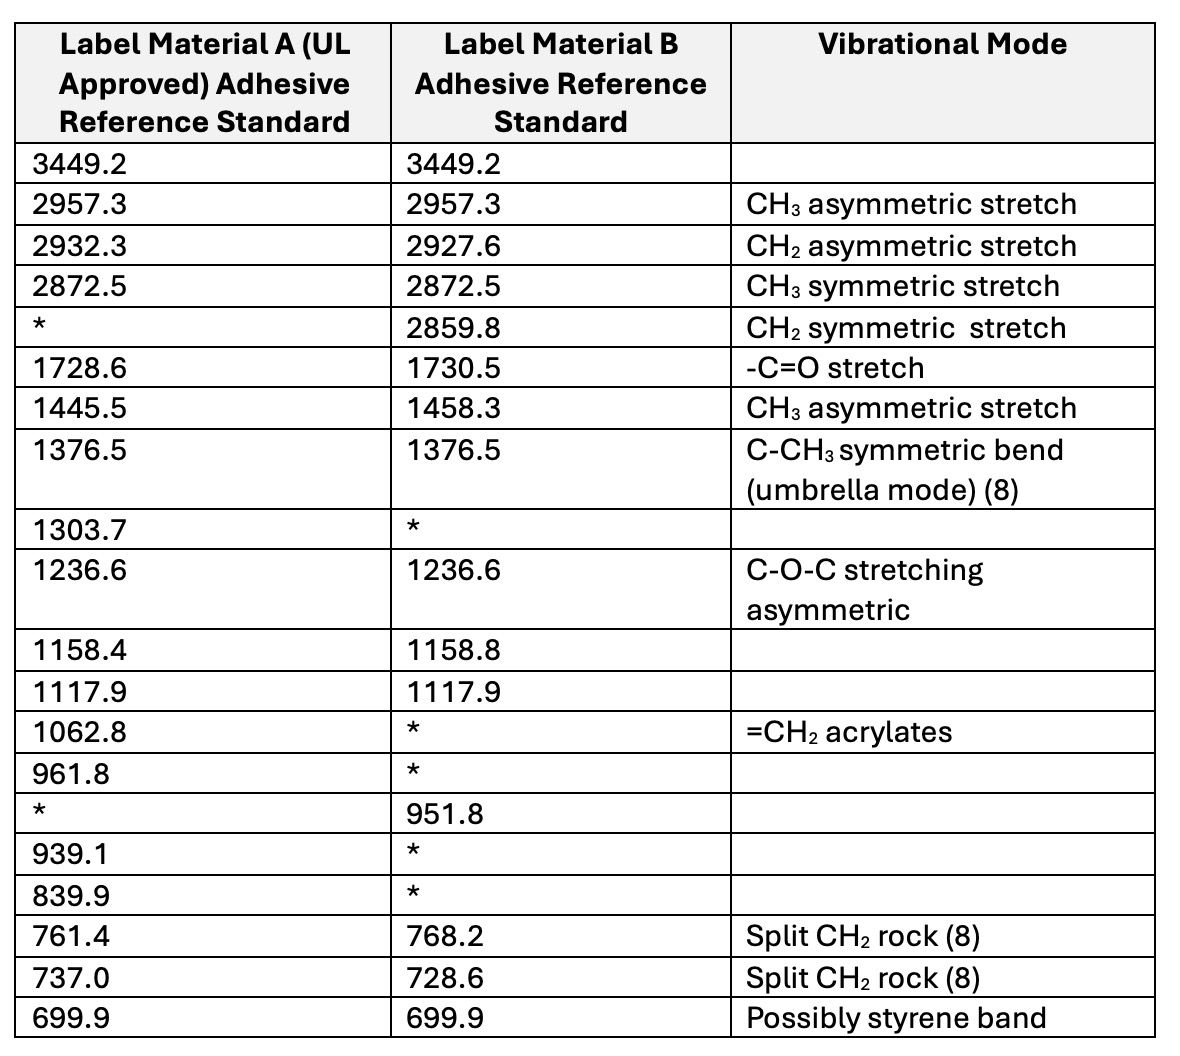
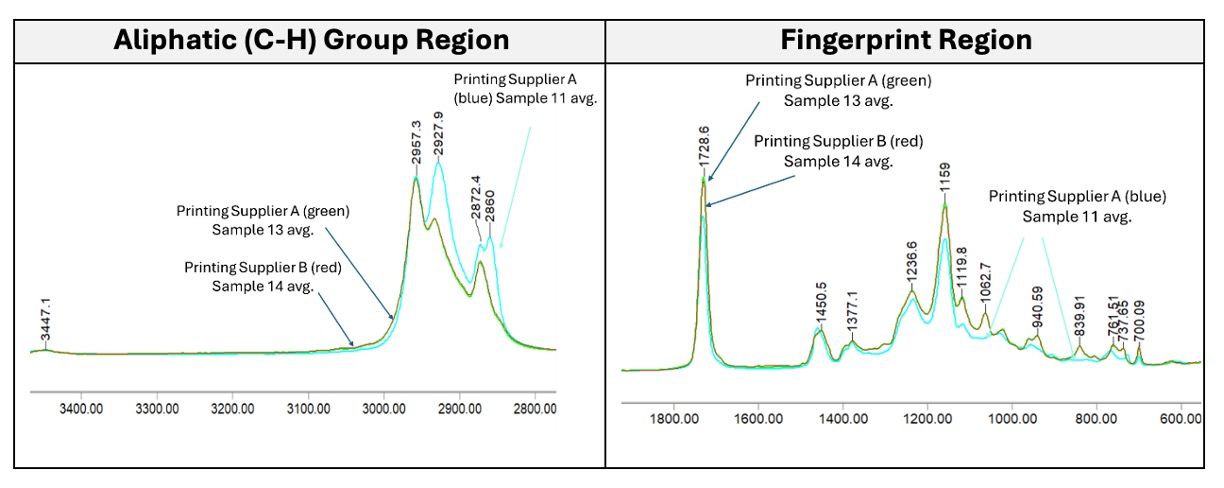
Figure 4 compares the printed labels from the two different printing suppliers.The spectral fingerprint of the labels printed by Printing Supplier A in 2024 (average of samples 11-1,11-2,11-3) clearly shows that the adhesive layer has an infrared spectrum similar to the adhesive used in Label Material B (non-UL approved).An additional band is observed at 2860 cm-1, identical to the adhesive layer in Label Material B, and missing bands at 1062.8 cm-1 and 839.9 cm-1, which are characteristic of the adhesive used in Label Material A.On the contrary, the average spectrum in green is the adhesive layer in labels 13-1,13-2, and 13-3 from Printing Supplier A sold before 2018, which is similar to the UL-approved reference adhesive spectrum, suggesting that a change in sourcing labels had occurred.
Figure 4 also shows labels from Printer Supplier B, purchased in 2025. The average spectrum of the adhesive layer of the three labels (14-1,14-2,14-3) is shown in red. The mid-infrared spectrum is identical to the average spectrum of Sample 13, and nearly identical in fingerprint to the adhesive used in the UL-approved Label Material A reference spectrum.

. Green and red are nearly identical. The green spectrum is the average of samples 13-1, 13-2, and 13-2 (Printing Supplier A, before 2018), and the red spectrum is the average of 14-1, 14-2, and 14-3 (Printing Supplier B, 2025).")
Figure 4. Mid-infrared spectra of three lots of printed labels from two printing suppliers. The average of three samples from each lot is shown. The blue spectrum is the average of samples 11-1, 11-2, and 11-3 (Printing Supplier A, 2024). Green and red are nearly identical. The green spectrum is the average of samples 13-1, 13-2, and 13-2 (Printing Supplier A, before 2018), and the red spectrum is the average of 14-1, 14-2, and 14-3 (Printing Supplier B, 2025).
Conclusion
Labels are critical components that provide users with the installation and safe use of electronic products.UL 969 is the most globally recognized and established label performance standard. OEMs need to be aware of the potential for label printing vendors to claim materials are UL-approved when they are not.A potential safeguard is to characterize the adhesive materials used regularly and to establish standards for periodic testing, ensuring that changes in material composition that may affect lifetime adhesivity and performance do not occur.
Mid-infrared spectroscopy provides a rapid and efficient method for verifying the chemical composition of materials, thereby ensuring compliance and mitigating issues related to supply chain mismanagement.
References
(1) Underwriters Laboratory, LLC (2016).COMPLIANCE GUIDELINES FOR MARKING AND LABELING SYSTEMS. Compliance-Guidelines-for-Marking-and-Labeling-Systems_WP.pdf (accessed 2025-04-16).
(2) Zięba-Palus, J. (2017) The usefulness of infrared spectroscopy in examinations of adhesive tapes for forensic purposes. Forensic Science and Criminology 2(2).
(3) Petrie, E.M. SpecChem (2023 )Structural Thermosetting Acrylic Adhesives – Basic and Formulation Practices Structural Thermosetting Acrylic Adhesives - Basics & Formulation Practices (accessed 2025-04-16).
(4) Aronovich, D.A. and Boinovich, L. B. (2021)Structural Acrylic Adhesives: A Critical ReviewRev. Adhesion Adhesives, Vol. 9, No. 1. Scrivener Publishing LLC
(5) Boehm, N. (2012 ) Quantitative Comonomer Analysis of Polyacrylates via IR Spectroscopy.https://www.adhesivesmag.com/articles/91312-quantitative-comonomer-analysis-of-polyacrylates-via-ir-spectroscopy# (accessed 2025-04-16).
(6) Bruker Optics. (2023) Analyzing Glues for Quality Control with FT-IR. AZoM. Retrieved on March 20, 2025, from https://www.azom.com/article.aspx?ArticleID=15231 (accessed 2025-04-16).
(7) Hirsh, C. (2022). The Use of FT-IR Analysis in Adhesive Manufacturing. The Use of FT-IR Analysis in Adhesive Manufacturing (accessed 2025-04-16).
(8) Smith, B. C. The Infrared Spectra of Polymers II: Polyethylene. Spectroscopy 2021, 36 (9), 24–29. DOI: https://doi.org/10.56530/spectroscopy.xp7081p7
(9) Kim, H.J., Czech, Z., Bartkowiak, Gyu-Seong Shim, Janina Kabatc,M.,Licbarski, A. (2022).Study of UV-initiated polymerization and UV crosslinking of acrylic monomers mixture for the production of solvent-free pressure-sensitive adhesive films, Polymer Testing, Volume 105,107424.


Introduction to Satellite and Aerial Spectral Imaging Systems
April 28th 2025Modern remote sensing technologies have evolved from coarse-resolution multispectral sensors like MODIS and MERIS to high-resolution, multi-band systems such as Sentinel-2 MSI, Landsat OLI, and UAV-mounted spectrometers. These advancements provide greater spectral and spatial detail, enabling precise monitoring of environmental, agricultural, and land-use dynamics.


