Monitoring Chemical Changes by Raman Spectroscopy
By now, it is well known that Raman spectroscopy provides information on the chemical composition of materials, and that said information can be made available in real time–that is, during a reaction. While many types of reactions can be monitored, one of the most important types is polymerization. Polymerization reactions typically involve the loss of a carbon double bond as the chain length is increased, and because the signals from π electrons are strong, the ability to follow this reaction until the end is quite good. However, setting up a polymerization experiment for demonstration purposes can be hazardous. Here, we will show the chemical and spectral changes that occur during the cure of a commercial epoxy.
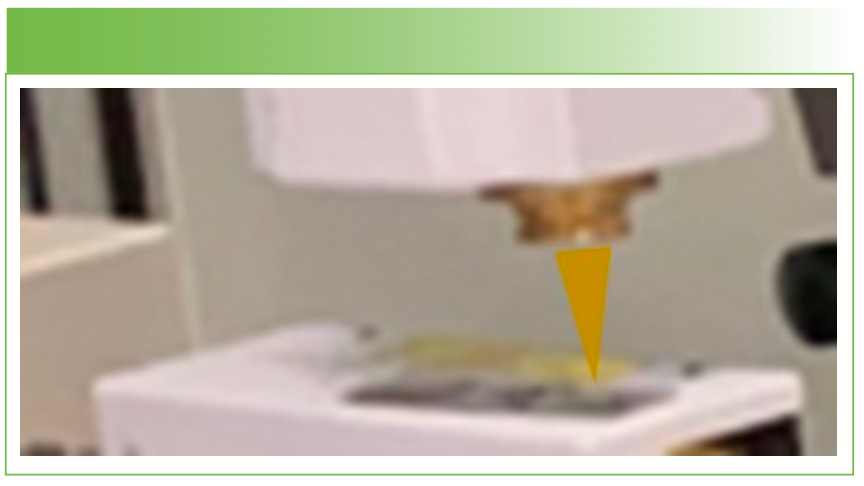
An epoxy is a three-membered ring containing two carbon atoms and one oxygen atom (see Figure 1). The ring has a characteristic Raman band near 1275 cm-1 which can be followed as the epoxy is cured. Different epoxy formulations have different R groups selected for the desired properties. The epoxy that we studied here is a fast-curing Gorilla brand epoxy. Because it is a fast-cure, we wanted to start measurements after mixing as rapidly as possible. The product, which comes in a two-chamber syringe, was used according to the manufacturer’s instructions; we deposited the two components on a stainless steel slide, after which they were thoroughly mixed and moved to the site for Raman measurements. Figure 2 shows how the measurements were done with a probe remote from the MacroRAM benchtop Raman spectrometer. By analogy, it is clear that polymerization measurements can be done in a polymerization reactor by selecting the most effective type of probe (immersion or through-a-window) to monitor the reaction. Figure 3 shows a close up of the laser light focusing on the epoxy on the stainless steel slide. The excitation used for these measurements was the 785-nm diode laser.


FIGURE 1: Molecular configuration of the epoxy ring.
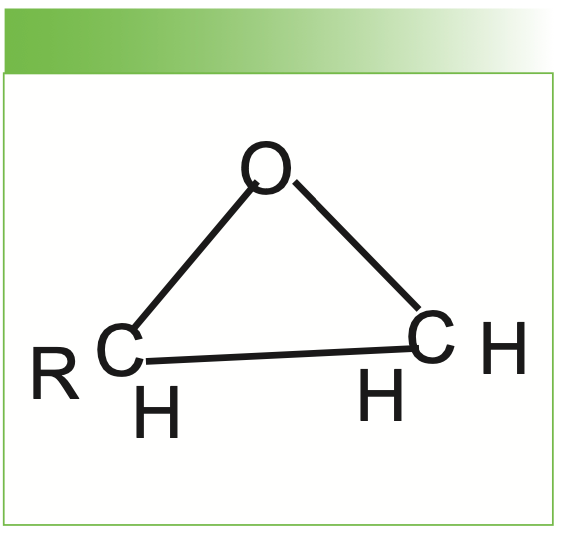


FIGURE 2: The scheme under which the measurements of the epoxy cure were made. The instrument and computer are on one side of the room and the Raman probe is mounted on the other with the fiber optic cables crossing the room. The sample position at the focal point of the Raman probe is noted by the red ellipse on the left.
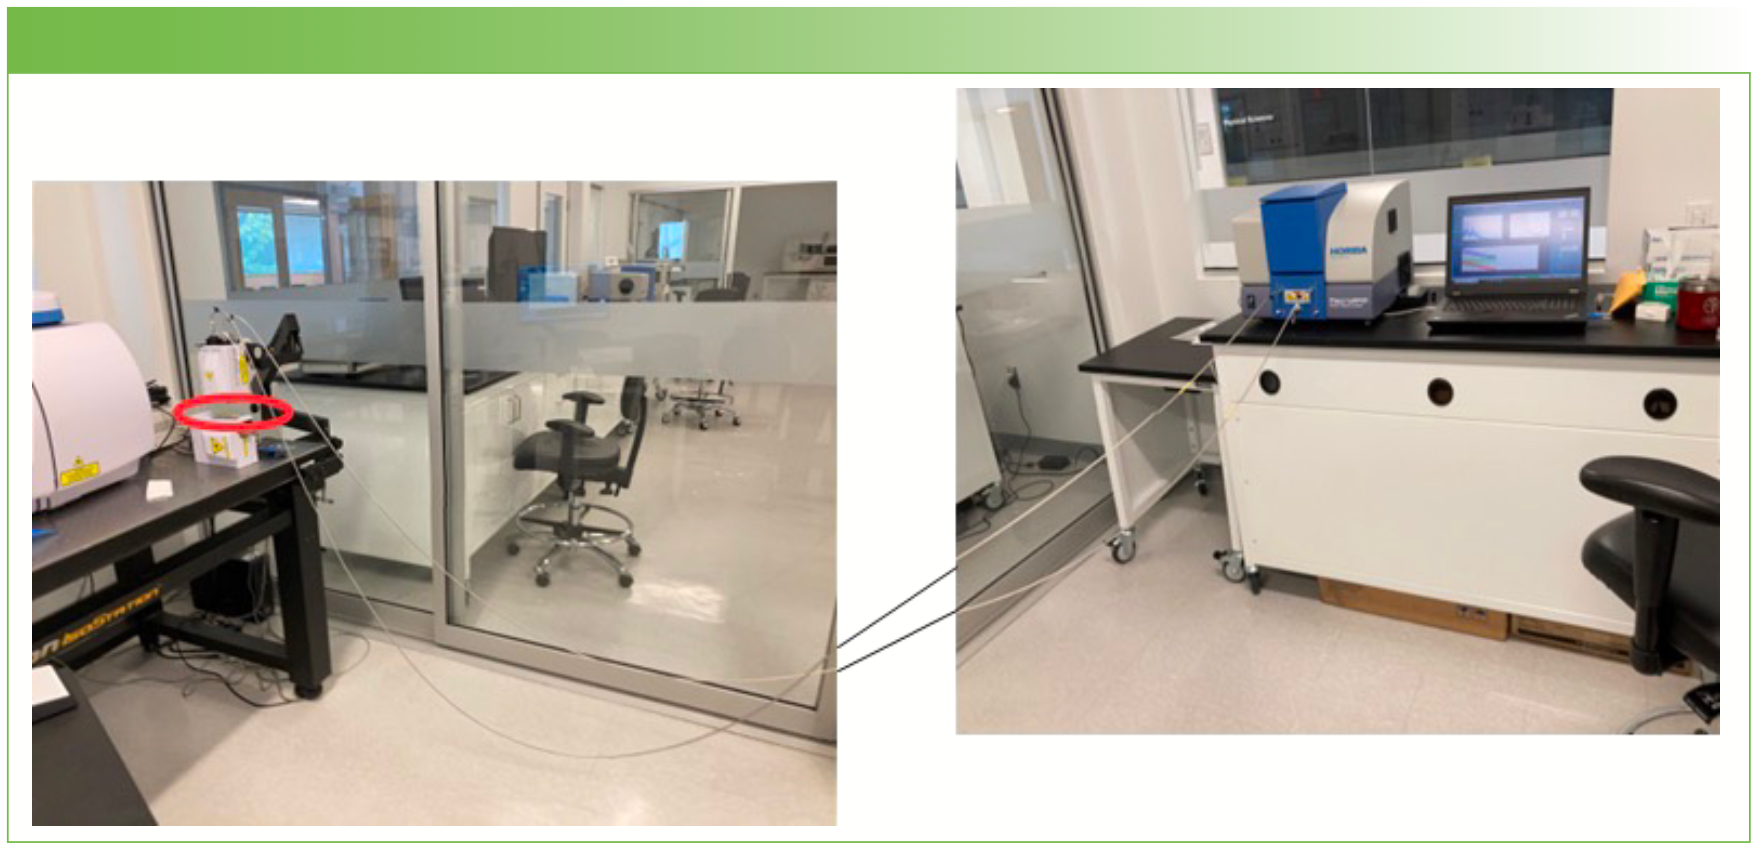


FIGURE 3: Close-up view of the laser focused on the epoxy sample.
Results
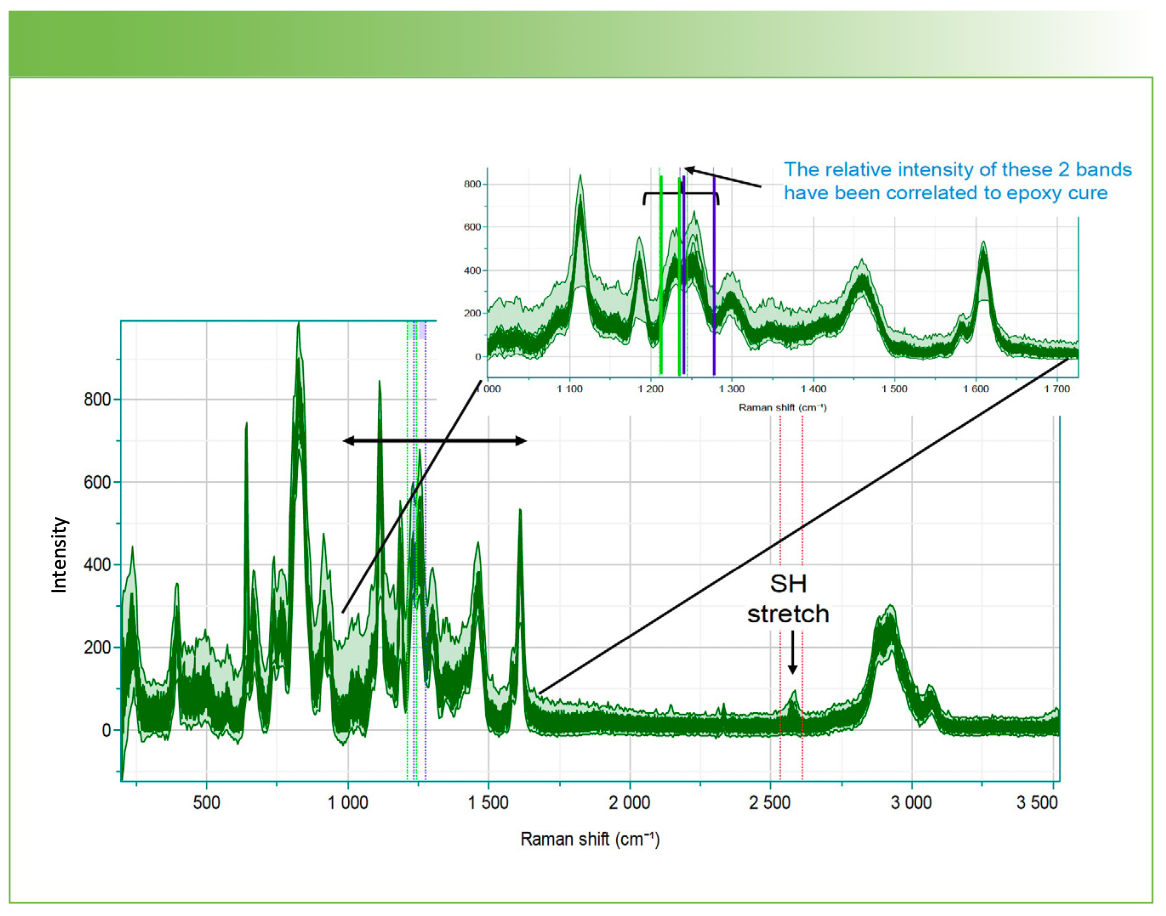
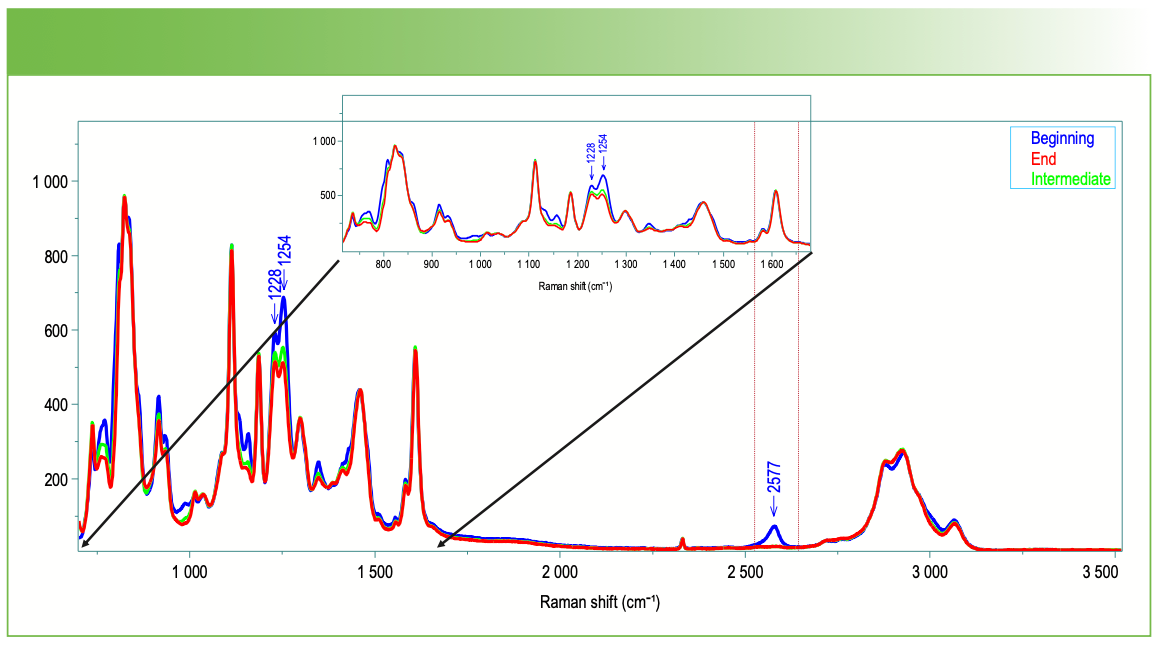
The system was set up to make measurements over a 4-h period in order to capture changes occurring over a longer period than the rapid cure. The entire spectral data set is shown in Figure 4. While the relative intensity between 1200 and 1300 cm-1 were of interest to monitor the epoxy ring opening (1), the spectra also show clear evidence for an aromatic ring (doublet near 1600 cm-1 and aromatic CH stretch near 3060 cm-1), as well as an SH stretch above 2500 cm-1.


FIGURE 4: Spectra acquired over a 4-h period of the fast-curing Gorilla brand epoxy.
We chose to use classical least squares (CLS) to analyze this data set. Figure 5 shows a spectrum from the beginning of the acquisition in blue, from the intermediate phase in green, and from the end in red. The changes that we will focus on are the changes in relative intensity between 1200 and 1300 cm-1 and the loss of the band above 2500 cm-1. Using these two spectra, the software can calculate and plot the scores for each spectrum as a function of time, as illustrated in Figure 6.

, intermediate (green), and last (red) spectra from epoxy cure. These spectra are used to construct the scores plots seen in Figure 6. Note the spectral regions where the intensity is decreasing from blue to green to red.")
FIGURE 5: First (blue), intermediate (green), and last (red) spectra from epoxy cure. These spectra are used to construct the scores plots seen in Figure 6. Note the spectral regions where the intensity is decreasing from blue to green to red.

 Scores plot over the 4 hours of the epoxy cure. (b) Note that while the most rapid changes are occurring during the first 400 s, slow changes continue over the 4 hours. The -SH group disappears within the first 500 s while the epoxy group changes continue slowly over the 4 hours.")
FIGURE 6: (a) Scores plot over the 4 hours of the epoxy cure. (b) Note that while the most rapid changes are occurring during the first 400 s, slow changes continue over the 4 hours. The -SH group disappears within the first 500 s while the epoxy group changes continue slowly over the 4 hours.
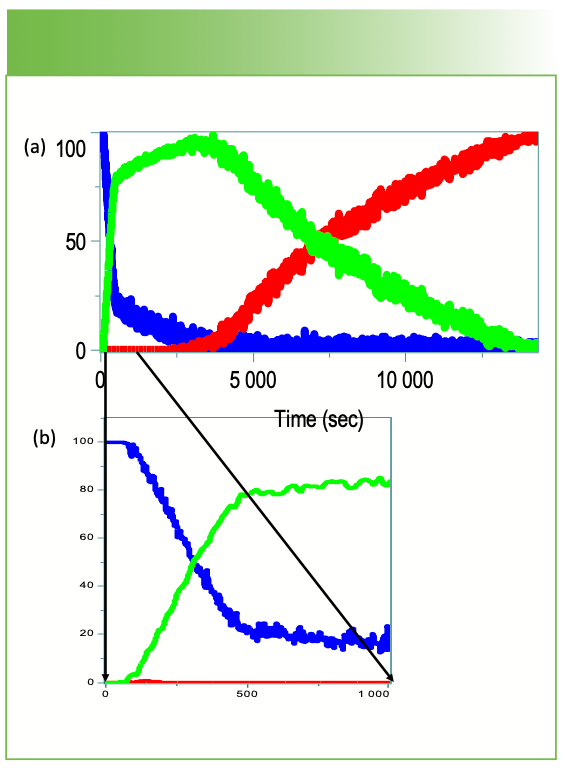
Measurements were made of the starting materials before cure (not shown) and confirmed that there is an -SH group in one of the components before the reaction. Not only is the -SH group disappearing during the initial 400 s, but the ring opening continues to progress. The aromatic bands relative to the CH2 and CH3 stretches 2700 to 3000 cm-1 and deformations 1400-1460 cm-1 do not change much, which means that the aromatic groups are not participating in the cure, and are probably added for other reasons. Note also that there is no intense sharp band near 1000 cm-1, which would indicate a singly substituted or (1,2 or 1,3) substituted ring. This means that the aromatic is probably a 1,4 substituted ring.
Summary
This simple set of measurements demonstrates how easy it is to follow a chemical reaction using a remote Raman probe and a simple spectrograph. In this case, it is clear that a sulfhydryl group seen in early spectra is a critical component for the rapid phase of the reaction, consistent with the known properties of -SH groups to enable crosslinking.
References
(1) Merad, L.; et al. In-situ Monitoring of the Curing of Epoxy Resins by Raman Spectroscopy. Polym. Test. 2009, 28, 42–45. DOI: 10.1016/j.polymertesting.2008.10.006


Fran Adar is the Principal Raman Applications Scientist for Horiba Scientific in Edison, New Jersey. Direct correspondence to: SpectroscopyEdit@mmhgroup.com. ●


AI-Powered SERS Spectroscopy Breakthrough Boosts Safety of Medicinal Food Products
April 16th 2025A new deep learning-enhanced spectroscopic platform—SERSome—developed by researchers in China and Finland, identifies medicinal and edible homologs (MEHs) with 98% accuracy. This innovation could revolutionize safety and quality control in the growing MEH market.


New Raman Spectroscopy Method Enhances Real-Time Monitoring Across Fermentation Processes
April 15th 2025Researchers at Delft University of Technology have developed a novel method using single compound spectra to enhance the transferability and accuracy of Raman spectroscopy models for real-time fermentation monitoring.

Nanometer-Scale Studies Using Tip Enhanced Raman Spectroscopy
February 8th 2013Volker Deckert, the winner of the 2013 Charles Mann Award, is advancing the use of tip enhanced Raman spectroscopy (TERS) to push the lateral resolution of vibrational spectroscopy well below the Abbe limit, to achieve single-molecule sensitivity. Because the tip can be moved with sub-nanometer precision, structural information with unmatched spatial resolution can be achieved without the need of specific labels.


