NIR Model Transfer Based on Wavelet Transform Algorithms
A study is presented that uses an amine mixture as an example to discuss the combination of wavelet and piecewise direct standardization algorithms, which will improve the precision of near infrared (NIR) model transfer.
Methods based on wavelet transform such as denoising, compression, and multiscale analysis were developed for near infrared (NIR) analysis model transfer of an amine mixture to improve the precision of piecewise direct standardization (PDS). Transfer samples and correlative parameters based on wavelet denoising and piecewise direct standardization (WDPDS), wavelet compression and piecewise direct standardization (WCPDS), and wavelet multiscale and piecewise direct standardization (WMPDS) were studied, and the optimal conditions were confirmed.
Near infrared (NIR) spectroscopy analysis has many advantages: It has a high analysis speed and high accuracy, it provides simultaneous determination of multiple components, it is nondestructive, and it causes zero pollution. It has been widely used in the food, medicine, and petrochemical industries. NIR spectra are susceptible to noise and background interference because of the broad and overlapped bands and smaller absorption coefficients. So, it is very important to adopt appropriate methods to reduce noise, compress variables, and improve NIR model speed and precision. Wavelet transform is already an important tool in signal processing because of its property of time-frequency localization. It is widely used in noise reduction, data compression, and background subtraction of NIR spectra (1–3).
Calibration transfer is a technique for transferring a NIR calibration model from a reference analytical instrument to a target analytical instrument that may be a different instrument, or the same instrument at a later time (4,5). Piecewise direct standardization (PDS) is a general and successful model-transfer algorithm; it can select the optimized window width of the spectral range for correction (6). However, the PDS algorithm is only dependent on a fixed-size window width in the entire spectral range, and there are too many transfer data variables. Consequently, the precision of calibration transfer needs to be further improved.
This study uses an amine mixture as an example to discuss the combination of wavelet and PDS algorithms, which will improve the precision of NIR model transfer. Also, the transfer effects are compared among the denoising, compression, and multiscale wavelet transform methods.
Fundamentals and Algorithms
Wavelet Denoising and Piecewise Direct Standardization
The wavelet denoising and piecewise direct standardization (WDPDS) algorithm (7) combines wavelet denoising and PDS. First, the signal NIR spectra are decomposed with wavelet transform and the smaller absolute value of coefficients are removed. Then, the rest of the wavelet coefficients are directly used in PDS transfer. Lastly, the spectra are reconstructed based upon the calibrated wavelet coefficients. The specific steps are as follows:
- Select transfer samples and obtain their spectra from the reference and the target instruments, respectively.
- Determine the wavelet function and decomposition level.
- Calculate wavelet coefficients of transfer samples from the two instruments, sort the absolute value in descending order, and determine the number (m) of wavelet coefficients for calibration. (This step is the process of noise reduction.)
- Use the PDS algorithm to calculate the transfer matrixes F1 of selected wavelet coefficients (m) for calibration.
- Pretreat the spectra signal of unknown samples from the target instrument in the same way, select the same number of wavelet coefficients and correct them with transfer matrixes F1, and lastly, reconstruct the calibrated spectra.
- Predict the corrected spectra of unknown samples and get the corresponding results, using the NIR model established in the reference instrument.
Wavelet Compression and Piecewise Direct Standardization
The wavelet compression and piecewise direct standardization (WCPDS) algorithm (8,9) combines wavelet compression with PDS. Wavelet compression participates in both the establishment of the NIR model in the reference instrument and NIR model transfer. The concrete steps are as follows:
- Decompose the NIR spectral data of calibration samples from the reference instrument with wavelet transform, and set the wavelet transform decomposition level. Select wavelet coefficients that are relevant to sample quality, and use the partial least squares (PLS) regression method to set the model.
- Select transfer samples and obtain their spectra from the reference and the target instruments, respectively.
- Process the signals of the transfer samples with the same wavelet transform, and select the same wavelet coefficients.
- Use the PDS algorithm to calculate the transfer matrixes F2 of selected wavelet coefficients.
- Process signals of unknown samples from the target instrument in the same way, and correct them with transfer matrixes F2.
- Predict the reconstructed spectra of unknown samples and get the corresponding results, using the NIR model established in the reference instrument.
Wavelet Multiscale and Piecewise Direct Standardization
The wavelet multiscale and piecewise direct standardization (WMPDS) algorithm (10) takes advantage of the multiresolution analysis features of wavelet transformation. Wavelet function and decomposition level are determined according to needs, the difference between instruments is decomposed into wavelet coefficients of each layer, and the window widths of PDS algorithm are adjusted to the changes of wavelet coefficients. The specific steps are as follows:
- Select transfer samples and obtain their spectra from the reference and target instruments, respectively.
- Determine mother wavelet and decomposition level n, then process the above-mentioned spectra with wavelet transform.
- Optimize the window width of the PDS algorithm; the window width of wavelet coefficients in the first level is w, and in the level i is 2iw. Calculate the transfer matrixes F3 of wavelet coefficients with the PDS algorithm.
- Obtain NIR spectra of unknown samples from the target instrument. Pretreat them in the same way and calibrate the spectra data with F3.
- Predict the reconstructed spectra of unknown samples and get the corresponding results, using the NIR model established in the reference instrument.
Experimental
Basic Data
The amine mixture is a kind of liquid propellant fuel, which consists of approximately 50% triethylamine, 50% dimethylaniline, and a few other components, such as diethylamine and water. The triethylamine and dimethylaniline content were both determined by potentiometric titration. The testing values are the average of repetitious measurements. The concentration range of triethylamine was 44.8–51.8%; the concentration range of dimethylaniline was 46.5–52.2%.
NIR Spectroscopy
Two NIR-2000 spectrometers (Yingxian Instrument Co. Ltd.) with a transmission detector (CCD, 2048 pixels) were used to acquire NIR spectra with a wavelength range of 700–1100 nm (resolving power 1.5 nm). The instrument used for model development was named the reference instrument (R) and the other instrument, used for standardization, was named the target instrument (T). Amine mixture samples were filled into quartz cuvettes with a pathlength of 5 cm. Then they were placed in the NIR instruments and allowed to stabilize to a constant temperature of 25 ± 0.5 °C. Each NIR spectrum represents the average of 10 scans. Figure 1 shows NIR spectra of the amine mixture.
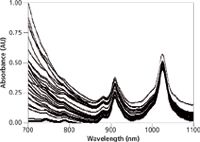
Figure 1: Spectra of the mixed amine sample.
Model Establishment, Model Transfer, and Model Assessment
In this study, 68 amine mixture samples were sorted according to dimethylaniline content. Prediction samples were selected from every four samples, and the remaining 54 samples formed the calibration set. All of the sample spectra were from instrument R. Data processing, involving smoothing and derivative calculation, and appropriate chemometric methods (PLS) were carried out. Then a calibration model was selected based on the optimal factor number, which was confirmed by cross-validation with the predictive residual error sum of squares (PRESS). The calibration model was defined in terms of correlation coefficient (R2), standard error of calibration (SEC), and standard error of prediction (SEP).
Transfer samples were selected out of the calibration set using the Kennard–Stone (K-S) algorithm (11) based on Mahalanobis distance. The spectra of transfer samples and prediction samples were from both instrument R and instrument T. WDPDS, WCPDS, and WMPDS algorithms were used to achieve calibration model transfer from instrument R to instrument T, respectively. The transfer effect was defined in terms of average of root mean square (ARMS) of the transfer samples spectra, standard error of transfer samples (SET), and SEP.

N is the number of spectral data of all wave length (λ). Si2λ is the spectral data of wavelength λ of the number i sample from the target instrument, which have been corrected by PDS, WCPDS, WDPDS, or WMPDS. Si1λ is the spectral data of wavelength λ of the number i sample from reference instrument. M is the number of transfer samples.
Results and Discussion
Selection of Transfer Samples
Transfer samples were selected out of the calibration set by the K-S algorithm (9). The minimum number of transfer samples was determined through ARMS, as shown in Figure 2. When the number increased to five, the value of ARMS leveled off. So, the minimum acceptable number is five.
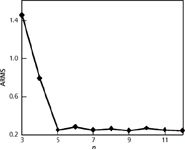
Figure 2: Changes of average of root mean square (ARMS) with the number (n) of transfer samples.
Selection of Algorithm Parameters
WDPDS Algorithm
The transfer samples spectra from both the reference and target instruments were processed with wavelet denoising. The wavelet decomposition level on the mother wavelet of db4 was chosen as four according to Figure 3. Then the average of absolute coefficients value for each layer was calculated. Finally, three larger coefficients were used for calibration by the PDS algorithm with the same window size. The PDS window width was determined based on the principle of minimum SET of mixed amine properties; as shown in Figure 4 for triethylamine, the number of transfer samples was five and window width was 9. The same method was used for dimethylaniline, in which the number of transfer samples was five and the window width was 13.
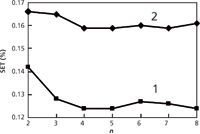
Figure 3: Relative curves between SET and triethylamine (plot 1) and dimethylaniline (plot 2) wavelet decomposition level in the WDPDS algorithm.
WCPDS Algorithm
Signals of calibration samples were decomposed at level four on the mother wavelet of db4. The first level detail coefficients were chosen for PLS model development. The optimal factor of the PLS model for both triethylamine and dimethylaniline was six. Spectra of transfer samples from both the reference and target instruments were processed with the same wavelet compression algorithm, and the first layered wavelet coefficients were corrected by the PDS algorithm. The PDS window width was determined based on the principle of minimum SET of mixed amine properties. For both triethylamine and dimethylaniline, the optimal window width was nine.
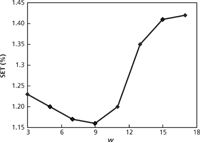
Figure 4: Changes of SET of triethylamine with the width of WDPDS windows in the WDPDS algorithm.
WMPDS Algorithm
The mother wavelet of db4 was selected. Spectra of transfer samples from both the reference and target instruments were processed. Wavelet decomposition level (n) and PDS window width (w) are important parameters to consider. If w is too small, the selected spectral data will miss instrument differences. Conversely, if w is too large, the selected spectral data will contain irrelevant information, which can lead to calculation and "over-correction" problems. Layer selection for wavelet decomposition is relevant to analysis precision and spectral signal-to-noise ratio. Level n and window width w of the first level were determined by means of ARMS variety, as shown in Figure 5. When n is 4, w is 13, ARMS was minimum, so the optimal decomposition level n is 4, and the optimal window width w of the first level is 13.
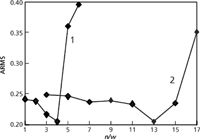
Figure 5: Changes of ARMS with decomposed level n (plot 1) and window width w (plot 2) in WMPDS algorithm.
Results Analysis
NIR spectra of prediction samples measured from the target instrument T were calibrated by the PDS algorithm, the WDPDS algorithm, the WCPDS algorithm, and the WMPDS algorithm, respectively. Values of prediction samples were achieved through the analysis of all these calibrated spectra, using the PLS model developed from the reference instrument R. The results and parameters in each case are shown in Tables I and II.

Table I: Results of model transfer on triethylamine
For precision of spectral prediction results in the target instrument, SEP values of both triethylamine and dimethylaniline determined by transferred model are much smaller than those by calibration model in reference instrument without transfer. Compared with the PDS algorithm, the WDPDS, WCPDS, and WMPDS algorithms can reduce the difference of two instruments to a certain degree, because of wavelet denoising, wavelet compression, and wavelet multiscale. The WMPDS algorithm takes advantage of the wavelet multiscale feature; the difference among the instruments were decomposed into wavelet coefficients of each layer, and the window widths of the PDS algorithm can be adjusted based on wavelet coefficients. Therefore, WMPDS can effectively improve the precision of model transfer.

Table II: Results of model transfer on dimethylaniline
For the transfer process, the WCPDS algorithm is superior to other methods because the WCPDS algorithm can effectively compress spectral data and make the number of optimal factors smaller in the PLS algorithm.
Conclusions
Spectral differences between instruments could be reduced to a certain degree when the PDS algorithm combined with wavelet transforms was applied to model transfer for noise reduction, data compression, and multiresolution analysis. Compared with the traditional PDS algorithm, the WDPDS, WCPDS, and WMPDS algorithms could effectively improve the precision of model analysis to a certain degree. The WMPDS algorithm made full use of multiscale wavelet analysis, the PDS window size was dynamically adjusted, and differences among instruments were decomposed into wavelet coefficients of each layer. So, the disadvantages of traditional PDS algorithms that always depend on fixed-size transfer windows were resolved, and the accuracy of model transfer could be significantly improved.
References
(1) B.M. Nicolai, K.I. Theron, and J. Lammertyn, Chemom. Intell. Lab. Syst. 85, 243–252 (2007).
(2) K.E. Jang et al., J. Biomed. Opt.. 14, 034004:1–034004:13 (2009).
(3) C. Tan and M.L. Li, Anal. Sci. 23, 201–206 (2007).
(4) K.S. Parka et al., Chemom. Intell. Lab. Syst. 55, 53–65 (2001).
(5) M. Sohn, F.E. Barton, and D.S. Himmelsbach, Appl. Spectrosc. 61, 414–418 (2007).
(6) M.L. Griffiths, D. Svozil, and P. Worsfold. J. Anal. At. Spectrom. 21, 1045–1052 (2006).
(7) C. Tan, X. Tan, and T. Wu, Comput. Appl. Chem. 26, 645–648 (2009).
(8) G.Y. Tian et al., Chin. J. Anal. Chem. 34, 927–932 (2006).
(9) J. Yoon, B. Lee, and C. Han, Chemom. Intell. Lab. Syst. 64, 1–14 (2002).
(10) J.X. Wang et al., Chin. J. Anal. Chem. 39, 846–850 (2011).
(11) H. Li et al., Spectrosc. Spectral Anal.. 31, 366-370 (2011).
Ju Xiang Wang, Zhi Na Xing, and Jun Qu are with the Department of Airborne Vehicle Engineering at the Naval Aeronautical and Astronautical University in Yantai, China. Direct correspondence to: juxiangw@163.com

Best of the Week: AI and IoT for Pollution Monitoring, High Speed Laser MS
April 25th 2025Top articles published this week include a preview of our upcoming content series for National Space Day, a news story about air quality monitoring, and an announcement from Metrohm about their new Midwest office.
LIBS Illuminates the Hidden Health Risks of Indoor Welding and Soldering
April 23rd 2025A new dual-spectroscopy approach reveals real-time pollution threats in indoor workspaces. Chinese researchers have pioneered the use of laser-induced breakdown spectroscopy (LIBS) and aerosol mass spectrometry to uncover and monitor harmful heavy metal and dust emissions from soldering and welding in real-time. These complementary tools offer a fast, accurate means to evaluate air quality threats in industrial and indoor environments—where people spend most of their time.