Novel LC–MS/MS Method with a Dual ESI and APCI Ion Source for Analysis of California-Regulated Pesticides and Mycotoxins in Medium-Chain Triglyceride (MCT) Oil Cannabis Tinctures
Analysis of 66 pesticides and 5 mycotoxins regulated by the State of California in cannabis tinctures were analyzed using LC–MS/MS with an ESI source, and LC–MS/MS with an APCI source. A simple, fast, and cheap acetonitrile solvent extraction method was used for sample preparation for good recovery and high throughput, and internal standards were used to compensate for ion suppression effects from the hydrophobic matrix.
Oil-based tinctures are an increasingly popular means of consuming cannabis, because they are relatively simple to both dose and intake. These tinctures are generally formulated by dissolving cannabis concentrates in medium chain triglyceride (MCT) oil (1). The cannabis concentrates are prepared by the extraction of cannabinoids and other compounds from cannabis plant material using solvents such as butane, ethanol, and supercritical carbon dioxide (2). This preparation concentrates not only cannabinoids, but also any pesticides and mycotoxins found on the plant (3). Both pesticides and mycotoxins present a significant public health risk, and therefore robust analysis of cannabis products must be implemented across the supply chain to protect consumers. With the changing legal nature of the cannabis drug, stricter regulations for cannabis products are coming into force. California has now enforced some of the most stringent regulations, including maximum residue limits for a total of 66 pesticides and 5 mycotoxins in cannabis products in the United States (4). While sample preparation methods have been reported for extracting pesticides from cannabis (such as “quick, easy, cheap, effective, rugged, and safe” [QuECheRS] methods with solid-phase extraction [SPE] and dispersive SPE [dSPE]), these methods are time consuming, expensive, slow, and show poor recoveries for a few analytes, such as daminozide and others (5–8). Furthermore, many of the existing pesticide analysis methods rely on the use of both liquid chromatography–tandem mass spectrometry (LC–MS/MS) and gas chromatography–tandem mass spectrometry (GC–MS/MS), substantially increasing the cost, complexity, and turnaround time of analysis (8,9).
This article presents a novel, cost-effective, and fast LC–MS/MS method to analyze pesticides and mycotoxins in edible cannabis products such as MCT oil tinctures, with low detection limits and good recoveries. The method uses a simple solvent extraction and LC–MS/MS method with a dual electrospray ionization (ESI) and atmospheric-pressure chemical ionization (APCI) source, making it possible to detect the very hydrophobic and chlorinated pesticides that are typically analyzed using GC–MS/MS. With this new method, it was possible to measure all of the 66 pesticides and 5 mycotoxins spiked into MCT oil cannabis tinctures well below the maximum residue limits specified by the State of California in cannabis non-inhalable or edible products (4).
Experimental
Hardware/Software
Chromatographic separation was conducted on a PerkinElmer LX50 ultrahigh-performance liquid chromatography (UHPLC) system, and detection was achieved using a PerkinElmer Q-Sight 420 MS/MS detector with a dual ionization ESI and APCI source, which operates independently with two separate inlets. All instrument control, data acquisition, and data processing was performed using the Simplicity 3Q software platform.
Sample Preparation Method
Below is the step-by-step sample preparation procedure with a 50-fold dilution for the ESI method and a 30-fold dilution for the APCI method:
- Approximately 5 g of MCT oil cannabis tincture was weighed out as a representative for each sample batch.
- One gram of the representative sample was weighed out and placed into a 50 mL centrifuge tube.
- Next, 29 mL of LC/MS grade acetonitrile with 0.1% formic acid was added to the tube, which was then capped. The formic acid was added to the acetonitrile to minimize degradation of a number of analytes including captan, ochratoxin A, and several others.
- The tube was placed in a multitube vortex mixer and allowed to vortex for 10 min.
- The extract was then centrifuged in the tube for 10 min at 3000 rpm.
- Following centrifugation, the supernatant was filtered into another 50 mL centrifuge tube using a PTFE syringe filter. The 50 mL centrifuge was then capped.
- The tube was labeled with the sample ID.
- For the APCI method, 990 µL of extracted sample (from step 7) was transferred into a 2 mL HPLC vial, which was then spiked with 10 µL of internal standard.
- For the ESI method, 600 µL of extracted sample (from step 7) was transferred into a 2 mL HPLC vial, which was then spiked with 10 µL of internal standard and diluted with 390 µL of LC–MS grade acetonitrile with 0.1% formic acid.
The HPLC vial was then mixed on a vortex mixer. - The sample was injected for LC–MS/MS analysis.
LC Method and MS Source Conditions
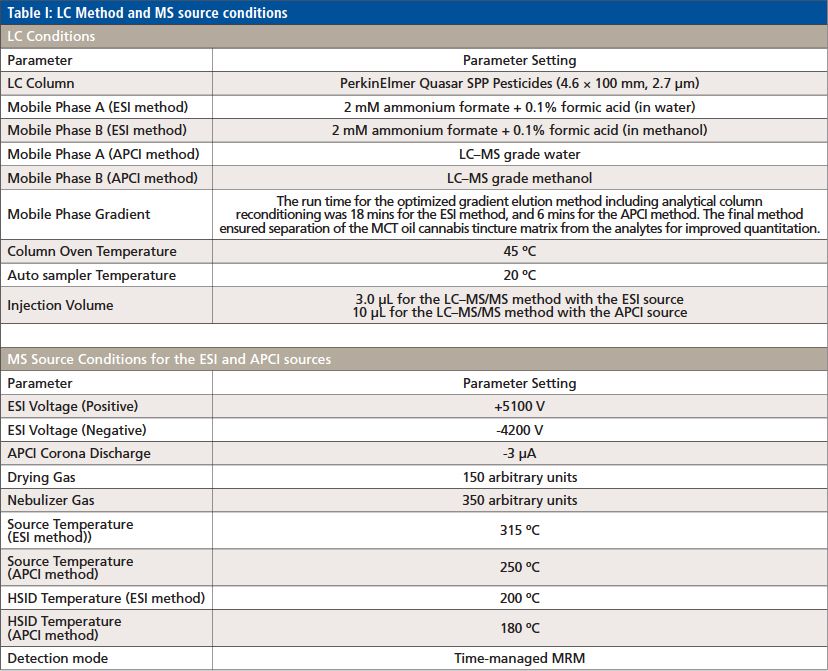
The LC method and MS source parameters are shown in Table I.
Results and Discussion
Detectability and Reproducibility
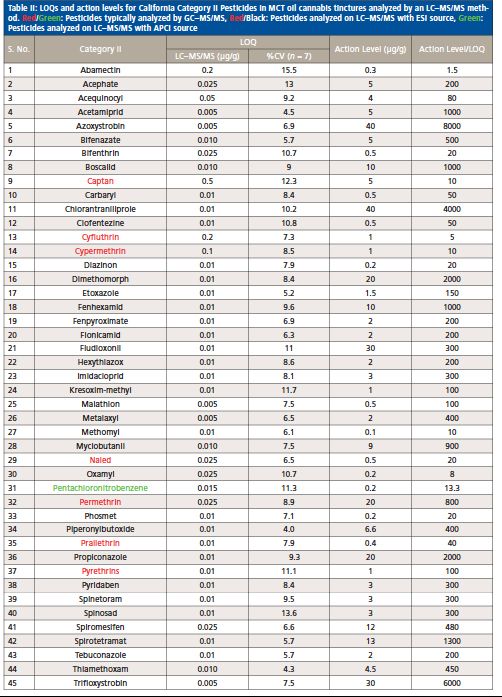
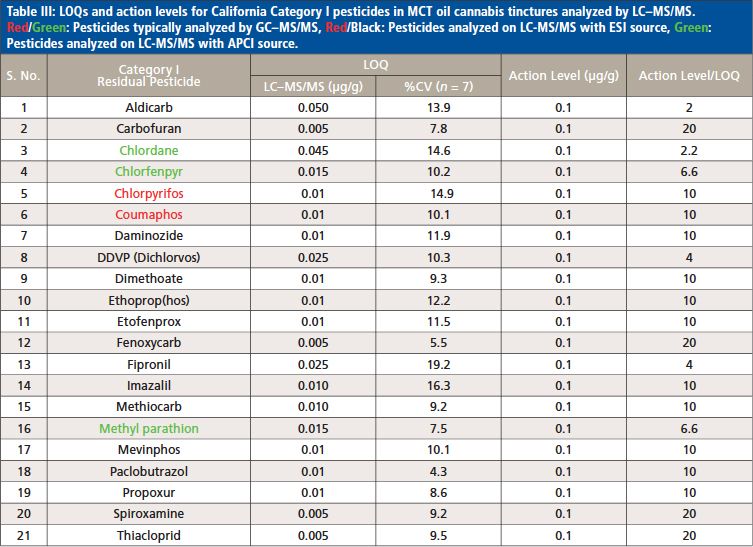
With this LC–MS/MS method, 62 out of 66 pesticides and 5 mycotoxins were analyzed using the ESI source, and the remaining 4 pesticides regulated by the State of California were measured with the APCI source. According to the California Bureau of Cannabis Control’s text of regulations, the 66 pesticides are divided into categories I and II. Category I pesticides are banned for use on cannabis, due to the risks they present to human health and the environment, whereas category II pesticides are eligible for use on cannabis plants. This categorization reflects the varying action limits and corresponding limit of quantitation (LOQ) requirements for these pesticides and five mycotoxins in different cannabis-related products (4). The LOQs and response reproducibility at LOQ level for each of the pesticides categorized and mycotoxins in MCT oil cannabis tinctures are summarized in Table II, III and IV. The LOQs were determined by ensuring that the signal-to-noise ratio for each analyte was greater than 10. The response relative standard deviation (RSD) for each pesticide and mycotoxin at its LOQ level in the cannabis matrix was less than 20% for seven replicates. As demonstrated in Tables II–IV, the LOQs determined in this study are well below the California action limits (by a factor of 1.5 to 8000) for all of the analyzed pesticides and mycotoxins. This shows that the method is sufficiently sensitive and reproducible for pesticide and mycotoxin analysis in MCT oil cannabis tinctures at the regulatory limits specified by the State of California. In addition, the matrix-matched calibration curves showed excellent linearity for all of the analytes in the tinctures with coefficients of determination (R2) greater than 0.99.

Recovery Studies with Solvent Extraction
Sample preparation is the main bottleneck for the high throughput analysis of pesticides and mycotoxins in cannabis-related matrices. Traditional sample preparation techniques like SPE and QuEChERS are time-consuming and laborious, requiring multiple steps and expensive sorbents, with low recovery for some pesticides (5–8). Solvent extraction was therefore used in this method as a cheap, fast, and simple alternative that could achieve high extraction recovery. The cannabis tincture samples were tested to confirm the absence of pesticides and mycotoxins before they were spiked at two levels (low and high) for all pesticides (0.1 and 1 µg/g) and mycotoxins (0.02 and 0.2 µg/g). These spiked samples were used to determine pesticide and mycotoxin recovery. The absolute recoveries of all 66 pesticides and 5 mycotoxins at two different levels were within an acceptable range of 80 to 120% with an RSD less than 20%. No recovery data was obtained for the pesticides captan, abamectin, and cyfluthrin at the lower level of 0.1 µg/g, since the LOQ of these pesticides is higher than 0.1 µg/g.
Matrix Effects
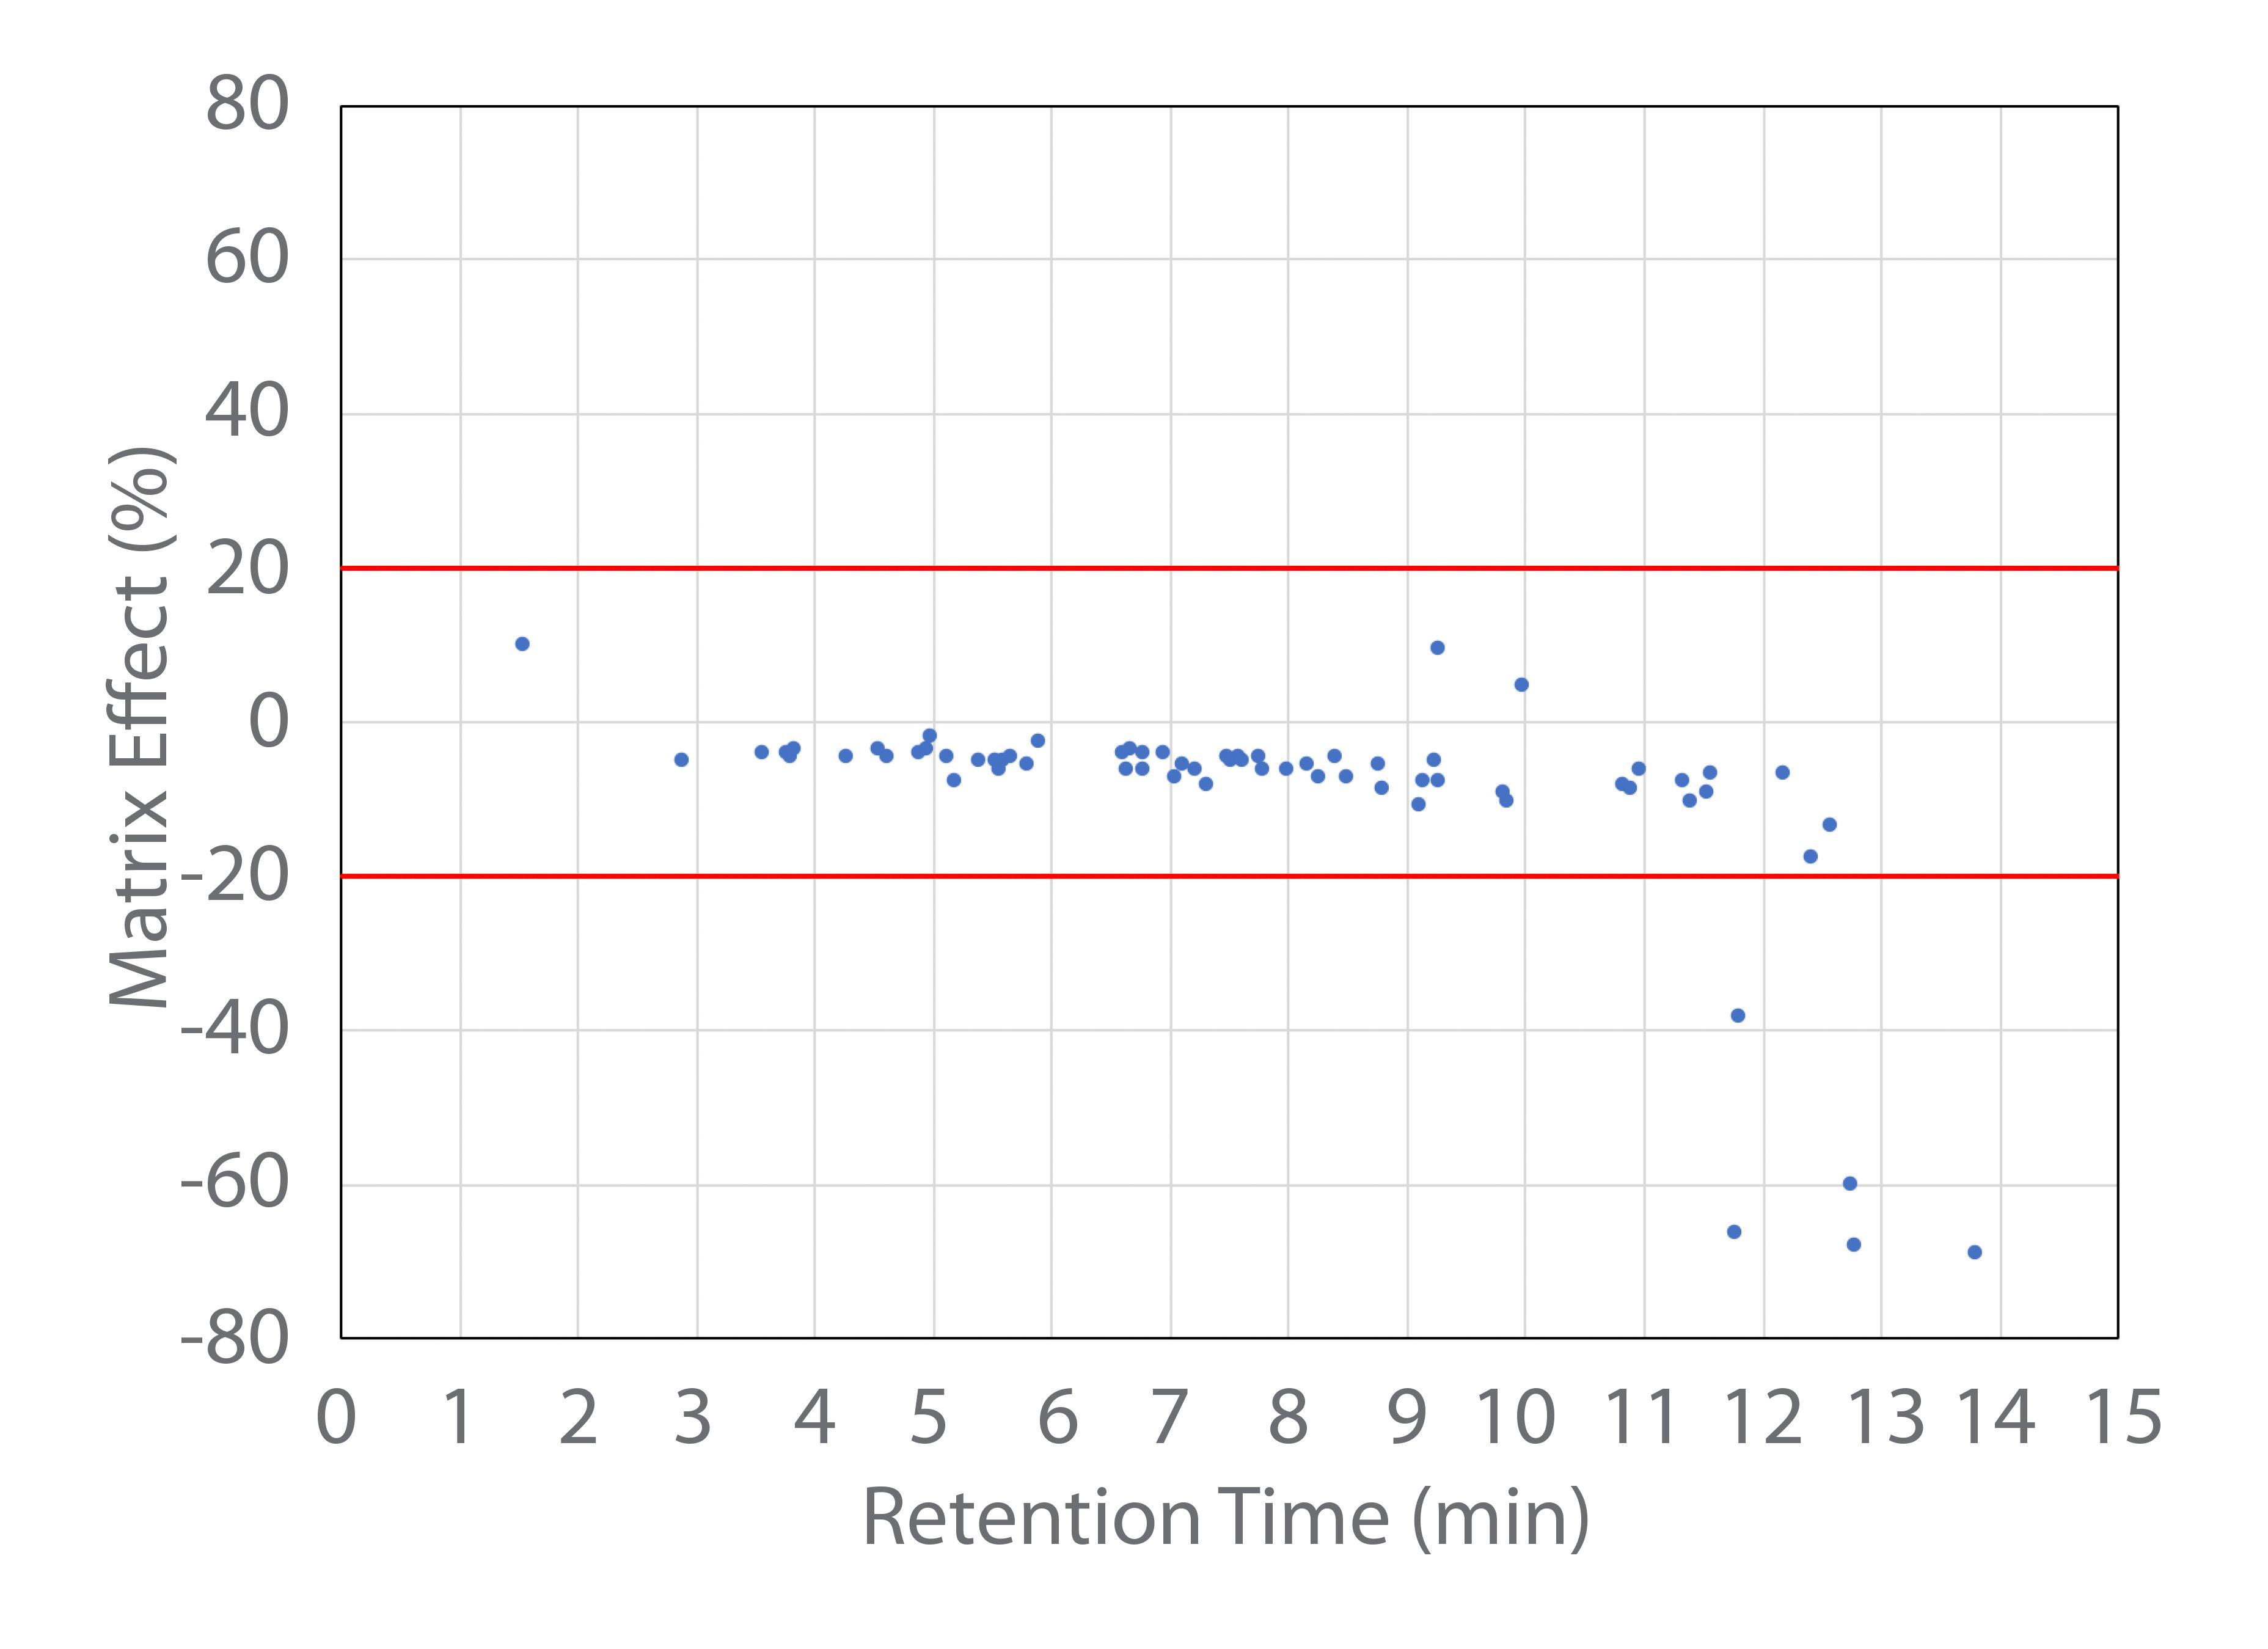
The hydrophobic nature of the MCT oil matrix can lead to significant matrix effects. The ion suppression or enhancement was therefore calculated on the signal of the 62 pesticides and 5 mycotoxins analyzed with the ESI source. The calculation was performed by taking the difference between the signal of the analyte in the matrix and clean solvent, and dividing it by the signal in clean solvent. Figure 1 shows these calculated matrix effects as a function of the analyte retention time on the column. Among the 67 analytes measured with the ESI source, only 3 showed slight signal enhancement, while the rest showed signal suppression effects. Since the MCT oil cannabis tincture matrix is very hydrophobic, significant matrix ion suppression effects of <-20% were only observed for five late-eluting analytes. For those analytes measured with the APCI source, the matrix effects were insignificant (between -20 to 20%) for four analytes. It is generally understood in the literature that fewer matrix effects are observed with the APCI source in comparison to the ESI source (10–12).
Figure 1: The sample matrix effects in MCT oil cannabis tincture for 67 analytes (62 pesticides and 5 mycotoxins) analyzed using an ESI source.
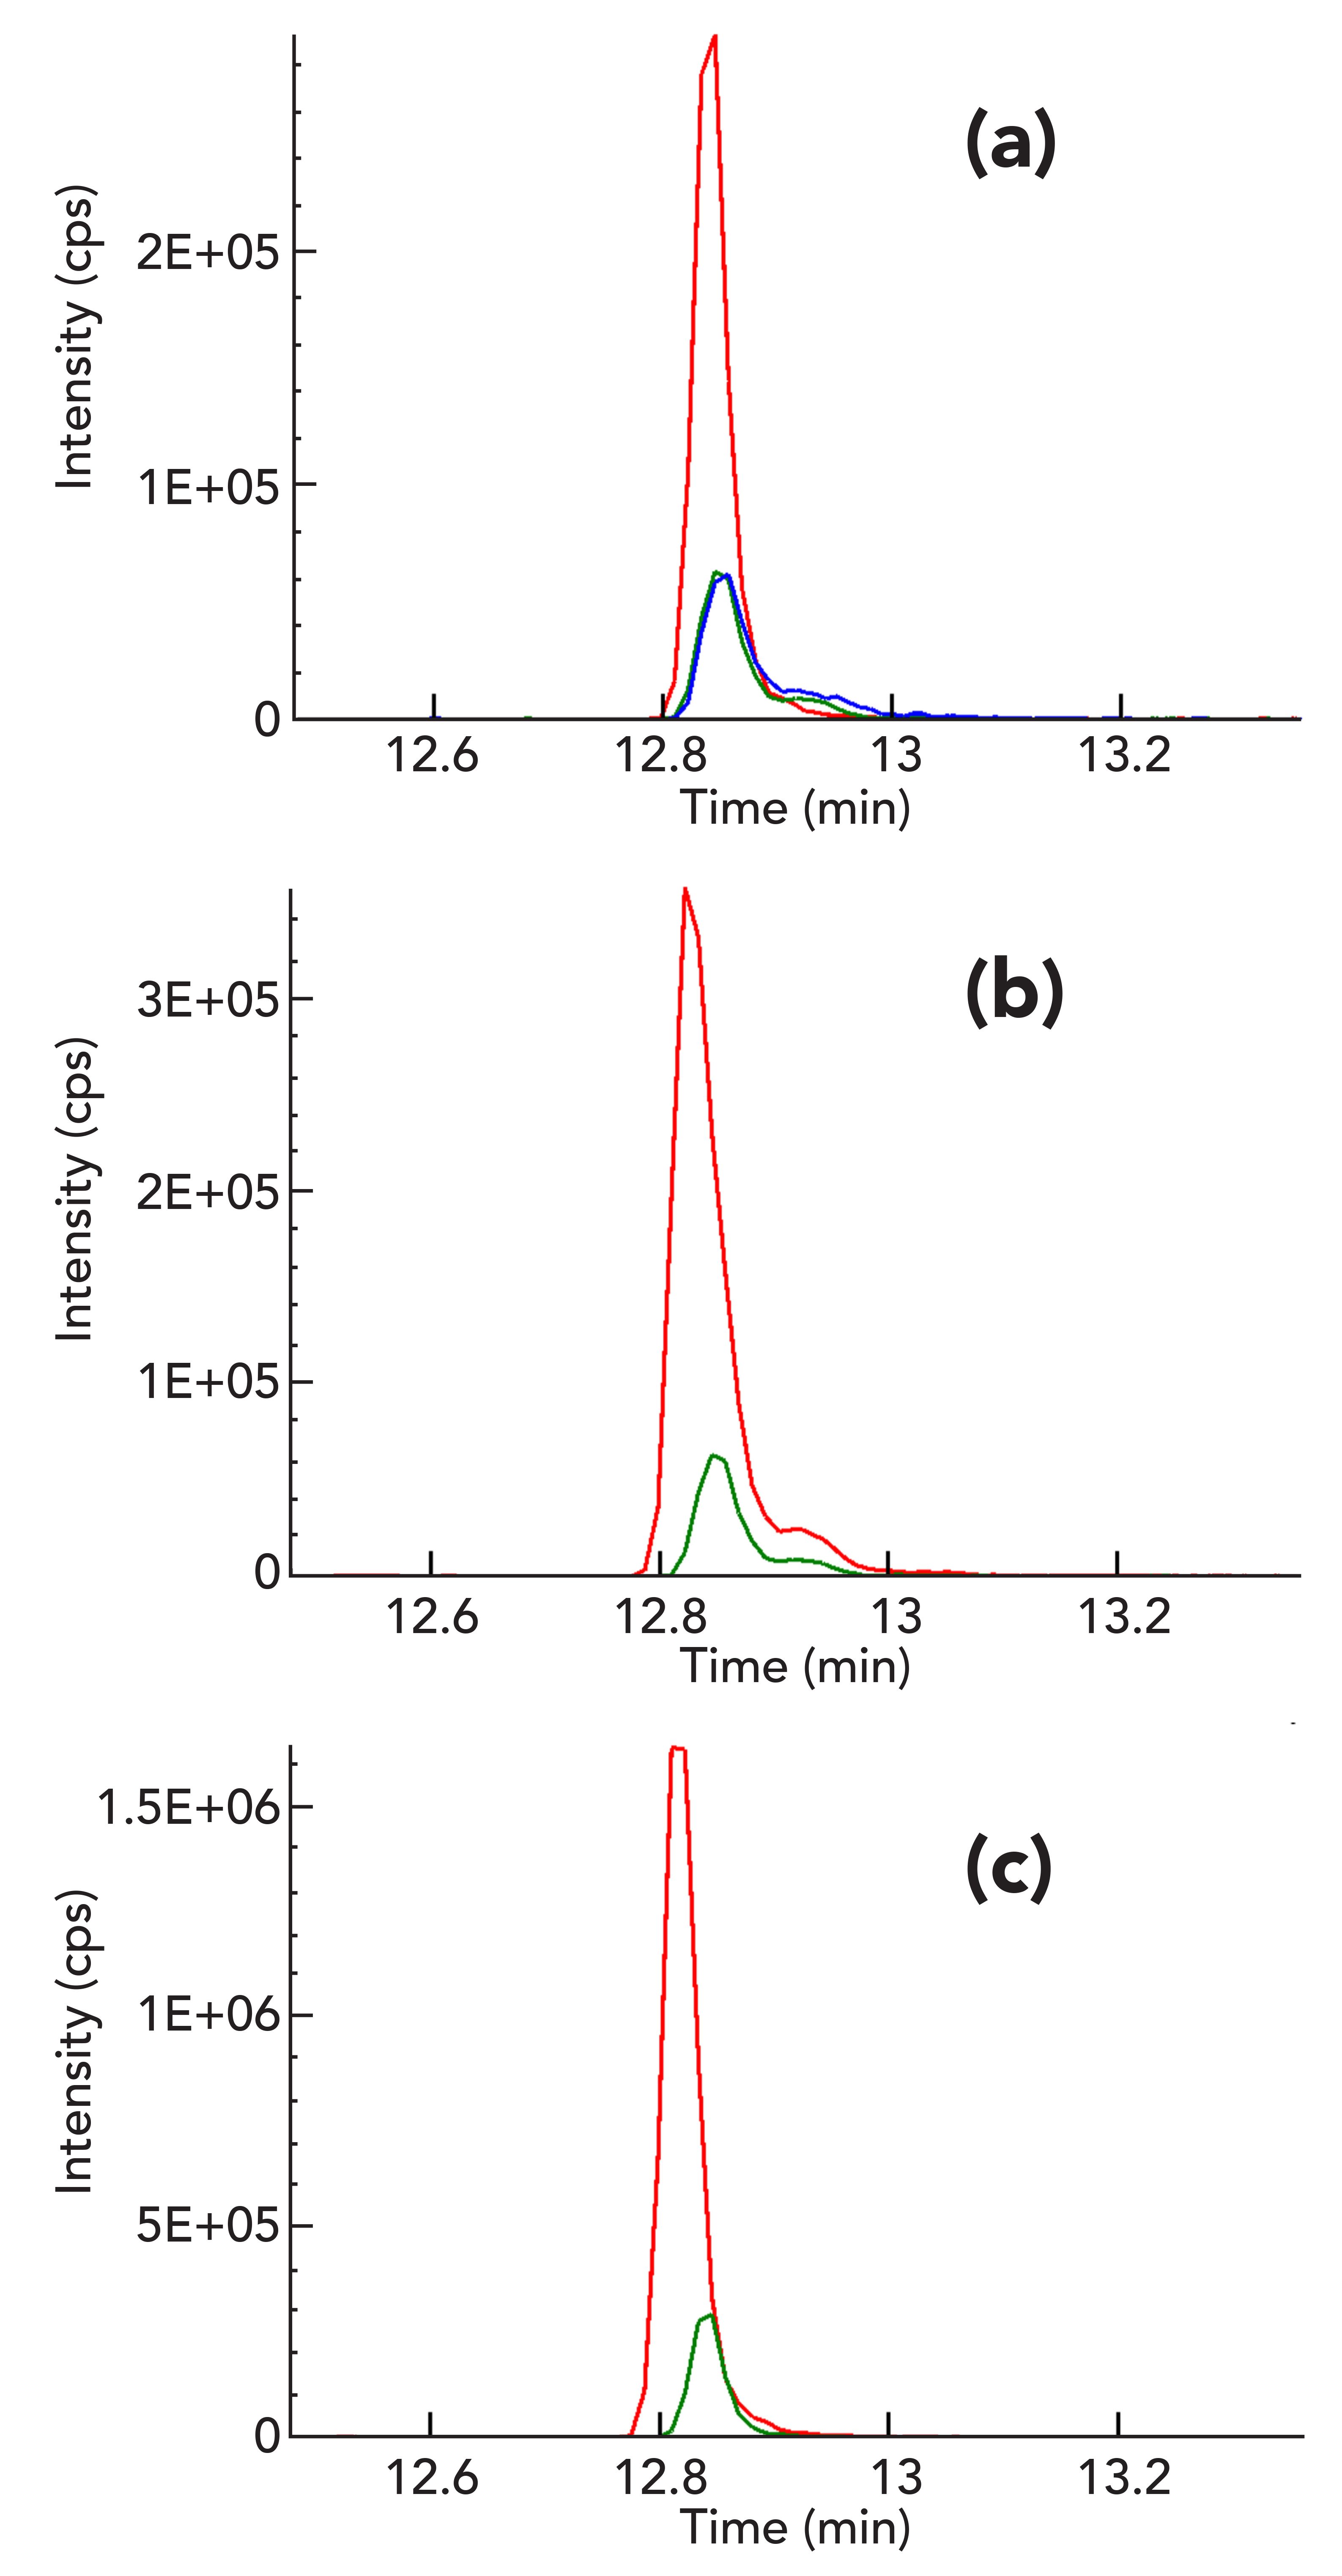
For the five analytes measured with the ESI source that showed significant ion suppression effects of less than -20% (cypermethrin, fenpyroximate, etofenprox, bifenthrin, and acequinocyl), deuterated internal standards were used. The internal standards were selected to improve the quantitative analysis as well as the overall recovery by compensating for the matrix ion suppression effects and correcting for any analyte loss during sample preparation. Figure 2a shows the overlay of the bifenthrin signal in a clean standard solvent and an extract of MCT oil cannabis tinctures spiked with bifenthrin before and after extraction. The recovery from the sample preparation is calculated by taking the percentage ratio of the signal of analyte in prespiked and postspiked extract; the recovery of bifenthrin with sample preparation was calculated as roughly 96%. The overall recovery of the sample preparation method takes into account both the recovery from sample preparation as well as ion suppression effects. It is calculated by taking the percentage ratio of the signal in prespiked extract to the signal in solvent standard. Figure 2a clearly demonstrates that the overall recovery of bifenthrin without internal standard is about 29% due to significant ion suppression effects caused by the matrix. Bifenthrin-D5, a deuterated analog of bifenthrin, was added in fixed amounts to both the solvent standard and the cannabis tincture matrix to compensate for these effects. The internal standard has a similar chemical structure to the analyte and its elution and ionization efficiency (or ion suppression effect) is therefore very similar to the analyte in both the solvent standard and the sample matrix, meaning the response ratios of the analyte to the internal standard is also similar. According to experimental results shown in Figures 2b and 2c, use of internals standard significantly increased the overall recovery of bifenthrin (calculated based on the extracted concentration of prespiked analyte versus the neat solution [unextracted]concentration) from 29% to 101% due to the correction of matrix effects. Finally, the overall recoveries of 70 to 120% with RSD values of less than 20% were achieved for all of the 66 pesticides and 5 mycotoxins with addition of internal standards to MCT oil cannabis tincture matrix.
Figure 2: (a) Overlay of response of bifenthrin in solvent (red) and MCT oil cannabis tincture matrix spiked with bifenthrin before (green) and after (blue) extraction without any internal standard. The response ratio (RR) of bifenthrin spiked in cannabis tincture matrix before extraction to solvent standard was 0.29. The response ratio of bifenthrin spiked in cannabis tincture matrix before and after extraction was 0.96. (b) Overlay of response of bifenthrin (green) and bifenthrin-d5 internal standard (red) in pre-spiked cannabis tincture matrix with a RR of 0.168 for analyte to internal standard. (c) Overlay of response of bifenthrin (green) and bifenthrin-D5 internal standard (red) in solvent with a RR of 0.167 for analyte to internal standard.
Sensitivity and Selectivity of Analysis for Non-Polar Analytes Using an APCI Source
Several of the hydrophobic and non-polar pesticides (pentachloronitrobenzene [PCNB], chlorfenapyr, methyl parathion, and chlordane) found on the California action list are traditionally analyzed by GC–MS/MS because they do not ionize effectively when analyzed using LC–MS/MS with an ESI source. These analytes either have low proton affinity or lack hydrogen atoms, and are difficult to ionize by an ESI source in either positive or negative ion mode. An APCI ion source is much better suited for ionization of very hydrophobic and nonpolar analytes, and this source was therefore used to determine the detection limits of these hydrophobic analytes in cannabis tinctures. Using a fast 6-min LC–MS/MS method with an APCI source developed earlier by this author’s group (13), the LOQs of PCNB, methyl parathion, chlorfenapyr, and chlordane in cannabis tincture were in the range of 0.015 to 0.045 µg/g, making the method suitable for pesticide analysis in cannabis edible or non-inhalable products.
Figure 3: The response for PCNB in (a) a cannabis tincture matrix spiked at a level of 0.045 µg/g and (b) a blank cannabis tincture matrix.
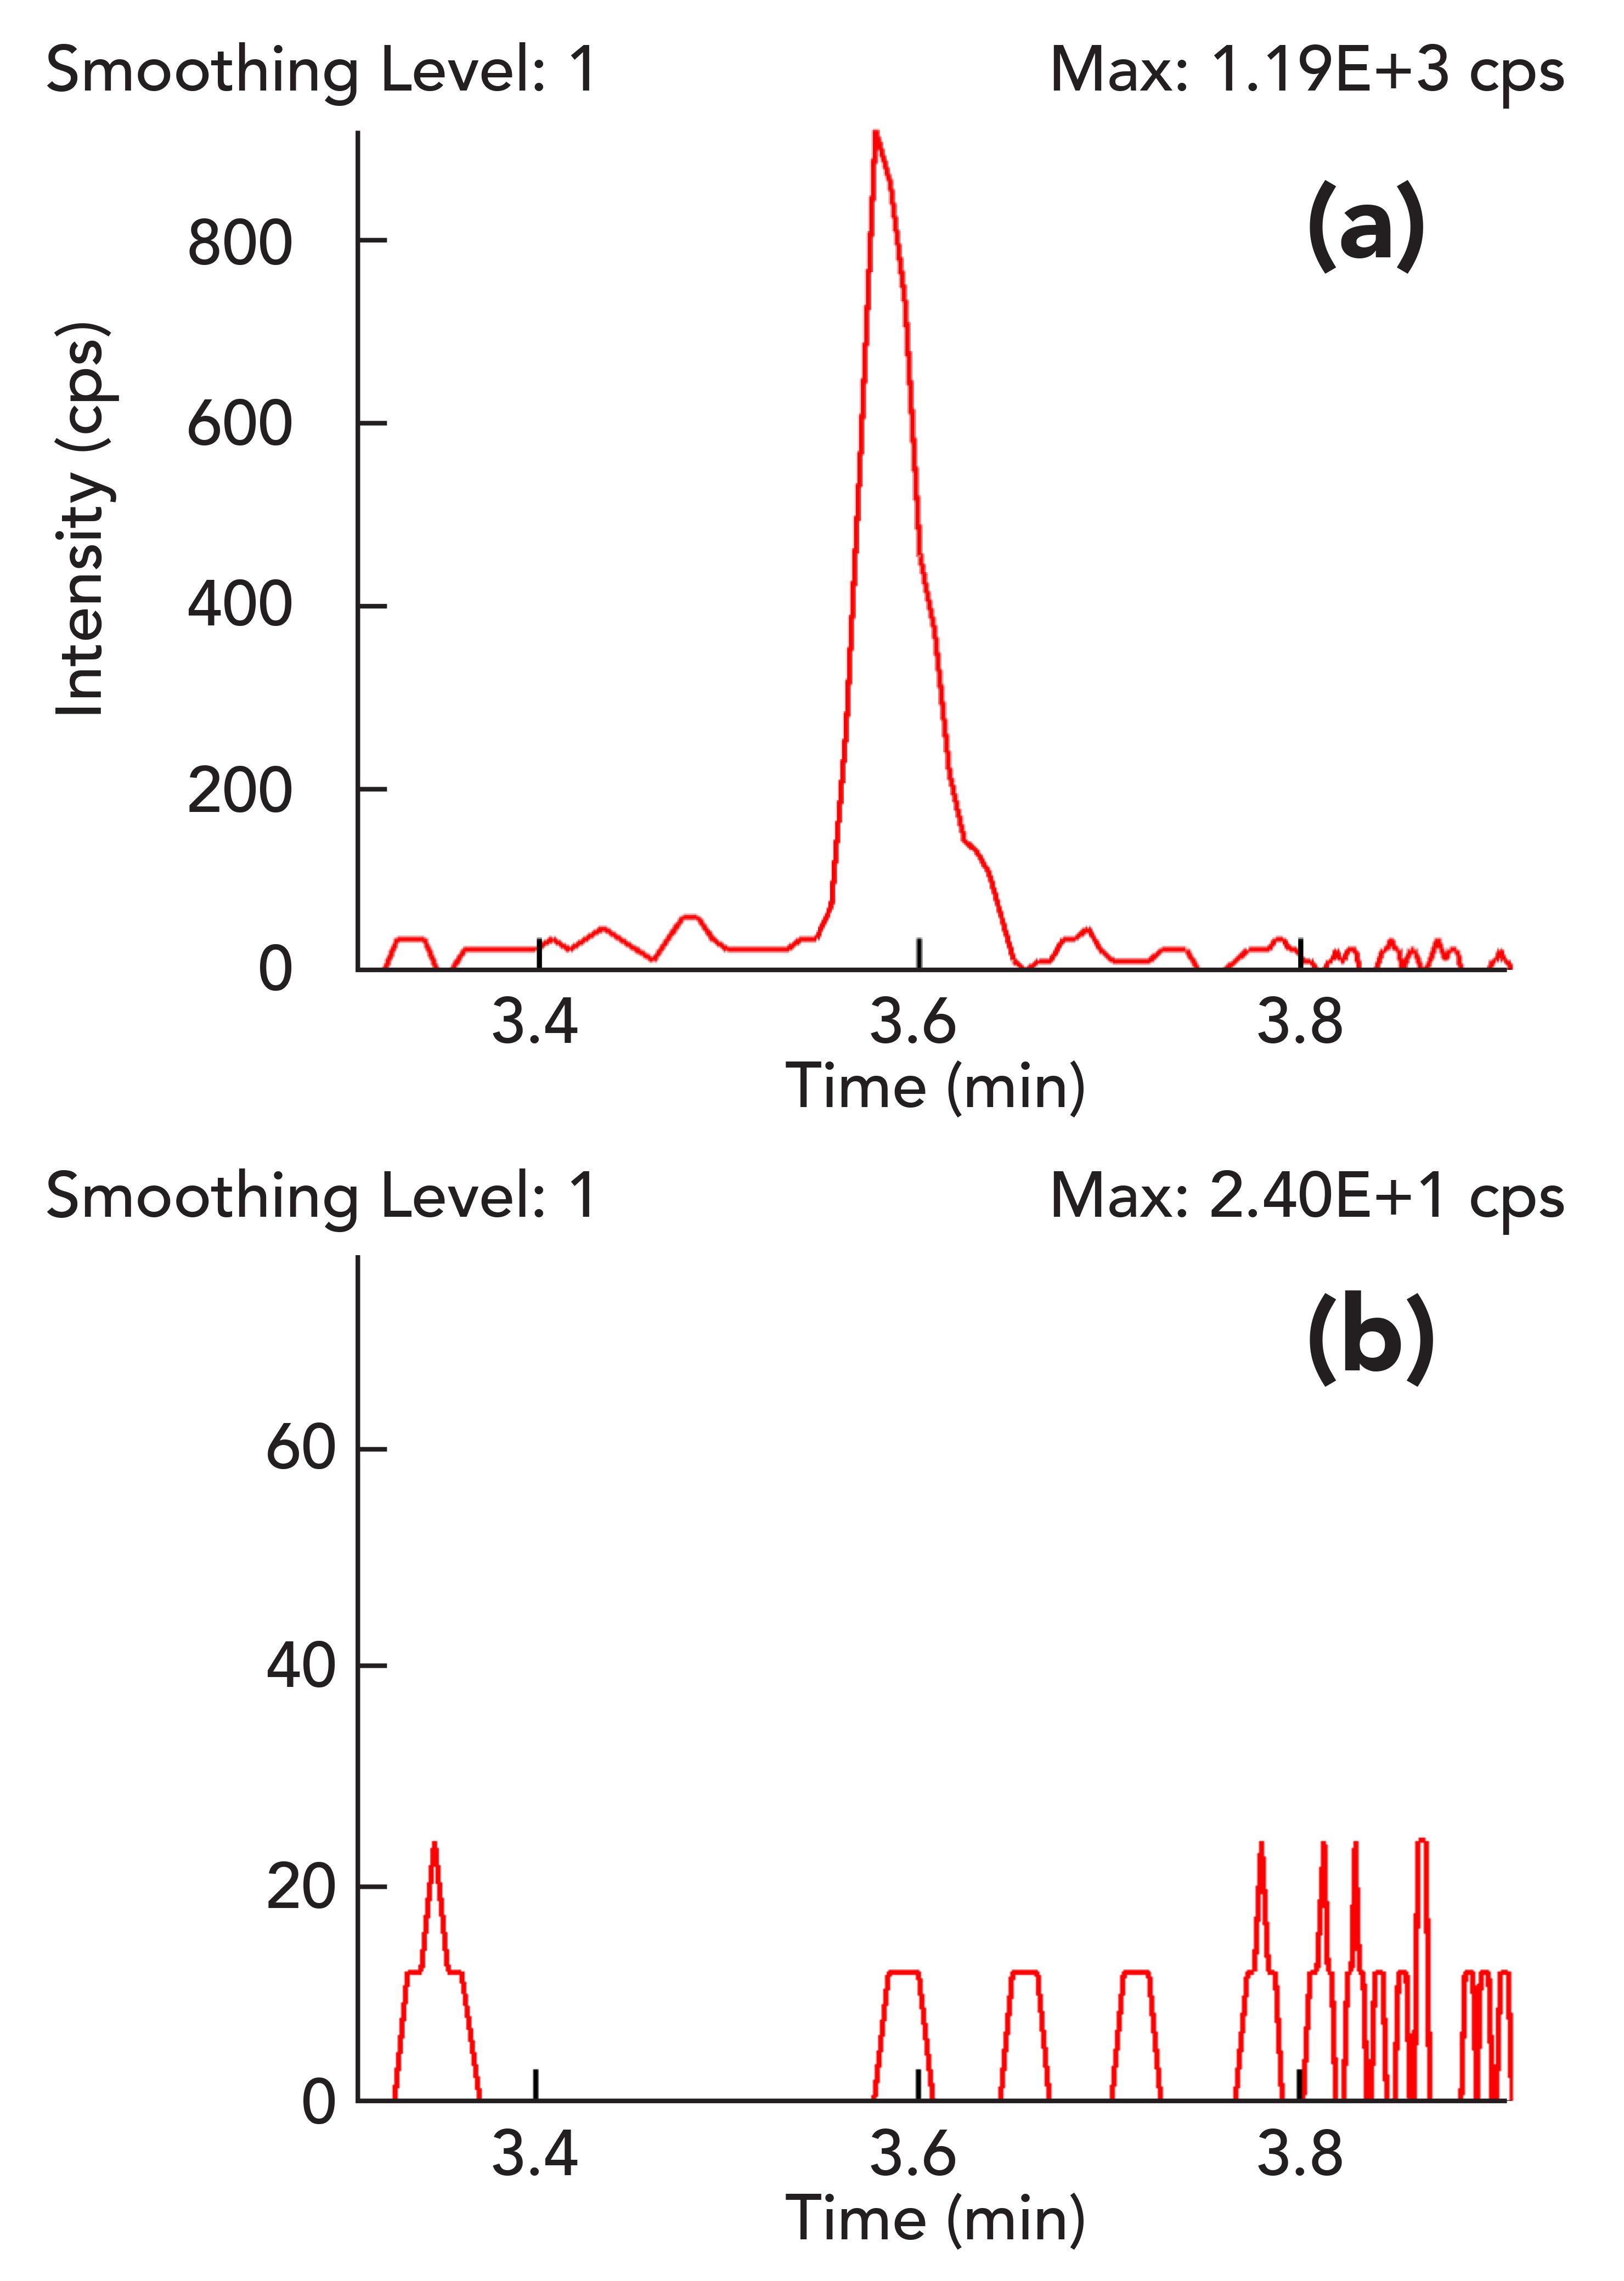
a shows an excellent signal-to-noise ratio (S/N = 38) for PCNB spiked at 0.045 µg/g in the cannabis matrix using an LC–MS/MS system with an APCI source. This demonstrates the extreme sensitivity of the APCI method.
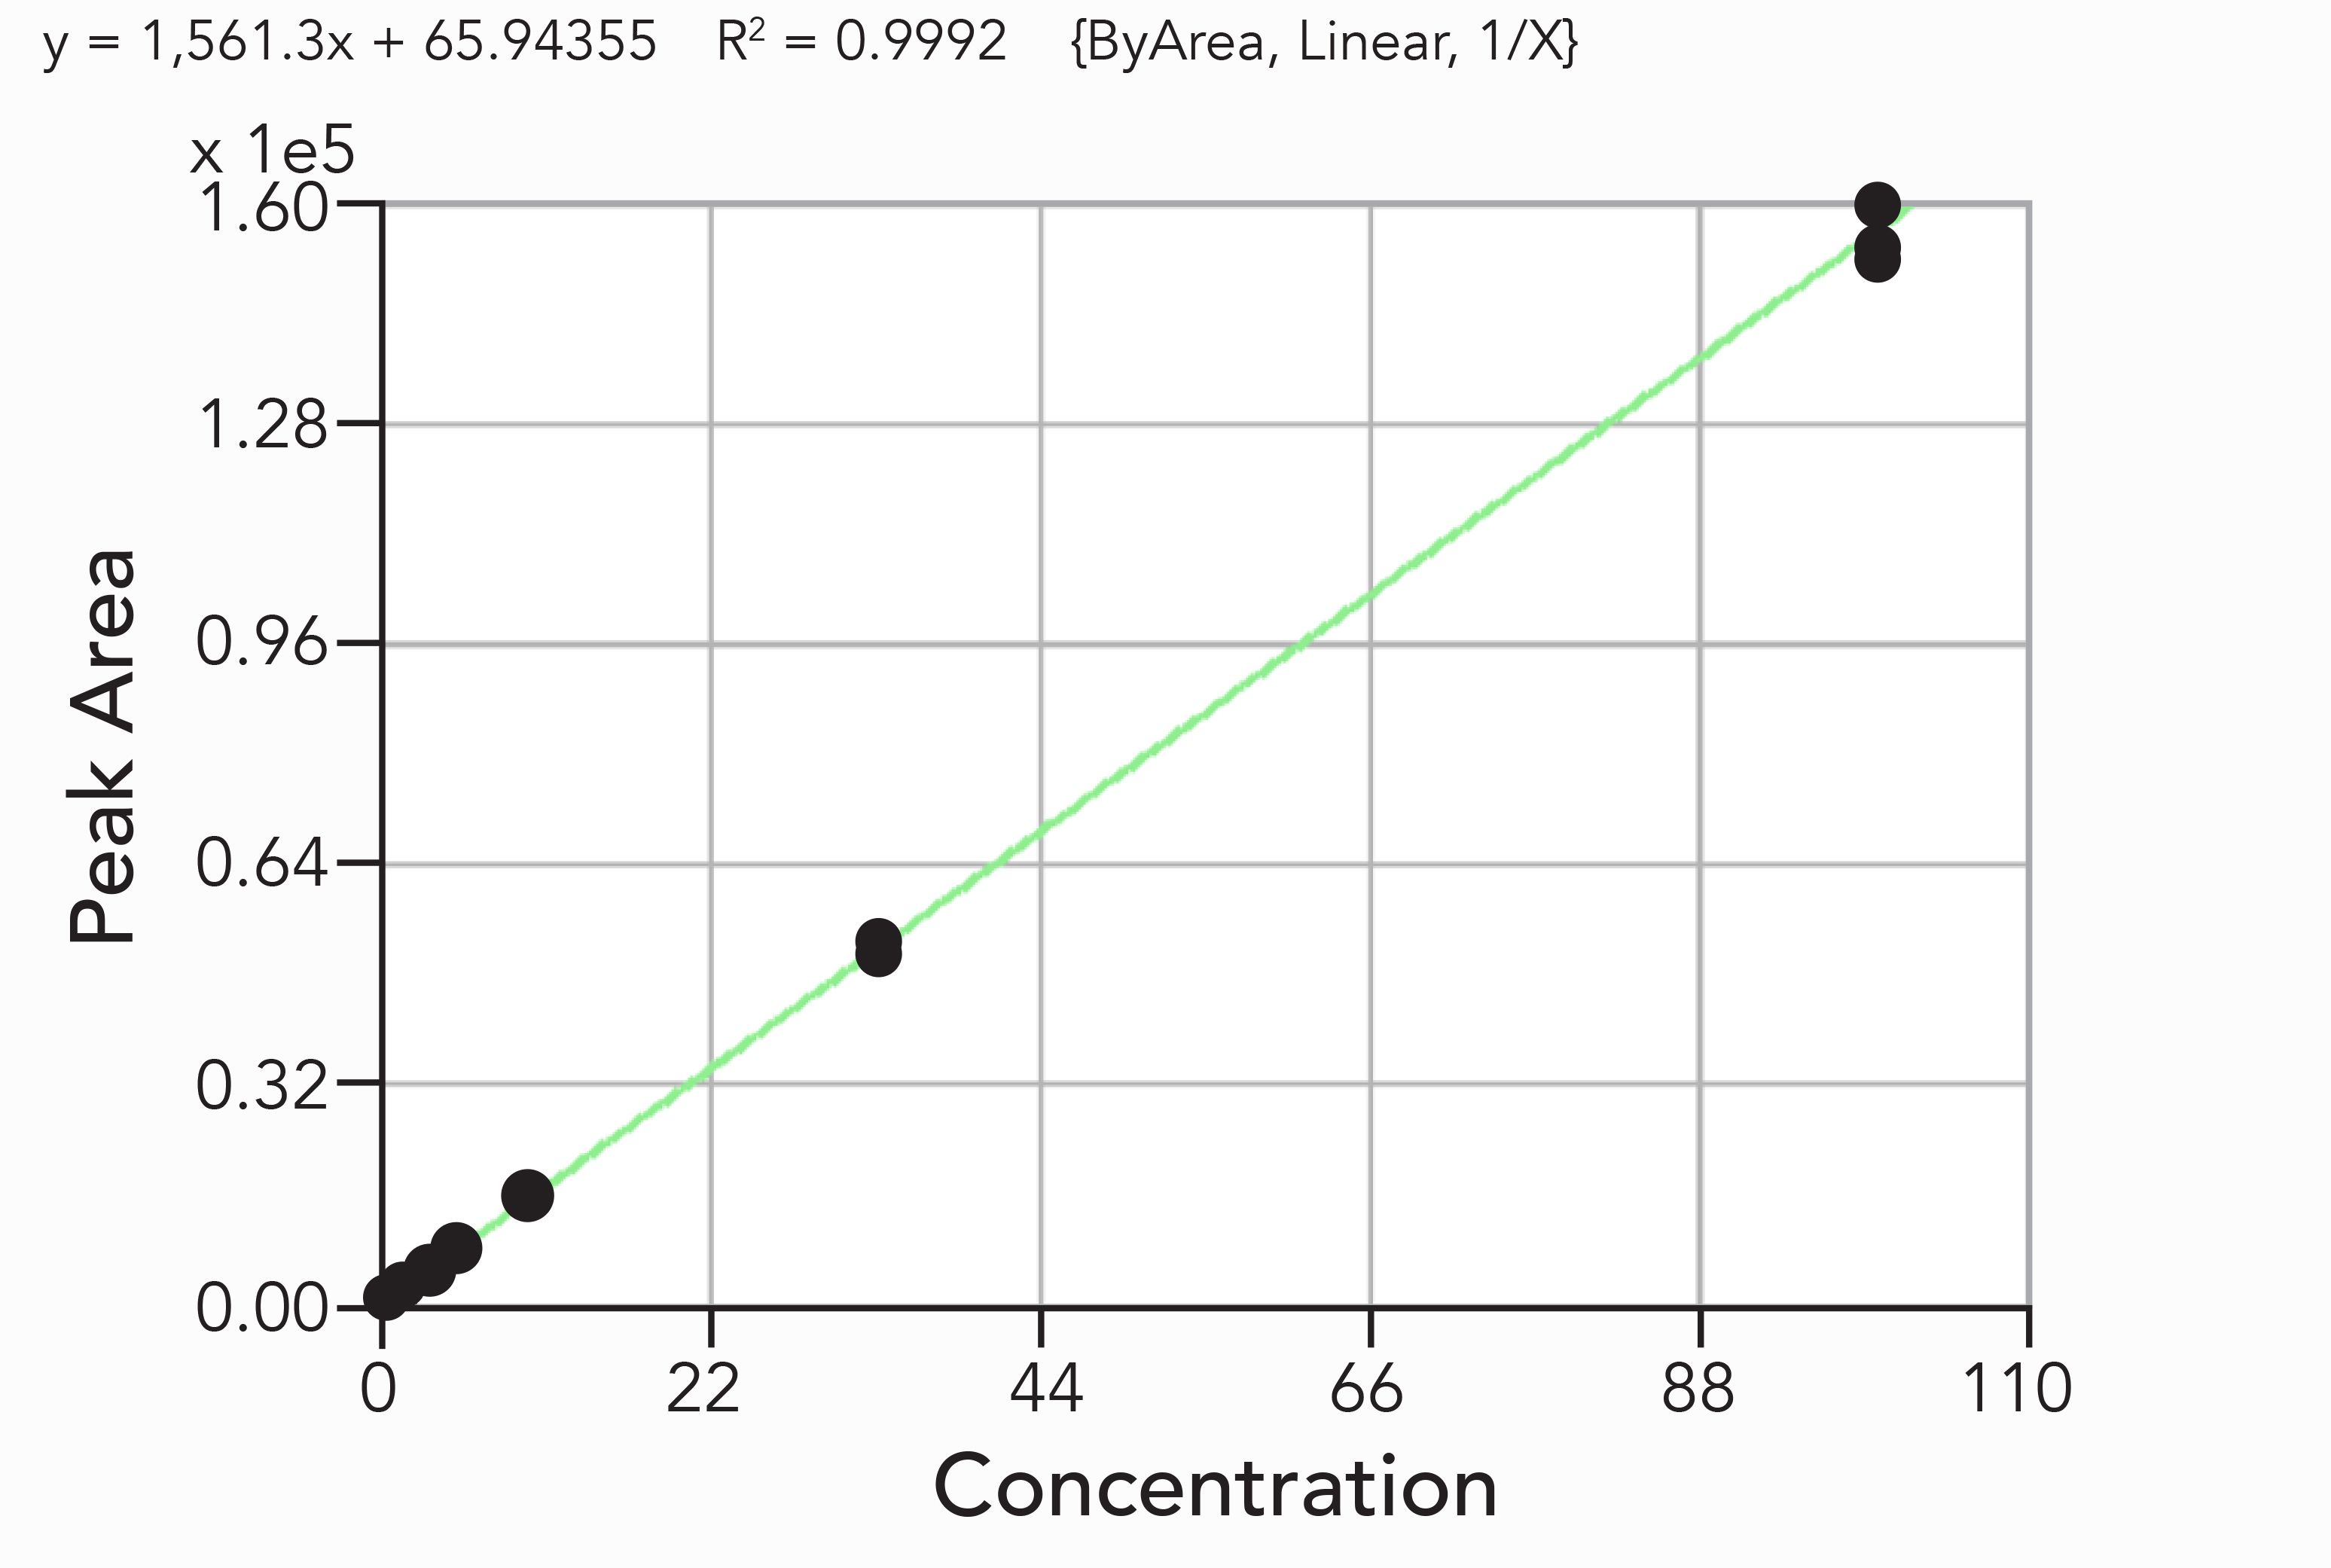
Based on the Food and Drug Administration (FDA) method validation guidelines to determine selectivity of analyses, the acceptance criteria for selectivity is that matrix blanks should be free of any matrix interference peaks at the retention time of an analyte (14). In Figure 3b, the blank cannabis tincture matrix response for PCNB shows low background signal with random electrical noise and no matrix interference peak at the retention time of PCNB. This demonstrates that the measurement of PCNB in cannabis tincture matrix is quite selective. Similarly, the matrix blank signal for the other three pesticides measured with an APCI source showed no matrix interference peaks at the retention times of these analytes. Figure 4 shows excellent linearity of PCNB response over a concentration range of 0.5 to 100 ppb (corresponding to 15 to 3000 ppb in cannabis tincture) in 30x diluted cannabis tincture extract with an R2 = 0.9992. Since the regression fit value for PCNB is greater than 0.99, it easily meets the requirement of the California Bureau of Cannabis Control for regression fits to be higher than 0.99 (4). The accuracy of the calibration curve was checked by comparing back-calculated concentrations from a calibration curve with known concentrations of PCNB, and the strict criterion of maximum deviation of 10% was met for all concentration levels. Previously, it was claimed without any experimental data that analysis of PCNB with an LC–MS/MS method using an APCI source may not be selective and may require a quadratic calibration curve with a poor correlation coefficient (15,16). However, this experimental work demonstrates a robust APCI method that exhibits excellent sensitivity, selectivity, and linearity of PCNB analysis in a cannabis sample.
Figure 4: Linearity of PCNB response over a concentration range of 0.5-100 ppb in 30-fold diluted cannabis tincture extract. y = 1,561.3x + 65.94355; R2 = 0.9992 (ByArea, Linear 1/X).
Ionization Mechanism of PCNB with an APCI Source
For the ionization of compounds using an APCI source in negative ion mode, different ionization mechanisms such as proton abstraction, anion adduction, electron capture, and dissociative electron capture have been proposed in the past (17). It has been demonstrated that chlorinated nitrobenzene compounds can form phenoxide ions under negative APCI conditions (18). Similarly, we have previously proposed the following mechanism for ionization of PCNB with an APCI source in negative
ion mode (19).

Where M is PCNB.
Herein, the formation of [M-Cl+O]- can be attributed to the formation of a superoxide ion (O2-) by electron capture followed by its chemical reaction with PCNB. This mechanism can be explained further by analyzing mass spectra for PCNB analyzed with an APCI source, which revealed a monoisotopic peak at a nominal mass of 274 Da. The nominal monoisotopic mass of a PCNB molecule is 293 Da and the observed mass loss of 19 Da can be explained by the loss of chlorine (nominal monoisotopic mass of 35 Da) and the addition of oxygen (nominal monoisotopic mass of 16 Da) to form a negatively charged ion of PCNB. Also, experimentally observed isotope patterns of the PCNB ion matched very closely to theoretical isotope patterns of the PCNB ion with four chlorine atoms, which further hinted that the PCNB loses one chlorine atom in an APCI ion source. Low mass spectra of an APCI ion source were checked to confirm the formation of superoxide reagent ion species that could react with PCNB to ionize it. We observed that the signal for both superoxide ion (O2-) and PCNB increased by a factor of roughly 300 and 30, respectively, when the mobile phase was changed from a mixture of methanol and water with 0.1% formic acid and 2 mM ammonium formate to a mixture of methanol and water. This further demonstrated that the superoxide ion plays an important role in the ionization of PCNB in an APCI source.
Conclusions
This study demonstrates a unique, quantitative, rapid, and reliable LC–MS/MS method for the analysis of 66 pesticides and 5 mycotoxins residues in cannabis tinctures. The proposed solvent extraction method is suitable for laboratories to achieve high throughput analysis, with good overall recovery (70–120%; RSD <20%) of all pesticides and mycotoxins. This method enabled identification and quantification of all analytes at low levels (0.002 to 0.5 µg/g), which is well below the action limits set by the State of California in cannabis edible products. The method also demonstrated good precision and reproducibility. In addition, it was possible to demonstrate that analysis of four non-polar pesticides, which are normally analyzed by GC–MS/MS, could be analyzed effectively in a cannabis tincture matrix using an APCI ion source. This analysis was shown to be selective, sensitive and linear. Using this method, the ionization mechanism of PCNB was elucidated. The ability to screen and quantitate all 66 pesticides and 5 mycotoxins, including the very hydrophobic and chlorinated compounds normally analyzed on a GC–MS/MS system, makes this LC-MS/MS method a novel way to screen and quantitate pesticides and mycotoxins in cannabis tinctures with a single instrument.
References
- https://hellomd.com/blogs/articles/cannabis-tinctures-from-glycerin-to-mct-oil-which-is-best.
- A. Wise, Cann. Sci. & Tech.2(1), 20–26 (2019).
- M. Margolin, “Cannabis concentrates have a problem with pesticides,” LA Weekly, Feb 27, 2017, available from https://www.laweekly.com/cannabis-concentrates-have-a-problem-with-pesticides/.
- Bureau of Cannabis Control Text of Regulations, California code of regulations available from https://bcc.ca.gov/law_regs/cannabis_order_of_adoption.pdf.
- K.K. Stenerson and G. Oden, Cann. Sci. & Tech. 1(1), 48–53 (2018).
- J. Kowlaski, J.H. Dahl, A. Rigdon, J. Cochran, D. Laine, and G. Fagras, LCGC North Am. 35(5), 8–22 (2017).
- X. Wang, D. Mackowsky, J. Searfoss, and M. Telepchak, LCGC North Am. 34(10), 20–27 (2016).
- J.R. Moulins, M. Blais, K. Montsion, J. Tully, W. Mohan, M. Gagnon, T. McRitchie, K. Kwong, N. Snider, and D.R. Blais, J. AOAC Int. 101(6), 1948–1960 (2018).
- United States Department of Agriculture Food Safety and Inspection Service, Office of Public Health Science,” Screening for Pesticides by LC–MS/MS and GC/MS/MS,” 2018, available from https://www.fsis.usda.gov/wps/wcm/connect/499a8e9e-49bd-480a-b8b6-d1867f96c39d/CLG-PST5.pdf?MOD=AJPERES.
- D. Yaroshenko and L. Kartsova, J. Anal. Chem. 69(4), 351–358 (2014).
- L.L. Jessome and D. A. Volmer, LCGC North Am. 24(5), 498–510 (2006).
- R. King, R. Bonfiglio, C. Fernandez-Metzler, C. Miller-Stein, and T. Olah, J. Am. Soc. Mass Spectrom. 11(11), 942–950 (2000).
- A. Dalmia, E. Cudjoe, T. Astill, J. Jalali, J.P. Weisenseel, F. Qin, M. Murphy, and T. Ruthenberg, Cannabis Science and Technology 1(3), 38–50 (2018).
- “Bioanalytical Method Validation Guidance for Industry”, May 2018, available from https://www.fda.gov/files/drugs/published/Bioanalytical-Method-Validation-Guidance-for-Industry.pdf.
- M. Curtis, E. Fausett, W.A. Hale, R. Honnold, J. Westland, P.J. Stone, J.S. Hollis, and A. Macherone, Cannabis Science and Technology 2(5), 56–60, 70 (2019).
- A. Macherone, “Tackle Emerging Cannabis Regulations with Confidence,” Agilent application brief (2019) available from https://www.agilent.com/cs/library/applications/application-cannabis-hemp-pesticide-6545-1290-infinity-5994-1127en-agilent.pdf.
- C.N. McEwena and B.S Larsen, J. Am. Soc. Mass. Spectrometry 20, 1518–1521 (2009).
- I. Dzidic, D. I. Carroll, R. N. Stillwell, and E. C. Hornig, Anal. Chem. 47(8), 1308–1312 (1975).
- A. Dalmia, US patent application number 20190227041, Jan 23 2019.
Avinash Dalmia and Jacob Jalali are with PerkinElmer, in Shelton, Connecticut. Saba Hariri, Erasmus Cudjoe, and Feng Qin are with PerkinElmer, in Woodbridge, Ontario, Canada. Charles Johnson and Joey Kingstadare with Napro Research, in Sacramento, California. Direct correspondence to: avinash.dalmia@perkinelmer.com

LIBS Illuminates the Hidden Health Risks of Indoor Welding and Soldering
April 23rd 2025A new dual-spectroscopy approach reveals real-time pollution threats in indoor workspaces. Chinese researchers have pioneered the use of laser-induced breakdown spectroscopy (LIBS) and aerosol mass spectrometry to uncover and monitor harmful heavy metal and dust emissions from soldering and welding in real-time. These complementary tools offer a fast, accurate means to evaluate air quality threats in industrial and indoor environments—where people spend most of their time.
NIR Spectroscopy Explored as Sustainable Approach to Detecting Bovine Mastitis
April 23rd 2025A new study published in Applied Food Research demonstrates that near-infrared spectroscopy (NIRS) can effectively detect subclinical bovine mastitis in milk, offering a fast, non-invasive method to guide targeted antibiotic treatment and support sustainable dairy practices.
Smarter Sensors, Cleaner Earth Using AI and IoT for Pollution Monitoring
April 22nd 2025A global research team has detailed how smart sensors, artificial intelligence (AI), machine learning, and Internet of Things (IoT) technologies are transforming the detection and management of environmental pollutants. Their comprehensive review highlights how spectroscopy and sensor networks are now key tools in real-time pollution tracking.