Optimization of a High Sample Throughput Method for the Determination of Trace Nutrients in Agricultural Soil Samples Using ICP-OES
The use of fertilizers is important to increase crop yields in soils that are being used for agricultural purposes. However, in order to maximize plant growth, it is also absolutely essential to know how the crops are using the nutrients in the soil. This process is commonly referred to as a fertility management program, where many soil samples are taken over a predefined area of the land and analyzed for various components such as pH, organic matter, and trace element nutrients. This article describes how a soil testing laboratory in the midwest has developed a method to analyze up to 3500 soil samples per day for 11 trace metals, using inductively coupled plasma–optical emission spectroscopy. It will focus on the soil sampling procedure together with the sample preparation requirements for this high workload environment. The instrumental analytical procedure will be described in greater detail, particularly how the measurement protocol and sampling process are optimized to cope with such extreme..

The use of fertilizers is important to increase crop yields in soils that are being used for agricultural purposes. However, in order to maximize plant growth, it is also absolutely essential to know how the crops are using the nutrients in the soil. This process is commonly referred to as a fertility management program, where many soil samples are taken over a predefined area of the land and analyzed for various components such as pH, organic matter, and trace element nutrients. This article describes how a soil testing laboratory in the midwest has developed a method to analyze up to 3500 soil samples per day for 11 trace metals, using inductively coupled plasma–optical emission spectroscopy. It will focus on the soil sampling procedure together with the sample preparation requirements for this high workload environment. The instrumental analytical procedure will be described in greater detail, particularly how the measurement protocol and sampling process are optimized to cope with such extreme demands in sample throughput.
Ever since inductively coupled plasma–optical emission spectroscopy (ICP-OES) was first commercialized in the late 1970s, it has become the technique of choice for the analysis of soil samples in a high workload environment. Its high sample throughput capability, rapid multielement characteristics, and parts-per-billion detection limits make it well-suited for this kind of application. However, it was not until the development of instruments utilizing solid-state charge-coupled device (CCD) detectors and echelle optical systems in the mid-1990s (1,2) that the application became routine for multielement analysis. Before this development, most soil-testing labs either used fixed-channel, simultaneous ICP instrumentation if their workload was high or single-element, flame atomic absorption (flame AA) if their sample throughput requirements were less demanding. Unfortunately, traditional simultaneous instrumentation did not compensate well for unforeseen spectral matrix-based spectral interferences and also was limited in its ability to measure the background in a simultaneous manner. Flame AA was extremely slow for multielement analysis, even using multiple operators. With the maturing and refining of CCD-based ICP-OES optical technology over the past 10–12 years, the technique now offers soil analysts the ability to measure multiple emission lines in the UV and visible regions at the same time. When this is combined with rapid measurement times and simultaneous background correction, it is capable of generating data of the highest quality, even in high-throughput, spectrally challenging applications.
Agricultural Soil Samples
One of the most demanding applications for ICP-OES with regard to sample workload can be found in the testing of agricultural soils. Unlike environmental testing labs, which are concerned primarily with measuring toxic contaminants in the evaluation of solid waste (3), the agricultural community is interested mainly in the soil's elemental nutrients. This application can generate hundreds of thousands of samples per year, depending upon the agricultural land being evaluated and the number of soil samples taken.
One such soil-testing laboratory that exemplifies the extremely high-throughput sampling environment found in this application area is Mowers Soil Testing PLUS, Inc. (Toulon, Illinois), a soil-testing laboratory that offers a fertility management program to the local farmers to maximize the use of fertilizers. The objective of this program is to enhance crop yields in a cost-effective manner by reducing over-application and minimizing the chances of runoff into the surrounding areas.
Fertility Management Program
It is widely accepted that the use of fertilizers is important to increase crop yields in soils that are being used for agricultural purposes. However, to maximize plant growth, it is important to understand how the crops are using these essential nutrients in the soil. The measurement of fertilizer efficiency and how the plants are using the nutrients is commonly referred to as a fertility-management program, in which many soil samples are taken over a predefined area of the land at a time of the year when the crops are not planted.
The sampling process typically involves partitioning a farm into 1-, 2.5-, or 5-acre grids and monitoring the soil for various components, including pH, organic matter, and trace elements. From these data, the cation-exchange capacity (CEC) and % base saturation values are calculated as indicators of the soil's potential to hold plant nutrients (4). Using these values, grid maps are then correlated with highly accurate and consistent global positioning system (GPS)-generated contour maps based upon the soil type. With a typical field covering 50–100 acres, several hundred soil samples can be generated per farm. When multiple farms are being evaluated, there can be tens of thousands of samples for the testing laboratory. A typical pH-based contour and grid map of a farm in the midwest region is shown in Figure 1.
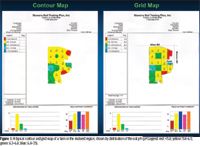
Figure 1
Elemental Nutrients
Trace element data are absolutely critical to producing meaningful CEC and % base saturation values. It is therefore generally accepted that 12 elements are essential for normal plant growth. These nutrients include phosphorus, potassium, calcium, magnesium, iron, manganese, boron, copper, zinc, sulfur, sodium, and nitrogen. With the exception of nitrogen, all of these elements can be determined with good accuracy in soils by using ICP-OES. A fertility-management program includes soil sampling, soil analysis, generation of colored field maps (shown in Figure 1), and fertilizer recommendations based upon crop yield goals determined by the client. This allows farmers to take full advantage of the fertilizer application to better understand what nutrients are in the plant root zone and, most importantly, what nutrients are still needed to maximize plant growth. Also, farmers can correctly place the proper amount of fertilizer on the appropriate area of the field, which results in increased crop yields while avoiding the excessive use of the fertilizer, thus controlling expenses and reducing runoff into the surrounding environment. A very important consideration for farmers is that to realize the full benefits of this fertility-management program, it is imperative that the cost of analysis does not outweigh the cost in savings. It is therefore very desirable that the testing laboratory has the capability to carry out high sample throughput, multi-element analysis.
Analytical Methodology
Depending upon the sample throughput requirements, agricultural soil analysis typically was performed by either traditional simultaneous ICP-OES technology or flame AA. The limitations of these two techniques have been summarized previously. An additional disadvantage of flame AA was that it struggled to determine elements like sulfur, phosphorus, and boron, so they had to be determined by using alternate techniques. Therefore, in a high workload environment, the use of AA was very time consuming and labor intensive, which translated into a higher cost of analysis for the client. On the other hand, CCD-based ICP spectroscopy provides the capability to determine the full suite of elements simultaneously with full automation, which increases the laboratory's throughput while minimizing user interaction.
Sample Collection and Preparation
The first step is to collect representative soil samples using the grid system described earlier. This is done with a soil corer, which is sunk into the ground to take a sample 7 in. below the surface — a distance that represents the level of nutrients present at the plant root level (5). Once all the necessary samples have been taken, they are transported back to the laboratory to be prepared for analysis.
Samples are received at the laboratory in bar-coded bags. The bar code identifies the samples and generates a work order from the laboratory information management system (LIMS), which specifies what tests are to be performed. Soil samples are then poured from the bags into paper "meat trays" and placed onto drying racks, as shown in Figure 2. These racks are then put into a drying oven, where fans blow heated air (100 °F) over the soils for 8–12 h.
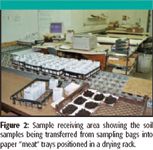
Figure 2
After drying, the samples are pulverized in a grinder to pass through a 2-mm particle size mesh screen to remove the coarser debris. The finely ground sample is then poured back into the bar-coded bag, ready to be further prepared for analysis. With such a high sample workload, the sample size is determined using a scoop instead of weighing it on a balance. The soil is scooped up, tapped three times with the spatula, and then leveled off with the same spatula (Figure 3). Even though this does not produce exactly the same weight of sample every time, it is consistent and represents a significant savings of time compared with traditional weighing. The sample is finally placed into an Erlenmeyer flask ready for extraction. For complete details of the sample collection, preparation, and extraction methodology, please refer to reference 6.
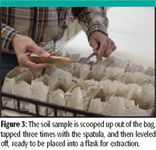
Figure 3
The extraction is performed using a standardized soil dissolution procedure with Mechlich-3 extracting solution. This procedure does not digest the soil completely, but instead simulates what is happening at the root level to determine the amount of nutrients that are available for plant uptake. The composition of Mechlich-3 is shown in Table I.
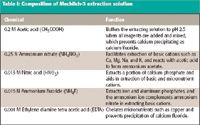
Table I: Composition of Mechlich-3 extraction solution
The reagents are added rapidly to the soil sample using a pipette stand that is connected to a vacuum system. This fills the pipettes and volumetrically dispenses 10 mL of the Mehlich-3 extraction solution to a rack of 12 Erlenmeyer flasks. Following addition of this extraction solution, the samples are shaken for 5 min. After extraction, six racks of 12 flasks are filtered at a time into custom tubes that are placed directly onto the ICP autosampler trays for analysis. The filtering apparatus known as the "Medusa" is shown in Figure 4.
ICP-OES Analytical Procedure
The autosampler trays are then placed in a high-capacity autosampler for analysis on one of their three OPTIMA DV ICP-OES systems (PerkinElmer Life and Analytical Sciences, Shelton, Connecticut). This instrument has been described in the literature (7). It utilizes a dual-view (axial and radial), thermostated echelle optical system utilizing a segmented-array, CCD design. The major benefit of this optical configuration for soil analysis is that not only can the low-UV elements (such as sulfur and phosphorus) and the visible-range elements (sodium and potassium) be determined simultaneously, but the background correction points can be measured at the same time also. This allows for faster analysis times than traditional simultaneous technology, which must measure background points separately from the analyte emission lines. An additional timesaving benefit over conventional instrumentation is that the integration time for each analyte can be optimized based upon the intensity of the analytical signal — shorter measurement times for high concentrations and longer times for low-level analytes. Another important aspect of this approach is that the sample compartment is separated from the torch box to improve the long-term stability of operation. Stability is especially important for this laboratory to obtain the necessary sample throughput, without having to continually recalibrate due to thermal drift.
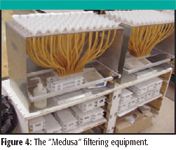
Figure 4
The instrumental and calibration conditions for this analysis are shown in Table II.
The full-loaded autosampler trays are then placed on the autosampler for analysis on the ICP system. The instrument runs continually for up to 18 h/day. With a 35-s total analysis time for each sample, this translates into approximately 3500 samples/day using the company's three instruments. To ensure that data quality objectives are met for the analysis, the autosampler trays have three locations for 50-mL tubes to accommodate the calibration blank, calibration standard, and an aqueous quality-control (QC) sample. In addition, a soil-based QC sample is interspersed with the sample tubes. The aqueous QC sample is checked every 24 samples, and the soil QC sample is checked every 36 samples. Automatic recalibration is performed if either QC sample falls outside the acceptable range of ±10%.

Table II: Instrumental and calibration conditions for the high throughput analysis of agricultural soils
With such a high sample workload of complex soil extracts, recalibration must be kept to an absolute minimum. This means that not only is it important for the spectrometer and sampling components to be thermally stable, but it is also critical for the sample introduction and plasma torch system to be optimized for maximum robustness. For this reason, the instrument was fitted with a cone-spray, high-solids nebulizer and a cyclonic spray chamber to be able to aspirate the sample and rapidly wash out the high concentration of matrix components found in soil extracts. This design also allows the injector to be replaced quickly for cleaning, without removing the entire plasma torch, thereby minimizing the downtime for periodic maintenance. This becomes very important because the injector and pump tubing are changed daily in order to maximize instrument up-time. The sample introduction system and removable torch and sample injector are shown in Figure 5.
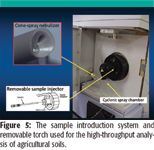
Figure 5
Conclusion
By streamlining conventional sample preparation methods and using optimized measurement protocols and sample introduction techniques, extremely high throughput soil analysis can be achieved by ICP-OES and still meet the required data quality objectives.
Acknowledgment
The authors would like to thank Mowers Soil Testing PLUS, Inc. for sharing their methodology and providing invaluable assistance in writing this article.
Cynthia P. Bosnak is a Senior Product Specialist for PerkinElmer LAS, based in Oakbrook, Illinois. Dennis Yates is Product Manager for the ICP-OES and ICP-MS product lines at PerkinElmer LAS, Shelton, Connecticut. Robert Thomas is principle of Scientific Solutions, a consulting company based in Gaithersburg, Maryland, serving the freelance writing needs of the scientific community
References
(1) T. Barnard, M. Crockett, J. Ivaldi, and P. Lundberg, Anal. Chem. 65(9), 1225–1230 (1993).
(2) T. Barnard, M. Crockett, J. Ivaldi, P. Lundberg, D. Yates, P. Levine, and D. Sauer, Anal. Chem. 65(9), 1231–1239 (1993).
(3) SW-846 (Update III) — Test Methods for Evaluating Solid Waste, Physical/Chemical Methods — EPA's Office of Solid of Waste (SOW) Official Compendium of Analytical and Sampling Methods (2005).
(4) D.S. Ross, Recommended Methods for Determining Soil Cation Exchange Capacity — Chapter in Recommended Soil Testing Procedures for the Northeastern United States. 2nd ed., J.T. Sims and A. Wolf., Eds. (University of Delaware Press, Newark, Delaware, 1995), pp. 62–69.
(5) P.D. Sachs, Edaphos: Dynamics of a Natural Soil System (Edaphic Press, Newbury, Vermont, 1999), pp. 152–153.
(6) Recommended Chemical Soil Test Procedures for the North Central Region, North Central Regional Research Publication No. 221 (Revised), Missouri Agricultural Experiment Station SB 1001 (Jan. 1998).
(7) C.B. Boss and K.J. Fredeen, Concepts Instrumentation and Techniques of ICP-Optical Emission Spectrometry (PerkinElmer Life and Analytical Sciences, Shelton, Connecticut, 1997), pp. 23–32.

High-Speed Laser MS for Precise, Prep-Free Environmental Particle Tracking
April 21st 2025Scientists at Oak Ridge National Laboratory have demonstrated that a fast, laser-based mass spectrometry method—LA-ICP-TOF-MS—can accurately detect and identify airborne environmental particles, including toxic metal particles like ruthenium, without the need for complex sample preparation. The work offers a breakthrough in rapid, high-resolution analysis of environmental pollutants.
Trending on Spectroscopy: The Top Content of 2024
December 30th 2024In 2024, we launched multiple content series, covered major conferences, presented two awards, and continued our monthly Analytically Speaking episodes. Below, you'll find a selection of the most popular content from Spectroscopy over the past year.