Preliminary Field Measurement of Cotton Fiber Micronaire by Portable NIR
The authors demonstrate the rapid and accurate laboratory measurement of cotton fiber micronaire trends at the cotton field with portable near infrared instrumentation.

In the U.S., the Agricultural Marketing Service (AMS) of the USDA classes cotton fiber (grades or assesses the overall fiber quality). The AMS classes U.S. cotton fiber with the Uster High Volume Instrument (HVI) (1). A key quality property measured by the HVI is cotton fiber micronaire, using an air resistance method (the cotton fiber's resistance to air flow per unit mass) (1–3). Micronaire is a function of the fiber's maturity and fineness. Although the HVI is very fast and can measure six quality parameters (including length, strength, color, trash, and length uniformity as well as micronaire), it is purely a laboratory instrument, is very expensive, and requires a tightly controlled laboratory environment. In today's global marketplace, the need exists for rapid, accurate, and precise cotton fiber measurements that can complement the HVI measurements and require less expensive instrumentation, exhibit increased flexibility and versatility, not require highly trained laboratory technicians, and perform both laboratory measurements and nonlaboratory remote (at-line or field) measurements. For cotton fiber measurements, at-line measurements are those performed in the ginning or textile manufacturing area, and field measurements are those measurements performed directly on the cotton boll in or near the cotton field.
Near-infrared (NIR) spectroscopy methods and techniques are used extensively in the areas of agriculture, fiber, and textiles (4–8). The NIR spectral region is normally designated as covering the 800–2500 nm spectral region (primarily 1100–2500 nm) (9–11). NIR spectra represent primarily combination and overtone bands of the fundamental mid-infrared bands, primarily absorbances for the CHn, NHn, and OH chemical species. A potential major growth area for NIR spectroscopy methods and techniques is the use of portable NIR instrumentation, which could result in both laboratory and nonlaboratory analyses. The NIR measurement is a secondary measurement, and it must be calibrated to a reference method (for example, HVI micronaire). Due to the complexity of the NIR spectra, chemometric mathematical modeling often is used for instrument calibration and method development, to include multiple linear regression (MLR), partial least squares (PLS), principal component analysis (PCA), and principal component regression (PCR).
The "universal" nature of laboratory NIR micronaire measurements by commercial NIR units, both benchtop and portable, was demonstrated previously on a small feasibility sample set (12). It was demonstrated that portable NIR instruments could yield rapid, precise, and accurate measurements. Although the results for the portable instruments were often not as good as those obtained for the benchtop NIR instruments (normally lower R2 values, higher residuals), they did readily demonstrate the potential for portable NIR instruments to measure cotton fiber micronaire. The results for the portable NIR instruments were not unexpected; the cotton fiber sample set was small and the portable instruments measured much smaller sampling areas compared to the benchtop units, and the use of a much larger and diverse set of cotton calibration samples should improve the portable NIR instrument's prediction capabilities.
The successful development of a portable NIR method to measure cotton fiber micronaire that could be applicable to both laboratory and nonlaboratory (field or at-line remote measurements) locations was of much interest to cotton fiber producers, breeders, ginners, and textile manufacturers. These interests and previous results led to an expanded program to determine the full potential of portable NIR instruments to measure cotton fiber micronaire in both laboratory and field locations. The first phase of the program was the determination of the capabilities of portable NIR instrumentation to rapidly, precisely, and accurately measure cotton fiber micronaire in the laboratory (13,14). A comparative evaluation established the optimal instrumental settings and conditions for the portable NIR instrument. The easy-to-use, rapid, precise, and accurate portable NIR measurement of cotton fiber micronaire in the laboratory was successfully demonstrated, with high R2 values and low residuals.
The second phase of the program is the determination of the capabilities of portable NIR instrumentation to rapidly and accurately measure cotton fiber micronaire in or near the cotton field, with emphasis on demonstrating and monitoring high-medium-low trends in micronaire as compared to the HVI micronaire results. At present, there is not a rapid, "as is," on-the-cotton-boll measurement of cotton micronaire. The accurate detection of micronaire trends (high-medium-low micronaire ranges within a lot) and "outlier" (low or high average micronaire) locations in the cotton field is of interest to the industry. The results for this phase are presented herein. Trend analysis is the ability of the NIR analyzer to monitor and predict the low micronaire–medium micronaire–high micronaire samples of each lot. Field analyses were made with the portable NIR instrument in four cotton fields on 15 varieties of cotton (>400 samples). Trend analyses (high-medium-low micronaire levels) and potential areas for improvements in the portable NIR field measurements are discussed.
Experimental
Cotton Samples: For the field evaluations, fifteen lots of upland cotton samples (field–seed cotton) were obtained from four cotton fields in Mississippi and Louisiana over two years: St. Joseph, Louisiana (two fields; year 1 and year 2); Stoneville, Mississippi (year 2); and Winnsboro, Louisiana (year 2). Between 20 and 35 samples were measured with the portable NIR analyzer in or near the cotton field for micronaire, with the measurement performed directly on the cotton boll; the number of cotton bolls measured depended upon the size of the individual bolls (quantity of fiber), the condition of the field and cotton bolls, and number of plants present in the field. For measurements made in the cotton field (plant measurements), three measurements were made per cotton boll (limited battery life); for measurements made near the cotton field (vehicle measurements), four measurements were made per cotton boll. A total of 409 samples were measured and the cotton bolls were then collected for each lot of cotton. The collected samples were returned to the laboratory, conditioned, the cotton fiber ("lint"; lab/lint samples) removed by hand ("hand-ginned") from the cotton seed, NIR analyses performed on the lint samples, and the reference micronaire value obtained.
The HVI-1000 unit at the Southern Regional Research Center (SRRC-ARS-USDA, New Orleans, Louisiana) was used to determine the micronaire reference values for all cotton samples. Five measurements were taken for each sample with the HVI unit. Because each cotton boll normally yielded 1.0–2.0 g of cotton lint, several samples had to be combined for HVI analyses of micronaire (9.5 g minimum required for the HVI unit). For each lot of cotton, the individual fiber boll samples within a lot were combined into three micronaire groups for that lot: a "high" micronaire group, a "medium" micronaire group, and a "low" micronaire group. The average micronaire value for the high-medium-low groups was different for each lot of cotton. For the 15 lots collected in the fields, 44 HVI samples were obtained (low-medium-high lots for all but one lot). The samples for each high-medium-low group for each lot were measured on the HVI system, and their micronaire results were compared to the NIR-predicted micronaire for each high-medium-low micronaire group for each lot. The field micronaire samples covered a wide micronaire range (2.78–5.86 micronaire units).
Portable NIR Spectrometer: The Brimrose Luminar 5030 spectrometer was used in this evaluation (Brimrose Corporation of America, Sparks, Maryland). The small NIR analyzer is portable, can be battery operated in the field, and uses an acousto-optic tunable filter (AOTF) technique to measure the sample's diffuse reflectance from 1100 to 2300 nm in 2-nm increments (15). The NIR instrument used the Brimrose SNAP software (16). A sapphire glass measurement port was used so as to press the cotton fibers into a uniform surface against the instrument's port. A macro was prepared for field operations, which included the NIR micronaire calibration, spectra storage, and data storage. Using the SNAP software, each spectrum could be uploaded to a computer for further data analysis.
Data Analysis: The micronaire calibration used for these preliminary field–near field evaluations was a first derivative partial least squares (PLS) cotton fiber micronaire calibration, previously developed for cotton fiber–lint and laboratory measurements (13). The micronaire calibration was developed using the Camo Unscrambler chemometric software package (Camo, Woodbridge, New Jersey) (17), and the calibration was downloaded to the NIR unit. After discussion with cotton industry representatives, mutually agreed upon measurement and performance targets or goals ("End-State Criteria") were developed. For these initial field evaluations, the end-state criteria were as follows: correct identification of broad micronaire levels (low-medium-high relative micronaire results) for greater than 65% of the field (field–seed cotton) samples; rapid analyses (less than 5 min analysis time per sample); and a user-friendly, easy-to-use method.
Results and Discussion
Previous investigations had demonstrated the rapid, precise, and accurate measurement of cotton fiber ("lint") micronaire in a controlled environment laboratory using portable NIR instrumentation (12–14). A program was implemented to expand the NIR measurement of cotton micronaire by portable NIR instrumentation from the laboratory to a nonlaboratory location — the cotton field. This program consisted of qualitative NIR spectral analyses and quantitative NIR field evaluations to determine the feasibility of using portable NIR instruments to detect micronaire trends on cotton boll samples in or near the cotton field.
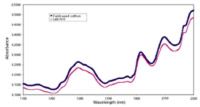
Figure 1: Typical NIR cotton fiber absorbance spectra, field and laboratory measurements, Brimrose Luminar 5030 portable NIR analyzer, 1100â2300 nm.
Qualitative NIR Spectral Analyses: Spectral analyses were performed on wide-micronaire-range cotton fiber samples, both in the laboratory and in the field, using the portable NIR analyzer. Typical cotton fiber NIR absorbance and first derivative spectra for laboratory and field measured samples are given in Figures 1 and 2. Very good NIR spectral agreement was observed between the laboratory and field measurements, with several major cotton absorption peaks and regions clearly identified in both locations. For both types of measurements, NIR spectral differences between samples with varying micronaire were observed (Figure 3). The NIR field measurements were fast (<2 min/sample) and easy to perform.
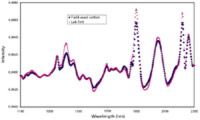
Figure 2: Typical NIR cotton fiber first derivative spectra, field and laboratory measurements, Brimrose Luminar 5030 portable NIR analyzer, 1100â2300 nm.
Field Sampling Systems: Field measurements are the spectroscopic measurement of cotton bolls for micronaire directly on the cotton boll, in or near the cotton field. In year 1, the preliminary "sampling system" consisted of placing the portable NIR unit on the sampler's back, going into the field to the cotton plant of interest, placing the NIR unit's measuring head onto the cotton boll of interest, and taking the NIR measurement ("plant measurement"). The NIR unit's LED screen indicated the number of scans completed during the analysis, and the micronaire value was shown and recorded at the end of the analysis. A backpack harness system was developed for carrying the NIR unit into the field (Figure 4). The base unit–electronics section and batteries were placed onto the backpack frame, and the backpack was fitted onto the sampler's back. This arrangement permitted the free movement and use of the measurement component–port for NIR measurements on the cotton boll. The backpack system was shown to be a feasible method for carrying the unit into the field. The portable NIR unit and sampling system were taken to a cotton field in St. Joseph, Louisiana (LA Extension Service field). Analysis productivity was approximately 20 samples per 30 min, and the NIR system's battery life was approximately 1 h.
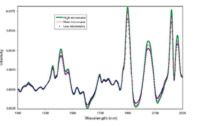
Figure 3: Typical NIR cotton fiber first derivative spectra, different micronaire levels, Brimrose Luminar 5030 portable NIR analyzer, 1100â2300 nm.
Limited battery life, operator strain (repeated bending and standing), and decreased boll sampling efficiency were observed for the plant measurement system, especially when several samples and cotton varieties were to be sampled. For future evaluations, it was agreed that a more efficient process would be to gather the cotton bolls first from the plant, take the labeled bolls to a designated location in the field (for example, the tailgate of a truck or a nearby building), and measure the samples at the designated location. In year 2, measurements were performed either in the field (plant measurement) or on the back of a vehicle in the field or at a building located next to the cotton field ("vehicle measurement") (Figure 5). The vehicle measurement increased the sampling and measurement efficiencies and the operational capabilities of the NIR unit significantly. In the vehicle measurement, the cotton bolls are collected first in the field; the bolls are taken to the vehicle or nearby building, upon which the NIR unit has been set-up for the micronaire measurements; the NIR measurements are performed; and the samples bagged and tagged for later laboratory reference micronaire analyses. Field micronaire trials with the portable NIR analyzer were performed at St. Joseph, Louisiana (LA Extension Service field); Stoneville, Mississippi (ARS field); and Winnsboro, Louisiana (LA Extension Service field). At least 20 bolls of each variety were measured.
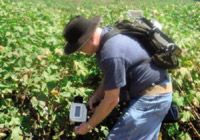
Figure 4: Plant measurements.
Field NIR Cotton Micronaire Measurements: Using the Unscrambler chemometric software, a laboratory micronaire calibration (PLS, first derivative) was developed for use in field evaluations. The NIR unit for field operations was operated remotely using battery power. A remote processing macro in the portable NIR unit yielded a sample number and micronaire result on the unit's display, and stored the spectral information and results for uploading to a computer for further data analysis.
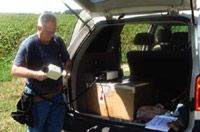
Figure 5: Vehicle measurements.
As mentioned previously, the lint samples (normally 1.0–2.0 g) of each lot had to be combined for HVI micronaire analyses (9.5 g minimum of fiber). A total of 44 HVI samples were obtained (low-medium-high lots for all but one variety) for the 15 lots collected in the fields. The combined high-medium-low samples were measured on the HVI, and their micronaire results were compared to the NIR prediction results (average of the NIR prediction results [high-medium- low] for the individual lint bolls combined to form the high-medium-low HVI samples). The preliminary NIR-HVI micronaire results for the seed cottons measured on the boll in the field (field–seed cotton component) were very encouraging, as shown for 12 of the varieties in Figure 6. Figure 6 represents the NIR-predicted micronaire values for the high-medium-low samples of the lots displayed, with the NIR correctly detecting the low-medium-high lot trend for the displayed samples. For all 15 lots, the trends in the HVI micronaire (low-medium-high) were correctly identified for over 80% of the HVI samples. All NIR measurements were made in nonstandard conditions (temperature, relative humidity, moisture, and so forth) and on seed cotton (fiber–lint still attached to the cotton seed). When one considers that the micronaire calibration used for the field–near field NIR measurements was developed for laboratory conditions and fiber–lint micronaire analyses, the degree of NIR–HVI method agreement on micronaire trends (high-medium-low micronaire) was indeed very encouraging.

Figure 6: NIR micronaire, fieldâseed cotton samples combined for HVI micronaire analyses.
In addition to the field measurements (field–seed cotton), the individual hand- ginned lint bolls (>400) were measured on the portable NIR unit before being combined. Thus, for the 15 varieties collected in the fields, the same 44 HVI samples used for the field–seed cotton comparisons were used to compare the HVI micronaire results for the combined hand ginned lint samples (lab–lint component), using the same first derivative PLS calibrations used for the field–seed cotton component. The comparative results for the lint cottons measured in the laboratory (lab–lint component) were very encouraging, as the trends in the HVI micronaire (low-medium-high) were correctly identified for 80% of the HVI samples.
The spread or variability in the agreement between the NIR predicted micronaire and the HVI measured micronaire for the 44 combined samples was much lower for the lab–lint samples compared to the field–seed cotton samples. Thus, most of these impacts were minimized when the lint from the same samples was measured in a laboratory environment. The higher spread or variability for the field–seed cotton samples compared to the lab–lint samples was not unexpected, as the field–seed cotton results were impacted by the environmental field (nonlaboratory) conditions (temperature, relative humidity, weather conditions, and so forth). However, it is important to note that, even with these field impacts, the rapid and accurate measurement cotton fiber micronaire trends (low-medium-high) "as is" in situ, directly on the cotton boll in or near the cotton field, with a portable NIR method was demonstrated successfully. The need exists for improved chemometric models for field measurements to achieve improved NIR–HVI method agreement for field analyses. Programs are underway to improve the NIR calibrations for field analyses, to include the addition of field samples into the calibration set and the use of advanced chemometric models.
Conclusions
A program was initiated to determine the capability of a portable NIR instrument to monitor the key cotton fiber property of micronaire in nonlaboratory (remote) locations, with initial emphasis on the cotton field. Portable NIR field evaluations were made at four cotton fields on 15 lot of cotton. Very good NIR spectral agreement was observed between the laboratory and field measurements, with several major cotton absorption peaks and regions clearly identified in both locations. Two field sampling systems were developed: plant measurements in which the portable NIR instrument is taken into the cotton field and NIR measurements were taken directly on the cotton plant, and vehicle measurements in which the cotton bolls were first collected and then measured with the portable NIR instrument either at the vehicle or a nearby building. Distinct micronaire differences were detected between cotton varieties and bolls with known micronaire differences. All end-state criteria were met, correct identification of broad micronaire levels (low-medium-high relative micronaire results) were observed for ≥80% of the field–seed cotton and lab–lint samples, the per sample analysis time was less than 2 min, the NIR instrument was user-friendly, and the method was simple to perform. The rapid and accurate cotton field measurement of cotton fiber micronaire with portable NIR instrumentation was demonstrated.
Acknowledgments
The authors wish to acknowledge Ms. Jeannine Moraitis, Ms. Sarah Lillis, and Ms. Clare Kappel of SRRC-ARS-USDA for their outstanding work in performing the analyses. Ms. Lynda Tankersley of Brimrose Corporation is acknowledged for her support with the Brimrose analyzer and software.
Disclaimer
The use of a company or product name is solely for the purpose of providing specific information and does not imply approval or recommendation by the United States Department of Agriculture to the exclusion of others.
James Rodgers is with the Southern Regional Research Center, Agricultural Research Service, USDA, New Orleans, Louisiana; Sho Yeung Kang is with the University of Georgia, Athens, Georgia; Chanel Fortier, Xiaoliang Cui, and Gayle Davidonis are with the Southern Regional Research Center, Agricultural Research Service, USDA, New Orleans, Louisiana; Ernest Clawson is with Louisiana State University Agriculture Center, St. Joseph, Louisiana; Don Boquet is with Louisiana State University Agriculture Center, Winnsboro, Louisiana; and William Pettigrew is with the Agricultural Research Service, USDA, Stoneville, Mississippi.
References
(1) USDA AMS Cotton Program Brochure, "The Classification of Cotton," April 2001.
(2) USDA AMS Cotton Program Brochure, "Cotton Classification, Understanding the Data," April 2005.
(3) P. Wakelyn et al., Cotton Fiber Chemistry and Technology (CRC Press, Boca Raton, Florida, 2007), pp. 107–109.
(4) J. Montalvo and T. Von Hoven, Near-Infrared Spectroscopy in Agriculture, C. Roberts, J. Workman, and J. Reeves, Eds. (American Society of Agronomy, Agronomy Monograph No. 44, 6, Madison, Wisconsin, 2004), pp. 671–728.
(5) J. Rodgers and S. Ghosh, Handbook of Near-Infrared Analysis, 3rd ed., D. Burns and E. Ciurczak, Eds. (CRC Press, Boca Raton, Florida, 2008), pp. 485–520.
(6) J. Rodgers, An Overview of Textile Applications of NIR Technology: Quantitative Applications, Book of Papers of the AATCC National NIR Technology Symposium, pp. 29 (1996).
(7) W. Tincher and A. Luk, Textile Chemist Colorist 17(10), 25–29 (1985).
(8) J. Rodgers and K. Beck, Textile Res. J. 79(8), 675–686 (2009).
(9) D. Burns, Modern Near Infrared Reflectance Analysis (ACS Short Course, New Orleans, Louisiana, 1985).
(10) H. Perkampus, Encyclopedia of Spectroscopy (VCH, New York, 1993), pp. 387–388.
(11) E. Ciurczak, Handbook of Near-Infrared Analysis, Ch. 2, 2d ed., D. Burns and E. Ciurczak, Eds. (Marcel Dekker, New York, 2001), pp. 7–18.
(12) J. Rodgers, J. Montalvo, G. Davidonis, and D. Thibodeaux, "Analyses of Key Cotton Properties by Portable NIR Analyzers," American Association of Textile Chemists and Colorists (AATCC) International Conference and Exhibition (poster), Greenville, SC, October 2006.
(13). J. Rodgers, G. Davidonis, V. Martin, and M. Watson, "Preliminary Evaluations of Micronaire Measurements by Near Infrared (NIR) Spectroscopy for Field Applications," Proceedings of the 2008 National Cotton Council Beltwide Cotton Conference, 1441–1446 (2008).
(14) J. Rodgers, S. Y. Kang, G. Davidonis, and X. Cui, "Rapid Cotton Fiber Micronaire Measurements with Near Infrared (NIR) Spectroscopy — From the Laboratory to the Cotton Field," International Conference on Sustainable Textiles, Wuxi, China, October 2008.
(15) User's Manual, Luminar Model 5030, Brimrose Corporation of America, Baltimore, Maryland, 2007.
(16) Software User's Manual, Snap 32!TM , Brimrose Corporation of Amercia, Baltimore, Maryland, 2007.
(17) Camo Software AS, The Unscrambler, Version 9.7, 2008.
Portable and Wearable Spectrometers in Our Future
December 3rd 2024The following is a summary of selected articles published recently in Spectroscopy on the subject of handheld, portable, and wearable spectrometers representing a variety of analytical techniques and applications. Here we take a closer look at the ever shrinking world of spectroscopy devices and how they are used. As spectrometers progress from bulky lab instruments to compact, portable, and even wearable devices, the future of spectroscopy is transforming dramatically. These advancements enable real-time, on-site analysis across diverse industries, from healthcare to environmental monitoring. This summary article explores cutting-edge developments in miniaturized spectrometers and their expanding range of practical applications.
Q&A: Portable FT-IR Empowers On-Site Food Quality Assurance
February 1st 2024Exploring the transformative capabilities of handheld Fourier transform infrared (FT-IR) spectrometers, Luis Rodriguez-Saona of The Ohio State University emphasizes their pivotal role in ensuring food integrity and safety across the entire supply chain.
Portable Raman Spectrometers: How Small Can They Get?
June 1st 2023There is a growing desire among spectroscopists for having instruments small enough to be taken to the sample, as opposed to bringing the sample to the instrument. The result is that Raman spectrometers are becoming more miniaturized. Because these instruments come at a lower cost and offer distinct advantages over traditional spectrometers, the expectation is that a rapid expansion of when these instruments are applied will come forthwith. We offer a preview of how future miniaturized Raman spectrometers might look.