Process Analytical Technology (PAT) Model Lifecycle Management
Many applications of process analytical technologies (PAT) use spectroscopic measurements that are based on prediction models. The accuracy of the models can be affected by a number of factors such as aging equipment, slight changes in the active pharmaceutical ingredient (API) or excipients, or previously unidentified process variations. Because models are living documents and must reflect the changes in the process to remain accurate, the models need to be updated and managed. This summary describes how one major pharmaceutical company approaches the challenges of managing these models.
Vertex Pharmaceuticals, founded in 1989 in Boston, Massachusetts, has pioneered the application of continuous manufacturing, which requires system integration, engineering of materials transfers, real-time data collection, and rapid turnaround of the manufacturing rig or system. The philosophy for development and manufacturing at Vertex includes four key concepts: quality by design (QbD), continuous manufacturing, process analytical technologies (PAT), and real-time release testing (RTRT). An important aspect of this philosophy is that the PAT models that are developed and used require maintenance, just like any other component of a system. Using the example of the drug Trikafta, which is marketed in a triple-active oral solid dosage form, we describe and illustrate here how Vertex takes on the task of model development and maintenance.
Process Analytical Technology (PAT)
PAT is an integral part of the continuous manufacturing environment. It is a system for designing, analyzing, and controlling manufacturing through timely measurements of critical quality and performance attributes of raw and in-process materials with the goal of ensuring final product quality.
PAT systems have a number of components, all of which must interact to ensure quality products. The requirements of this system are:
- Continuous improvement and knowledge management, which requires continuous learning through data collection and analysis. The data generated are available to scientifically justify post-approval process changes.
- Process monitoring and in-process controls that show consistent or improved product quality, increased yields, and reduced rejects and scrap, and that enhance the effectiveness of investigations.
- Real-time release testing that reduces the production cycle time and inventory and also lowers laboratory costs while increasing the assurance of batch quality.
In this process, as implemented for Trikafta, production includes intragranular blending, dry granulation, milling, extragranular blending, tableting, and coating. During the process, analysis tools such as loss-in-weight feeders, near-infrared (NIR) final blend analysis, laser diffraction particle size analysis, and weight/thickness/hardness, are key.
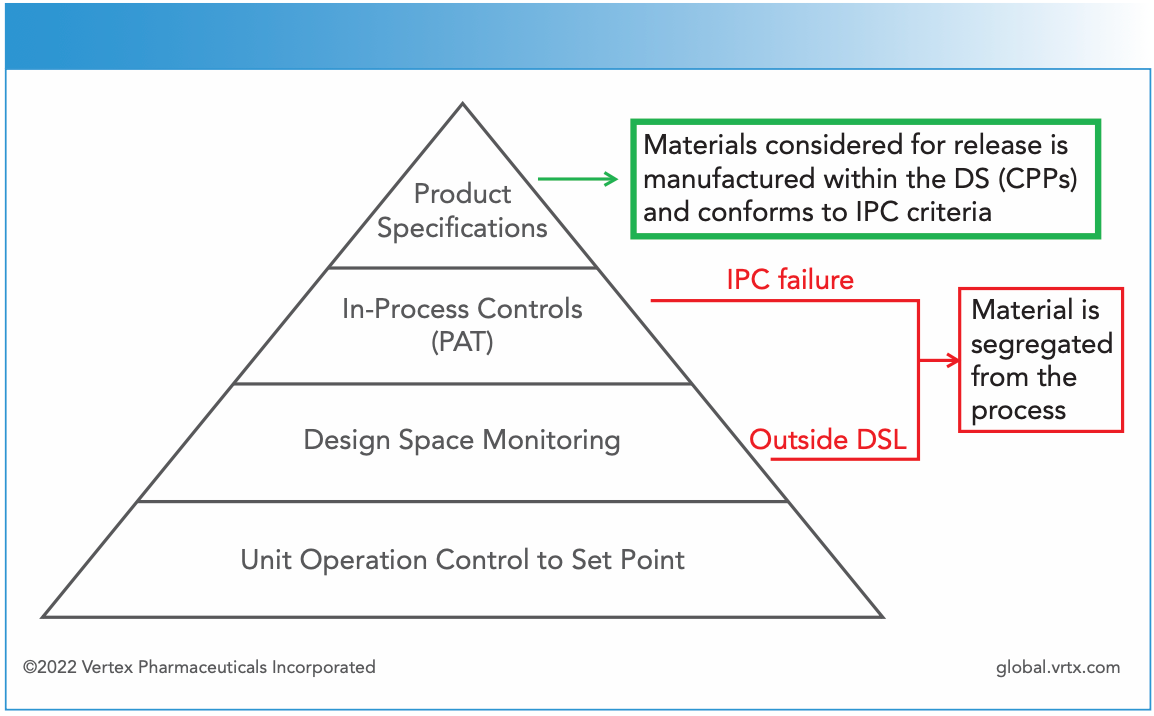
Figure 1 shows the building blocks of the PAT implementation used at Vertex.
Figure 1: The building blocks of a process control implementation strategy. Note the following acronyms: Process analytical technology (PAT); design space (DS); critical process parameters (CPPs); in-process control (IPC); and design space limits (DSL).

In this process, NIR spectroscopy is used to measure the potency of the three active pharmaceutical ingredients (APIs). The analysis is performed on the final blend powder and there are nine chemometric models in the implementation. For each API, there is a partial least squares (PLS) model and then there are linear discriminant analysis models to classify each API as typical, exceeding low typical, or exceeding high typical.
In this strategy, NIR spectroscopy is part of the in-process controls (IPC) for final blend potency. The loss-in-weight (LIW) feeders provide a final blend potency range of 90 to 110% and within that, the NIR models are used for typical potency limits, which are 95 to 105%. This 95 to 105% limit provides a warning limit that the product is outside the typical final blend potency and if the LIW potency shows that the product is out of specifications then it is segregated from the process. These two potency calculations go hand in hand to ensure consistency and quality. These models are key.
Model Lifecycle
A number of agencies, including the U.S. Food and Drug Administration (FDA), the International Council for Harmonization (ICH) of Technical Requirements for Pharmaceuticals for Human Use, the European Medicines Agency (EMA), and the U.S. Pharmacopeia (USP) all have similar documents that provide guidance for developing, using, and maintaining PAT models.
The regulatory agencies recognizes that NIR models will need to be updated and that the applying company needs to take into account how the updates will be managed, how the lifecycle is evaluated and supervised, and how changes in processes, composition, or site of manufacture all would require model updates. The challenge then becomes how to plan and carry out updates in the most efficient manner.
There are a number of known sources of variability that could impact NIR model performance. Loosely, they can be categorized as variability in:
- the process
- the environment
- composition
- raw materials
- the sample interface
- the NIR analyzer.
These six categories can define the known sources of variability, and using a statistically designed experimental approach the impacts on the models can be accounted for. However, in any analytical problem, there are unknowns that will also impact the process. These unknown sources of variability are the reason for model recalibration and validation.
Models need to be robust enough to limit the update frequency because frequent updates take time and effort. It is estimated that a typical model update can take up to two months. Updates can be scheduled as the production department brings new suppliers or sites online. In addition, model updates can be incorporated into the production schedule, but all stakeholders must be cognizant of the need to perform model updates because of the time and effort involved.
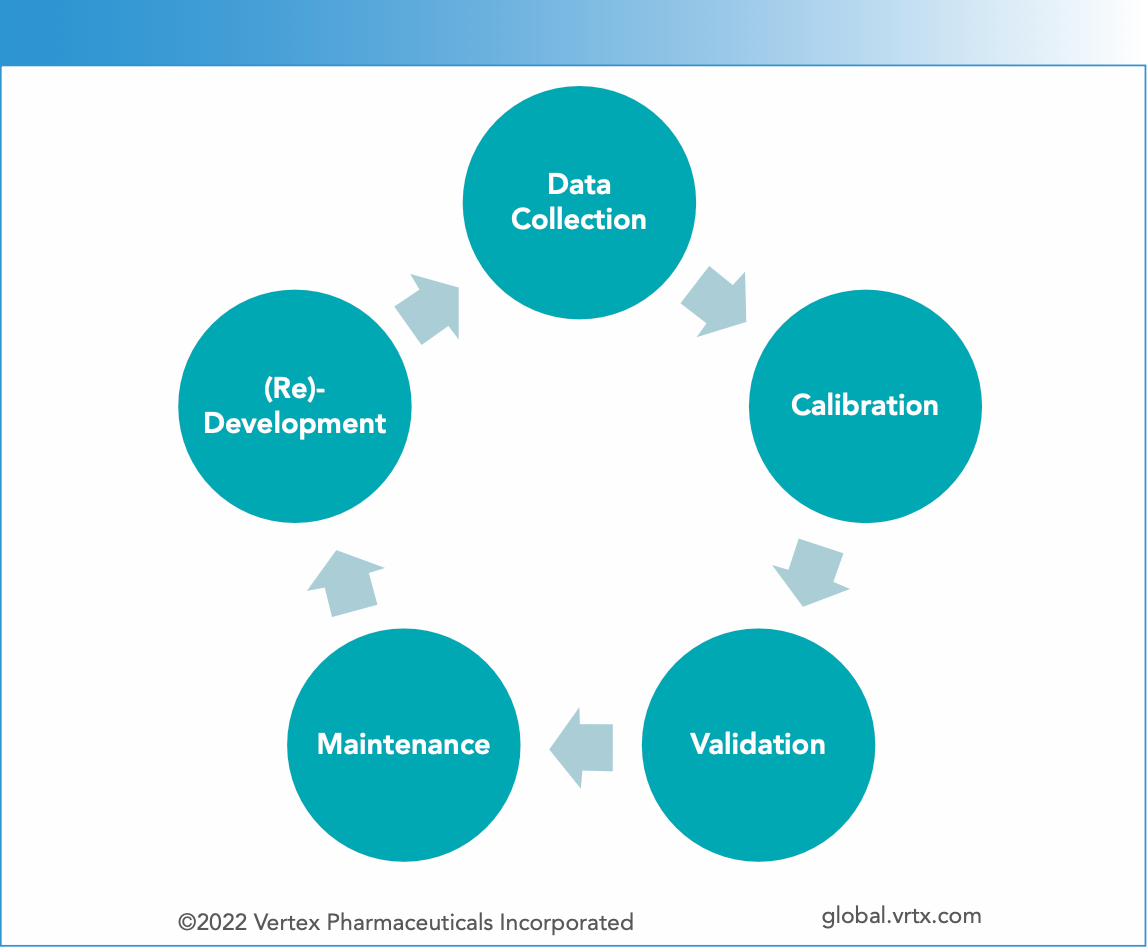
Any model used in these PAT applications has five interrelated components, as shown in Figure 2. The five components to the lifecycle of a PAT model are data collection, calibration, validation, maintenance, and redevelopment.
Figure 2: Steps involved in PAT model development and maintenance.

Data Collection
In PAT, data collection is based on the principles of QbD: experiments are defined in unit operations using QbD, and QbD principles are also employed in integrated line experiments. Process models as well as criticality points are included. The model development approach incorporates all the variables including:
- APIs
- excipients
- multiple lots
- process variations
- blend variations
- sampling, both inline and offline.
These are expected variables, but it is also recognized that there are unexpected sources of variability that cannot be initially taken into account.
Calibration
In the calibration step, a number of factors are investigated. These include both pre-processing and what type of model should be used. In the Trikafta example, NIR is used for final blend potency, and the data undergo three pretreatment steps, with each step narrowing the spectral range of interest. The first, smoothing, operates on the entire spectrum (1100–2200 nm); the second preprocessing step, the standard normal variate (SNV) step, is applied to the 1200–2100 nm range; the final pretreatment, a mean centering, brings us to the prediction ranges of the model, 1245–1415 nm and 1480–1970 nm.
For each API, the model, which is a PLS–linear discriminant analysis (PLS-LDA) qualitative model, classifies the target in the typical range (95–105%), exceeding low (<94.5%), or exceeding high (>105%). The optimal model will correctly categorize with no false negatives and few false positives.
Validation
After development of the model, it is validated in a number of ways. First, a challenge set of official samples that are not used in the model and have been subject to laboratory analysis are used.
They include samples with classifications of typical, low, and high. The model must classify them correctly to pass this validation challenge. Then, two other sets are also used for secondary validation. The first step of this secondary validation set is to challenge the model with hundreds of samples of a wider range, analyzed by high performance liquid chromatography (HPLC). Finally, all the prior production data are used to challenge the model; currently, this challenge set contains tens of thousands of spectra. Also included in this final data set is lot and batch variability to ensure robustness of the model and to capture maximum variability.
Maintenance
After the validation, the model is documented and installed and then enters the maintenance phase. Deployed models are monitored as part of continuous process verification. During each NIR run, the results from the PLS-LDA are shown in real time. Diagnostics for each batch are produced, which include run time results for all the analyses and trending reports on the batch. Another tool used in this phase is an annual parallel testing challenge. Non-standard sampling is also done, and finally, an annual product review report is produced. Deployed models are continuously monitored to understand the health of the model.
In the diagnostics, the spectrum is examined and two statistics are produced, one representing a lack of fit to the model and the other showing a measure of the variation in the sample from the center score. If either of these diagnostics exceeds the threshold, the result is suppressed and the system alarms to inform the operator that something is wrong.
Redevelopment
The performance of the models is continuously monitored. When the model does not perform appropriately, such as when trends indicating poor operation are seen, a determination is made about whether an update to the model is necessary. The model can be updated using either ongoing data or historical data. In the redevelopment phase, the same steps as initially done are implemented, and the model goes through an extensive validation testing and peer review. Some of the types of changes that could be implemented at this point are adding new samples to capture more variability, varying the spectral range, or changing the spectra preprocessing, all of which may require notifying the appropriate regulatory agency. Changes in the model that involve the algorithm or technology require prior approval of the appropriate regulatory agency. Generally, those changes are only made if they show a significant improvement over the existing method.
A large toolset is necessary to continue model development and evaluations. The tools include detailed documentation of the contents of the electronic laboratory notebook (ELN), access to historical and current data, process information, and information on incoming raw materials—including APIs and excipients. The models are highly documented, which allows for other analysts to take ownership of models as it becomes necessary.
Internal applications that can extract data from both current and historical data sets are available and include access to process data, spectra, and process results. These tools also allow evaluation against different versions of the model as necessary. Finally, the tools also have data mining and documentation components.
Examples
In a first example, we identified a new source of variance. The model had been installed and during trial runs, false positives were observed, but HPLC analysis indicated that the samples were within specification. Evaluations indicated that there was not a large enough variation in the calibration sets used to generate the model. Samples representing the additional variability were added and the wavelength range was adjusted. The redevelopment, validation, and implementation required five weeks.
A second example occurred as the models were transferred to a contract manufacturer. The original calibration had been completed on one rig and the equipment at the contract manufacturer was not represented. Samples from both manufacturing systems were included in the new model to address this.
A final example shows the robustness of appropriate models over a five-year period. In this case, the original work was completed in 2018, and the production started in mid-2019 using three model sets. Since the models were installed there have been updates to two of the models and one of the original models is still in use and performing well.
Conclusion
Chemometric models play a key role in enabling process analytical technologies in a continuous manufacturing environment. Models are managed as part of the quality management systems during all phases, including development, validation, and maintenance. The models are routinely evaluated for performance and updates are implemented based on both changes over time that may impact the model as well as on performance over time. All these processes are under change control and the model updates implemented by Vertex on this product have only required regulatory agencies be notified post-update.
About the Author
Larry McDermott is a Process Analytics and Control Scientific Fellow at Vertex Pharmaceuticals, in Boston, Masssachusetts. Direct correspondence to: larry_mcdermott@vrtx.com
Real-Time Battery Health Tracking Using Fiber-Optic Sensors
April 9th 2025A new study by researchers from Palo Alto Research Center (PARC, a Xerox Company) and LG Chem Power presents a novel method for real-time battery monitoring using embedded fiber-optic sensors. This approach enhances state-of-charge (SOC) and state-of-health (SOH) estimations, potentially improving the efficiency and lifespan of lithium-ion batteries in electric vehicles (xEVs).
