Purity Analysis of Adulterated Essential Oils by FT-IR Spectroscopy and Partial-Least-Squares Regression
Special Issues
This study reported a combined use of ordinary Fourier transform-infrared spectroscopy (FT-IR) in conjunction with partial-least-square (PLS) multivariate regression for accurate determination of the percent compositions of four essential oils (EOs) (wintergreen, tea tree, rosemary, and lemon eucalyptus oils) that were adulterated either with lemongrass essential oil (LO) or peppermint essential oil (PO). The FT-IR spectra of the calibration sample sets of known compositions of adulterated EOs with LO or PO were measured and subjected to PLS multivariate regression analysis. The simplicity, low-cost, and high accuracy of the protocol makes it appealing for routine industrial quality assurance of consumable goods.
This study reports a combined use of ordinary Fourier transform infrared spectroscopy (FT-IR) in conjunction with partial-least-squares (PLS) multivariate regression for accurate determination of the percent compositions of four essential oils (EOs) (wintergreen, tea tree, rosemary, and lemon eucalyptus oils) that were adulterated either with lemongrass essential oil or peppermint essential oil. The FT-IR spectra of the calibration sample sets of known compositions of adulterated EOs with lemongrass oil or peppermint oil were measured and subjected to PLS multivariate regression analysis. The simplicity, low cost, and high accuracy of the protocol makes it appealing for routine industrial quality assurance of consumable goods.
The market for essential oils (EOs) was approximately $5.5 billion in 2014 and is projected to reach $11.6 billion by the year 2022 (1). High therapeutic properties and market values of EOs (2–8) make them ideal candidates for potential counterfeiting or adulteration with low quality, cheap oils by unscrupulous traffickers, cartel members, or individuals for financial gain. Unsuspecting consumers often inadvertently purchase substandard, adulterated, or counterfeited consumable goods with reduced therapeutic effects (2–8). The sales of substandard, adulterated, or counterfeited EOs also have negative economic implications for the EO producers and marketers as well as potential health issues for unsuspecting customers. For instance, the use of adulterated EOs in cosmetics, therapeutics, or food may result in skin irritation and other related health issues (7). Frankly, the sale of substandard consumable goods and the associated negative health impact on consumers and the economic loss for the industry has become a global issue and a high-priority challenge in recent years (2–8).
Abating the sale of substandard, adulterated, and counterfeited consumer products can only be achieved through concerted efforts and strong collaborations between the major stakeholders, including the food industries, marketers, and government, regulatory, and enforcement agencies. The development of a low-cost analytical protocol that is capable of rapid, accurate analysis of the authenticity of adulterated and counterfeited consumable goods therefore continues to be an active research area of a considerable interest to major shareholders both for economic reasons and to protect the safety and well-being of consumers. Toward this effort, regulatory agencies such as the United States Food and Drug Administration (FDA), the United States Department of Agriculture (USDA), and the World Health Organization (WHO) have been proactive in the monitoring of the quality and purity of various consumer goods to ensure adequate quality control and quality assurance (2,4).
Analytical techniques including gas chromatography (GC) (9,10), high performance liquid chromatography (HPLC) (11–14), nuclear magnetic resonance (NMR) spectroscopy (15,16), and electroanalytical techniques (17,18) have been well developed for the analysis and evaluation of the authenticity of consumable products, with excellent accuracy and precision. However, some of these protocols have inherent drawbacks including long analysis times, lack of portability, and the high cost of instrumentation that limit their utility and wide applicability for rapid and routine food analysis. In addition, some of the available protocols may require specialized training and skills, further hindering their wide usage. To address these challenges, the utility of ordinary, inexpensive, and simple analytical spectroscopic techniques such as Raman (19–22), fluorescence (23–27), near infrared (28,29), and Fourier transform infrared (FT-IR) (30–35) in conjunction with multivariate regression analysis has been explored for authentication and quality assurance of various food products. The combined use of analytical spectroscopy and multivariate regression analysis has become more appealing because it allows rapid analysis at reduced sample size with minimal to no sample preparation. Most importantly, Raman and IR spectrometers are portable, easy to use, and relatively inexpensive, allowing affordable in situ field sample analysis.
A recent study in our laboratory (30) demonstrated the capability of the combined use of FT-IR spectroscopy and PLS multivariate regression for authentication and accurate determination of purity and percent composition of adulterated natural oils (neem and flaxseed oils) with edible vegetable and extravirgin olive oils, with excellent accuracy. The current study explores the use of FT-IR spectroscopy and PLS regression for the authentication of essential oils (EOs) (wintergreen oil [WO], tea tree oil [TTO], rosemary [RO], and lemon eucalyptus oil [LEO]) adulterated with either lemongrass oil or peppermint oil. Unlike the “natural oils” in the previous study, that are primarily triacylglycerols, the investigated “essential oils” (WO, TTO, RO, and LEO) in the current study are terpenoids and belong to different chemical classes. Keeping in mind the high market values of WO, TTO, RO, and LEO, they are potential targets for adulteration and counterfeiting, necessitating the need for development of quality assurance and authentication protocols. For instance, the average market values of WO ($3.82 per ounce), TTO ($2.32 per ounce), RO ($3.54 per ounce), and LEO ($2.25 per ounce) are higher than the market values of lemongrass oil ($1.95 per ounce) and peppermint oil ($1.78 per ounce). As a result, a more expensive WO, TTO, RO, and LEO may potentially be adulterated with relatively cheaper lemongrass oil and peppermint oil. In addition to high market values, these essential oils were also selected for the study because of their various therapeutic, cosmetic, and agrochemical applications. For instance, wintergreen oil (Gaultheria procumbens) is made up of 99% methyl salicylate. Wintergreen oil has been used to treat respiratory tract infections and musculoskeletal pain, to increase endurance and respiratory capacity, as a food flavoring, and as a common component in chewing gum and toothpaste because of its minty flavor (36). Tea tree oil, the essential oil of Melaleuca alternifolia, is made up of approximately 41% terpinen-4-ol. Tea tree oil has been extensively used in traditional medicine in Australia and more recently worldwide because of its antimicrobial and anti-inflammatory activity (37). Rosemary oil (Rosmarinus officinalis L.) is composed of approximately 16% 1,8-cineole. Rosemary plants are cultivated worldwide, and the essential oil has been used for its strong antioxidant and antimicrobial activities (38–40). Rosemary plant species also have many other beneficial characteristics including antiviral, anti-inflammatory, and anticarcinogenic activity (38,41). Lemon eucalyptus oil (LEO) is a plant-based oil derived from the leaves of the Eucalyptus citrodora tree and is made up of nearly 76% citronellal. Lemon eucalyptus oil is widely used in perfumery, cleaning, cosmetics, pesticides, and room fresheners. The antibacterial, antifungal, and insecticidal activities of essential oil from Eucalyptus citriodora have been previously reported (42).
Experimental
Materials and Methods
Chemicals and Supplies
The samples of primary essential oils-WO, TTO, RO, and LEO-and adulterant essential oils, lemongrass oil and peppermint oil, were purchased from New Directions Aromatics Inc.
Sample Preparation
FT-IR Measurement, and Chemometrics PLS Multivariate Regression Analysis
All glassware used was thoroughly washed in acetone and rinsed with ultrapure water (Thermo Scientific, GenPure UV-TOC/UF). Between 40 and 50 samples of varying compositions of WO, TTO, RO, and LEO adulterated with either lemongrass oil or peppermint oil ranging from 1 to 90% (wt/wt) were prepared by carefully weighing the appropriate weights of the primary oil and the adulterant in sample vials. The samples were subsequently gently shaken and kept at room temperature for approximately 48 h to facilitate the proper mixing, equilibration, and
homogenization of the samples.
The FT-IR spectra of the samples were recorded in reflection mode using an FT-IR spectrometer (IRAffinity-1, Shimadzu Corporation). The spectrometer was equipped with a MiRacle ZnSe 3B crystal plate attenuated total reflectance (ATR) device mounted on a Shimadzu platform. The MiRacle ZnSe 3B crystal plate permits the rapid and accurate measurement of a small sample size with high sensitivity, accuracy, and reproducibility.
The FT-IR spectrum of each sample was scanned 100 times with a resolution of 4 cm-1 over a 600–4000 cm-1 wavenumber range. The FT-IR spectrometer was routinely calibrated using a polystyrene standard before each use to ensure wavelength accuracy. Spectral data analysis and PLS multivariate regression analysis was performed using Unscrambler software (CAMO Software, 9.8).
Results and Discussion
FT-IR Spectra of Adulterated WO, TTO, RO, and LEO Samples with Lemongrass and Peppermint Oil
Figure 1 shows the FT-IR spectra of the pure unadulterated WO, TTO, RO, LEO, lemongrass oil, and peppermint oil, showing the expected characteristic C-H stretch (~2900 cm-1), C=O stretch (~1700 cm-1), broad O-H stretch (~3400 cm-1), and C-O stretch (~1100 cm-1) of terpenoid components in the essential oils. The compositions and constituents of essential oils may vary and highly depend on the geochemistry of the soil where it is cultivated. In general, essential oils are made up of terpenes such as terpineol, cineole, citronellal, and others (43). The FT-IR spectra of samples containing multicomponent, aggregates, or composites of constituents are additive. Thus, the observed FT-IR spectra in Figure 1 are the resultant FT-IR spectra of the components of essential oil.
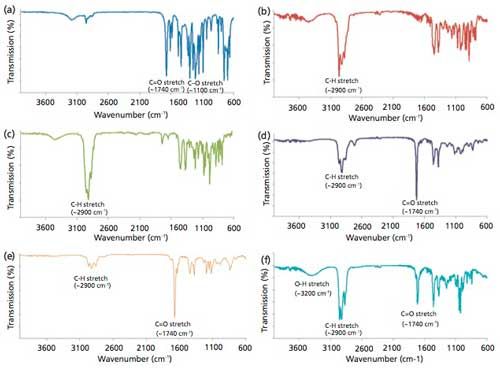
Figure 1: FT-IR spectra of pure samples of: (a) wintergreen oil (WO), (b) tea tree oil (TTO), (c) rosemary oil (RO), (d) lemon eucalyptus oil (LEO), (e) lemongrass oil (LO), and (f) peppermint oil (PO).
Figures 2a–d (left) show the FT-IR spectra of the samples with varying percent compositions of WO, TTO, RO, and LEO adulterated with lemongrass oil used for PLS multivariate regression calibration and model development. The FT-IR spectra of the samples were observed to change with percent compositions of WO, TTO, RO, and LEO in the samples adulterated with lemongrass oil. A considerable overlapping of FT-IR spectra was obtained with changes in the percent compositions of WO, TTO, RO, and LEO in the lemongrass oil adulterated samples. Figures 2a–d (right) are the cross sections of the FT-IR spectra in Figure 2a–d left. In the supplementary section on-line, Figure 1 shows the FT-IR spectra of the calibration samples of varying percent compositions of WO, TTO, RO, and LEO adulterated with peppermint oil. Once again, the FT-IR spectra of adulterated WO, TTO, RO, and LEO with peppermint oil samples vary with changes in the percent composition of WO, TTO, RO, and LEO in the adulterated samples. Figures 1a–d (right) on-line show the cross sections of the FT-IR spectra in Figures 1a–d (left) on-line. However, the observed variations and changes in FT-IR spectra of adulterated oil of the calibration samples are highly dependent on the primary essential oil and the adulterant oil used for the oil adulteration. For instance, a more prominent variation in the FT-IR spectra in O-H region was observed for adulterated LEO with peppermint oil, suggesting differences in the interaction of the primary essential oil and adulterant oils (43).
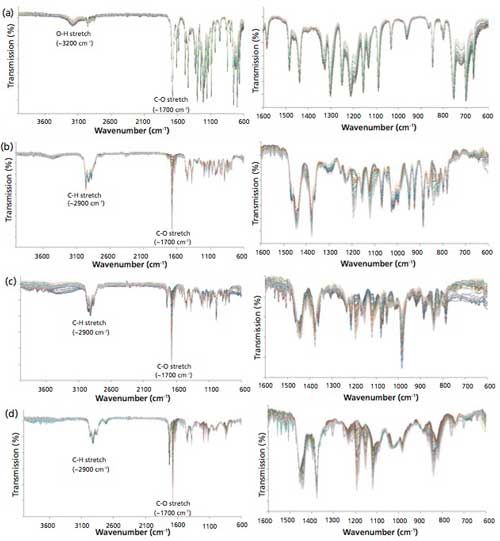
Figure 2: FT-IR spectra of calibration samples of: (a, left) WO, (b, left) TTO, (c, left) RO, and (d, left) LEO. Cross sections of FT-IR spectra of: (a, right) WO, (b, right) TTO, (c, right) RO, and (d, right) LEO adulterated with lemongrass oil. (Lemongrass oil adulteration ranged between 1% and 90% [wt/wt].)
Determination of Percent Composition of Adulterated WO, TTO, RO, and LEO with Lemongrass Oil and Peppermint Oil Multivariate PLS Regression Analysis
PLS regression analysis was used to correlate changes in FT-IR spectra data of WO, TTO, RO, and LEO adulterated with lemongrass oil (in Figure 2) or peppermint oil (Figure 1 in the supplementary section on-line) with wt/wt percent composition of WO, TTO, RO, and LEO of the adulterated samples. The advantages of multivariate regression over the use of univariate regression (analysis at one wavelength, typically at lambda max) for rapid and accurate determination of analyte concentrations of agricultural, environmental, pharmaceutical, and biomedical interest have been widely demonstrated (44–53). Compared to univariate regression calibration, the combined utility of analytical spectroscopy and multivariate regression analysis has become more appealing for various reasons including rapid analysis at reduced sample size with minimal to no sample preparation. The use of multivariate regression analysis also allows accurate determination of analyte concentrations without prior analyte extraction (45,46,53). Most importantly, multivariate regression analysis of spectral data is the best choice of sample calibration when there is spectral overlapping and spectral shifts or the presence of significant spectral interference that is often encountered in complex organic matrixes in agricultural, environmental, and biomedical samples (30,45,46,53). Several multivariate regressions including multiple linear regression (MLR), PLS regression, unfolded PLS regression with residual bilinearization (U-PLS/RBL), principal component analysis (PCA), principal component regression (PCR), nonparametric linear-regression (NPLR), successive projections algorithm-linear discriminant analysis (SPA-LDA), and parallel factor analysis (PARAFAC) have been used for rapid and accurate sample calibration and analyses of molecules of agricultural, food, pharmaceutical, environmental, medical, and biomedical interest in recent years (53). However, the use of PLS regression for sample calibration is particularly more attractive because of its capability to simultaneously incorporate the dependent variable in the data compression and decomposition operations. Consequently, both the x-variable (the FT-IR spectra data in this study) and the y-variable (the percent oil composition in this study) are actively involved in the construction of the new basis set made up of PLS components (47,48,51). In other words, the PLS regression primarily focuses on those aspects of the data that are most important in predicting y.
The first step of a PLS multivariate regression is called the calibration phase, where a PLS regression model is built with a set of samples of known concentration. However, the model is carefully optimized to select the appropriate wavelength region (x-variable) that correlates most with the y-variable. In addition, the appropriate number of PLS must be selected to eliminate overfitting of the regression model. Theoretically, n-1 number of PLS can be used to build the regression model, where n is the number of samples. The constructed model must then be validated and tested with an independently prepared test set in the validation phase to evaluate the predictive capability of the model developed in the calibration phase. The predictability of the regression models can be impacted by collinearity that is often present in the raw spectral data. Thus, the original raw spectral data must be presented in a new orthogonal variance-scaled eigenvector PLS component before model development to eliminate the collinearity problem. Representation of samples in this new orthogonal variance-scaled eigenvector or coordinate system, known as the score plot, is also advantageous because it can also be used as a data dimension reduction strategy. In general, only a few PLS components contain the most useful variability in the data set and are the most critical to represent the data in the new orthogonal variance-scaled eigenvector PLS component. Relatively higher PLS predominantly contain noise and can be disregarded. Most importantly, the score plots often reveal hidden and valuable information for pattern recognition in the data set that may not be apparent from ordinary visual examination of the original raw data set.
Figure 3 is a representation of the score plot of the first PLS component against the second PLS component of the PLS regression analysis of FT-IR spectra of TTO adulterated with lemongrass oil (Figure 3) and WO samples adulterated with peppermint oil (Figure 2 in the supplementary section on-line). In Figure 3, the first two PLS components accounted for 88% of the variability in the FT-IR spectra (x-variable) and 93% of useful information in y-variable (percent compositions of TTO) in the TTO–lemongrass oil samples contributing to the PLS regression model. Similarly, in Figure 2 in the supplementary section on-line, the first two PLS components accounted for 100% of the variability in the FT-IR spectra (x-variable) and 98% of the variability in y-variable (percent compositions of WO) in the WO–peppermint oil samples. Careful examination of the score plots revealed an interesting pattern of the adulterated samples. For instance, adulterated TTO samples with larger composition of lemongrass oil adulterant are grouped together on the left hand side of the score plot. However, adulterated TTO samples containing larger percent compositions of TTO than the lemongrass oil adulterant are grouped together on the opposite, right-hand side of the score plot. The score plot of adulterated WO with peppermint oil adulterant is also interesting and shows a similar pattern. Adulterated WO samples with larger percent composition of peppermint oil adulterant are grouped together on the left-hand side of the score plot. In contrast, adulterated WO samples containing larger percent composition of WO than the peppermint oil adulterant are grouped together on the right-hand side of the score plot. Another interesting pattern can be observed in this score plot, in which the pure WO sample with 99.9% WO is grouped alone in the lower right-hand side of the score plot. The obtained score plots of RO and LEO also show similar grouping of samples containing larger percent composition of RO and LEO in the adulterated samples. The results of the score plots are notable and can potentially be used for rapid screening and pattern recognition of the purity, authenticity, and possible adulteration of oil samples.
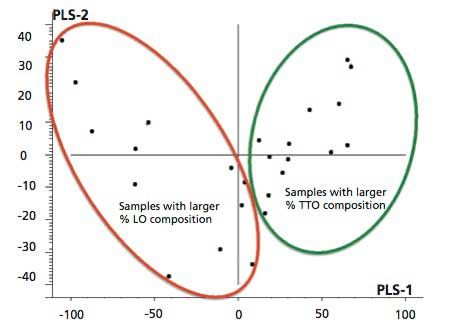
Figure 3: Typical score plot of PLS-1 regression of TTO adulterated with lemongrass oil.
Table I is a summary of the figures of merit of the PLS regression analyses of the FT-IR spectral data, including the optimum wavenumber region, the slope, the square correlation coefficient, the offset, and the limit of detection (LOD) for WO, TTO, RO, and LEO adulterated with lemongrass oil. (Table I in the supplementary section on-line shows the results with peppermint oil.) The developed PLS models have good linearity (R2 > 0.999039). A perfect model would have a slope of 1, a correlation coefficient of 1, and an offset of 0.

Although the obtained figures of merit of the PLS models were excellent, the practical utility of any regression model is the ability of the model to correctly determine the percent compositions of independently prepared adulterated oil validation samples. Figure 4 shows the FT-IR spectra of independently prepared test validation samples of WO, TTO, RO, and LEO adulterated with lemongrass oil; Figure 3 in the supplementary section on-line shows the results with peppermint oil. It must be highlighted that the percent compositions of adulterated WO, TTO, RO, and LEO in the validation samples are totally different from the percent compositions of adulterated WO, TTO, RO, and LEO in the calibration samples used for the PLS regression model development.
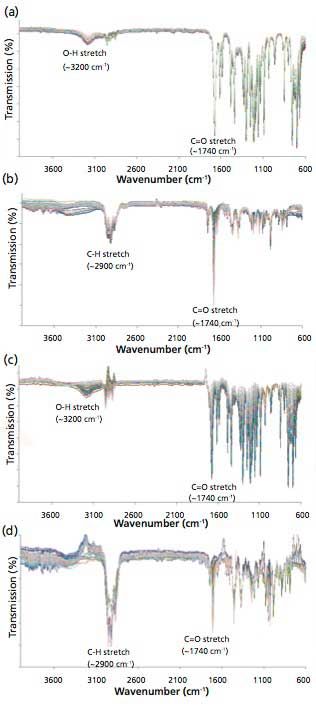
Figure 4: FT-IR spectra of independent validation samples of (a) WO, (b) TTO, (c) RO, and (d) LEO adulterated with lemongrass oil.
The results of the validation study showing the plots of the determined and actual percent composition of WO, TTO, RO, and LEO in the validation samples adulterated with lemongrass oil are shown in Figure 5. Obviously, the determined percent compositions by PLS models favorably compared with the actual percent compositions of adulterated essential oils in the validation samples. The capabilities of the PLS regression to accurately determine the percent composition of WO, TTO, RO, and LEO in the adulterated validation samples were further evaluated using a root-mean-square-relative-percent error (RMS%RE) calculation shown in equation 1:

where %REi is the percent-relative-error calculated from the known and predicted values for the ith validation sample, and n is the number of validation samples in the set. The PLS regression models correctly determined the percent compositions of independently adulterated WO, TTO, RO, and LEO with lemongrass oil with RMS%RE of determinations ranging between 0.81% and 2.42%, with an average of 1.57%. The summary of the corresponding validation study conducted for the determination of percent compositions of WO, TTO, RO, and LEO samples adulterated with peppermint oil is shown in Figure 4 in the supplementary on-line section. The validation study for independently adulterated WO, TTO, RO, and LEO with peppermint oil resulted in RMS%RE of determinations ranging between 0.92% and 3.90%, with an average of 2.36%.
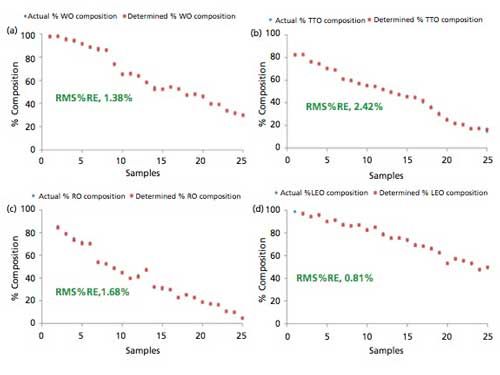
Figure 5: Plots of actual and determined percent composition of independent validation samples of (a) WO, (b) TTO, (c) RO, and (d) LEO adulterated with lemongrass oil.
Conclusion
The result of an analytical protocol that involved the combined used of FT-IR spectroscopy and multivariate PLS regression analysis for rapid and accurate determinations of percent composition of four essential oils (wintergreen oil, tea tree oil, rosemary oil, and lemon eucalyptus oil) adulterated with lemongrass oil and peppermint oil is reported. PLS multivariate regression was used to correlate changes with percent compositions of essential oils in the adulterated samples and subsequently used to predict the percent compositions of adulterated WO, TTO, RO, and LEO of the validation samples. The simplicity, low cost, and high accuracy of the protocol are attractive, with potential real-world applications for quality control and quality assurance of consumable goods in food, cosmetics, pharmaceutical, and agrochemical industries.
Acknowledgments
The financial support for Brianda Elzey from Research Initiative for Scientific Enhancement (RISE) Program through a NIGMS/NIH R25GM0706162 grant is acknowledged.
Supplementary On-Line Section
The peppermint oil results are presented in a supplementary section on-line. This on-line section includes Figures 1–4 and Table I. Please visit www.spectroscopyonline.com/node/318164 to read the supplementary section.
References
- Grand View Research, Inc., 2015 (http://www.grandviewresearch.com/industry-analysis/essential-oils-market, http://www.prnewswire.com/news-releases/essential-oil-market-size-to-reach-1167-billion-by-2022-grand-view-research-inc-531216151.html) Accessed June 4, 2016.
- European Parliament, 2014 (http://www.europarl.europa.eu/sides/getDoc.do?pubRef=-//EP//NONSGML+COMPARL+PE-519.759+02+DOC+PDF+V0//EN&language=EN Accessed June 4, 2016.
- K. Everstine, J. Spink, and S. Kennedy, J. Food Prot. 4, 560–735 (2013).
- US Food and Drug Administration, Federal Register Online74(64), 15497–15499 (2009).
- Environment, Public Health and Food Safety, 2013 (http://www.europarl.europa.eu/sides/getDoc.do?pubRef=-//EP//TEXT+REPORT+A7-2013-0434+0+DOC+XML+V0//EN) Accessed June 4, 2016.
- J. Spink and D.C. Moyer, Food Technol.67, 30–35 (2013).
- T.K.T. Do, F. Hadji-Minaglou, S. Antoniotti, and S.X. Fernandez, Trends Anal. Chem.66, 146–157 (2014).
- V. Wheatley and J. Spink, Compr. Rev. Food Sci. Food Saf.12, 599–613 (2013).
- J. Blomberg, P.J. Schoenmakers, and U.A.Th. Brinkman, J. Chromatogr. A. 972, 137–173 (2002).
- J. Maree, G. Kamatou, S. Gibbons, A. Viljoen, and S. Van Vuuren, Chemometr. Intell. Lab. 130, 172–181 (2014).
- D.S. Domingues, E.D. Pauli, J.E.M. de Abreu, F.W. Massura, V. Cristiano, M.J. Santos, and S.L. Nixdorf, Food Chemistry.146, 353–362 (2014).
- G.E. Morlock, S. Meyer, B.F. Zimmermann, and J.M. Roussell, J. Chromatogr. A.1350, 102–111 (2014).
- R. Salghi, W. Armbruster, and W. Schwack, Food Chemistry. 153, 387–392 (2014).
- S. Wang, Q. Guo, L. Wang, L. Lin, H. Shi, H. Cao, and B. Cao, Food Chemistry. 172, 669–674 (2015).
- R.O.R. Ribeiro, E.T. Marsico, C.D.S. Carneiro, M.L.G. Monteiro, C. Conte Junior, and E.F.O. de Jesus, J. Food Eng.135, 39–43 (2014).
- P.M. Santos, E.R. Pereira-Filho, and L.E. Rodriguez-Saona, Food Chemistry. 138(1), 19–24 (2013).
- I.M. Apetrei and C. Apetrei, Comput. Electron. Agr.108, 148–154 (2014).
- W. Guo, X. Zhu, Y. Liu, and H. Zhuang, J. Food Eng.97(2), 275–281 (2010).
- K. de Sa Oliveira, L. de Souza Callegaro, R. Stephani, M.R. Almeida, and L.F.C. de Oliveira, Food Chem.194, 441–446 (2016).
- S.A. Haughey, P. Galvin-King, Y.C. Ho, S.E.J. Bell, and C.T. Elliott, Food Control.48, 75–83 (2015).
- P.H. Rodrigues Junior, K. de Sa Oliveira, C.E. de Almeida, L.F. de Oliveira, R. Stephani, S. Pinto Mda, A.F. de Carvalho, and I.T. Perrone, Food Chem.196, 584–588 (2016).
- R.S. Uysal, I.H. Boyaci, H.E. Genis, and U. Tamer, Food Chem. 141(4), 4397–4403 (2013).
- A. Dankowska, M. Malecka, and W. Kowalewski, Dairy Sci. Technol. 95, 413–424 (2015).
- M. Jakubikova, J. Sadecka, and M. Pavel, Acta. Chim. Slov.8(1), 52–58 (2015).
- B. Li, H. Wang, Q. Zhao, J. Quyang, and Y. Wu, Food Chem.181, 25–30 (2015).
- D. Markechova, P. Majek, and J. Sadecka, Food Chem.159, 193–199 (2014).
- C.E. Tanjuara da Silva, V.L. Filardi, I.M. Pepe, M.A. Chaves, and C.M.S. Santos, Food Control. 47, 86–91 (2015).
- X. Ding, Y. Ni, and S. Kokot, Chemometr. Intell. Lab.144, 17–23 (2015).
- X. Zhu, S. Li, Y. Shan, Z. Zhang, G. Li, D. Su, and F. Liu, J. Food Eng. 101(1), 92–97 (2010).
- B. Elzey, D. Pollard, and S.O. Fakayode, Food Chem.68, 303–309 (2016).
- E. Kurniawati, A. Rohman, and K. Triyana, Meat Science.96(1), 94–98 (2014).
- N. Quinones-Islas, O.G. Meza-Marquez, G. Osorio-Revilla, and T. Gallardo-Velazquez, Food Res. Int.51, 148–154 (2013).
- A. Rohman and Y.B.C. Man, Chemometr. Intell. Lab.110(1), 129–134 (2012).
- A. Rohman, S. Riyanto, A.M. Sasi, and F.M. Yusof, Food Biosci.7, 64–70 (2014).
- A. Rohman and Y.B.C. Man, Food Res. Int.43, 886–892 (2010).
- M. Botma, W. Colquhoun-Flannery, and S. Leighton, Int. J. Pediatr. Otorhinolaryngol.58(3), 229–232 (2001).
- R.F. Lins, W.R. Lustri, S. Minharro, A. Alonso, and D. de Sousa Neto, Colloids Surf. A.49, 271–279 (2016).
- A.M. Ojeda-Sana, C.M. van Baren, M.A. Elechosa, M.A. Juarez, and S. Moreno, Food Control. 31, 189–195 (2013).
- R.H. Olmedo, V. Nepote, and N.R. Grosso, LWT-Food Sci. Technol.53, 409–417 (2013).
- Y. Jiang, N. Wu, Y. Fu, W. Wang, M. Luo, C. Zhao, Y. Zu, and X. Liu, Environ. Toxicol. Phar.32, 63–68 (2011).
- E. Araby and S. El-Tablawry, J. Photochem. Photobiol. 159, 24–32 (2016).
- H.P. Singh, S. Kaur, K. Negi, S. Kumari, V. Saini, D.R. Batish, and R.K. Kohli, LWT-Food Sci. Technol.48, 237–241 (2012).
- K. Schnaubelt, in Advanced Aromatherapy, J.M. Beasley, Ed. (Healing Arts Press, Rochester, Vermont, 1998).
- M. Adams, in Chemometrics in Analytical Spectroscopy, 2nd Ed. (Royal Society of Chemistry, Cambridge, Massachusetts, 1995).
- L.N. Hordge, K.L. McDaniel, D.D. Jones Jr., and S.O. Fakayode, Talanta 152, 401–409 (2016).
- S.O. Fakayode, A. Taylor, A.M. Taylor, and C. Myers, Appl. Spectrosc. 66(9), 999–1004 (2012).
- S.O. Fakayode, M.A. Busch, D.J. Bellert, and K.W. Busch, Analyst130, 233–241 (2005).
- S.O. Fakayode, M.A. Busch, and K.W. Busch, Talanta68, 1574–1583 (2006).
- S.O. Fakayode, A.A. Williams, M.A. Busch, K.W. Busch, and I.M. Warner, J. Fluoresc.16, 659–670 (2006).
- E.R. Malinowski, in Factor Analysis in Chemistry (Wiley Press, New York, New York, 1991).
- H. Martens and T. Naes in Multivariate Calibration (Wiley Press, New York, New York, 1998).
- A.A. Williams, S.O. Fakayode, M. Lowry, and I.M. Warner, Chirality21, 305–315 (2009).
- N. Siraj, B. El-Zahab, S. Hamdan, T.E. Karam, L.H. Haber, M. Li, S.O. Fakayode, S. Das, B. Valle, R.M. Srongin, G. Patonay, H.O. Sintim, G.A. Baker, A. Powe, M. Lowry, J.O. Karolin, C.D. Geddes, and I.M. Warner, Anal. Chem. 88(1), 170–202 (2016).
Brianda Elzey, Victoria Norman, Jamira Stephenson, and Sayo O. Fakayode are with the Department of Chemistry at North Carolina Agricultural and Technical State University in Greensboro, North Carolina. David Pollard is with the Department of Chemistry at Winston-Salem State University in Winston-Salem, North Carolina. Direct correspondence to: sofakayo@ncat.edu

AI Shakes Up Spectroscopy as New Tools Reveal the Secret Life of Molecules
April 14th 2025A leading-edge review led by researchers at Oak Ridge National Laboratory and MIT explores how artificial intelligence is revolutionizing the study of molecular vibrations and phonon dynamics. From infrared and Raman spectroscopy to neutron and X-ray scattering, AI is transforming how scientists interpret vibrational spectra and predict material behaviors.
Real-Time Battery Health Tracking Using Fiber-Optic Sensors
April 9th 2025A new study by researchers from Palo Alto Research Center (PARC, a Xerox Company) and LG Chem Power presents a novel method for real-time battery monitoring using embedded fiber-optic sensors. This approach enhances state-of-charge (SOC) and state-of-health (SOH) estimations, potentially improving the efficiency and lifespan of lithium-ion batteries in electric vehicles (xEVs).
New Study Provides Insights into Chiral Smectic Phases
March 31st 2025Researchers from the Institute of Nuclear Physics Polish Academy of Sciences have unveiled new insights into the molecular arrangement of the 7HH6 compound’s smectic phases using X-ray diffraction (XRD) and infrared (IR) spectroscopy.