Qualitative and Quantitative Metabolite Identification for Verapamil in Rat Plasma by Sub-2-μm LC Coupled with Quadrupole TOF-MS
Special Issues
An effective metabolite identification study should ideally include both qualitative and quantitative information that for both identifying metabolites, and determining the rate of clearance and the metabolic routes of the parent drug. Liquid chromatography–mass spectrometry (LC–MS) is considered the standard analytical technique for metabolite identification studies. To date, however, qualitative and quantitative information has always been obtained from two separation platforms: quadrupole time-of-flight (QTof) MS for the exact mass full-scan qualitative study, and tandem quadrupole MS for the multiple reaction monitoring (MRM) quantitative study. With advancements to QTof instrumentation, specifically, recent improvements in sensitivity and dynamic range, it is now possible to perform both qualitative and quantitative experiments on a single QTof mass spectrometer. This article describes a workflow that allows simultaneous qualitative and quantitative metabolite identification studies to be..
The study of drug metabolism is a crucial task for drug research and development, especially in recent years as more high profile drugs such as Vioxx are being withdrawn from the market due to safety related issues (1). In addition, there is a clear tendency to perform drug metabolism studies earlier in the drug discovery and development stage to have an early understanding of the metabolic fate of the parent drug (2).
Major challenges for discovery stage metabolite identification (Met ID) are the need for generic methods, speed and sensitivity, and high selectivity. It is also highly desirable that the Met ID workflow be adapted at this stage to take advantage of commonly observed metabolism mechanisms with built in chemical intelligence while maintaining ease of use. A common practice at the discovery stage is to conduct an in-vitro metabolism study of the parent drug so that the so called "soft spot" of the parent drug (the site of major metabolism) can be identified early and quickly.
A typical in-vitro metabolic study involves the investigation of both rate and metabolic routes of the parent drug (3). Liquid chromatography (LC) coupled with mass spectrometry (MS) is the gold standard for Met ID studies (2). However, even with advanced analytical instrumentation based on sub-2-µm particle technology, such as the ACQUITY UPLC system (Waters Corporation, Milford, Massachusetts) allowing high resolution chromatographic separations at higher throughput (4), the complete study of the rate and route of parent drug and its metabolites still can be labor intensive and time consuming.
For example, traditionally, the task of qualitative and quantitative Met ID requires two types of instruments to complete: a full-scan exact mass time-of-flight instrument, for the qualitative identification of the metabolites, and a tandem quadrupole mass spectrometer for the quantitative metabolism study. Currently, these tasks can be performed separately and sometimes in separate laboratories. The goal of many laboratories is to streamline their studies into a single workflow combining the tasks of both quantitative and qualitative Met ID into a single experiment.
Historically, time-of-flight (TOF)-MS is perceived as ill suited for quantification studies due to sensitivity and linear dynamic range, both of which are the consequences of older hardware designs. However, with recent advances in electronics and in TOF instrument development, this is no longer the case. New quadrupole time of flight (QTof) mass spectrometers (Synapt G2 mass spectrometer and Xevo G2 QTof mass spectrometer, Waters Corporation) perform both qualitative and the quantitative analysis over a wide dynamic range with excellent sensitivity and reproducibility.

Figure 1: Schematic of quantification technology (QuanTOF) incorporated in the Synapt G2 MS and Xevo G2 QTof mass spectrometers.
Both of these instruments combine a high field pusher and dual-stage reflectron along with a novel ion detection system combining an ultrafast electron multiplier and hybrid ADC detector, in an optimized, folded, TOF geometry (QuanTof, see Figure 1). This geometry is designed to provide a new level of high resolution, exact-mass performance at acquisition rates compatible with the speed of sub-2-µm liquid chromatography (LC) separations, and ensures that quantitative performance is obtained (5,6).
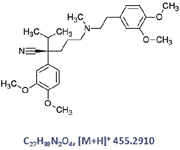
Figure 2: Chemical structure of the parent drug verapamil.
For this project, we chose a well known drug, verapamil (Figure 2), as our model compound for the qualitative and quantitative Met ID study using the UPLC/Synapt G2 MS system (see schematic Figure 3). Verapamil is an L-type calcium channel blocker of the phenylalkylamine class. It has been used in the treatment of hypertension, angina pectoris, cardiac arrhythmia, and most recently, cluster headaches (7). The metabolites of verapamil were obtained by performing in vitro microsome incubation of the parent drug. To mimic the matrix effect of in vivo samples, the incubation samples were spiked into rat plasma before injection into the system. A workflow developed by our group was used for this work (8–10). As a result, the metabolic rate and the route of the parent drug were determined from one set of incubation samples on a single analytical platform.
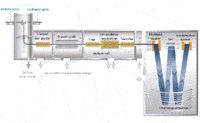
Figure 3: Schematic of the MS system (Synapt 2, Waters Corporation).
Experimental Section
Microsome Incubation: Verapamil was incubated at 37 °C with a human liver microsome at 50 µM, with the reaction terminated at 0-, 15-, 30-, 60-, 120-, and 240-min intervals by adding an equal volume of cold acetonitrile (11). At each time interval, samples were collected and then centrifuged at 12,000 rpm for 15 min. A 50-µL volume of supernatant of the solution was then spiked into 450 mL of rat plasma followed by adding 1 mL of acetonitrile for protein precipitation. This solution was then centrifuged again at 12,000 rpm for 15 min. The supernatant (equivalent to about 2.5 µM parent drug incubation concentration) was directly injected into the system for analysis.
Calibration Standard Solutions: A standard verapamil stock solution was prepared with DMSO at 20 mM. It was then diluted into a concentration series of 10,000, 5000, 1000, 500, 100, 50, 10, 5, and 1 ng/mL with rat plasma followed by the addition of acetonitrile (2:1 v:v) for protein precipitation. Samples were then centrifuged at 12,000 rpm for 15 min. The supernatant was directly injected into the system for analysis.
Reagents: Fisher Optima-grade acetonitrile, methanol, and isopropanol were obtained from ThermoFisher Co (Waltham, Massachusetts). Formic acid and leucine enkephalin were purchased from Sigma Aldrich (St. Louis, Missouri). Deionized water was obtained using a Milli-Q system (EMD Millipore, Bedford, Massachusetts).
LC Conditions: The LC separation was performed on an ACQUITY UPLC system (Waters) with an ACQUITY UPLC HSS T3 column (1.8 µm, 100 mm × 2.1 mm). The column temperature was maintained at 45 °C. The flow rate used was 600 µL/min. Mobile phase A was water with 0.1% formic acid (v/v), and mobile phase B was acetonitrile. The initial gradient condition called for 98% A, stepped down to 50% A in linear fashion over 10 min, then stepped to 0% A at 10 min and held for 2 min. At 12 min, the mobile phase gradient was stepped back to 98% A for a 3-minute equilibration. The total run time was 15 min, and the injection volume was 10 µL. The strong wash solvent was water–acetonitrile–methanol–isopropanol (25:25:25:25, v/v/v/v) with 0.1% formic acid, the weak wash was mobile phase A.
Mass Spectrometry Conditions: The MS detection was performed on a Synapt G2 MS System (Waters Corporation). The data acquisition mode was MSE (8). The ionization mode was positive electrospray (ESI+). The source temperature was set at 120 °C, the desolvation temperature was set at 550 °C with desolvation gas flow of 900 L/h. The lock mass compound was leucine enkephalin (m/z 556.2771). The capillary voltage was set at 3 kV. The cone voltage was set at 40 V. The collision energies were set as 5 V (trap)/4 V (transfer) for the low collision energy scan, and 25–40 V ramp (trap)/5 V (transfer) for the high collision energy scan.
The LC–MS data acquisition was controlled by MassLynx v.4.1 Software (Waters Corporation).
Data Processing: The qualitative metabolite identification was performed by MetaboLynx XS software. The calibration and quantification of the identified metabolites was performed by TargetLynx software.
Results and Discussion
Summary of the Qualitative and Quantitative Met ID Workflow: The data reported here was obtained using a scheme that combines both the qualitative Met ID workflow (Figure 4) and the quantification workflow.
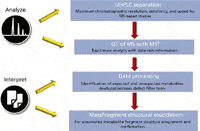
Figure 4: Met ID workflow.
After sample preparation, which included preparation of the calibration standard series and the incubation samples at the desired time points, the data acquisition was performed using the LC–TOF MSE in ESI+ mode for all samples. Data from the incubation samples were then processed using the MetaboLynx XS application manager. This step generates a list of proposed verapamil metabolites and becomes the basis for quantification. Details of this work flow have been previously reported elsewhere (8–10).
The list of analytes consisting of the major metabolites identified by the software was then used to generate the quantitation processing method. Using the exact mass and retention time of each target analyte, absolute quantification of the incubated samples was performed at various time points against the known standards with the TargetLynx application manager.
Metabolite Identification by MetaboLynx XS: In the qualitative Met ID workflow, we utilized the LC–QToF MSE data acquisition strategy (7,8). This strategy combines the advantages of sub-2-µm LC for high resolution, high sensitivity, and high speed separation, as well as the TOF exact mass measurement capability. In the QTof MSE data acquisition strategy (Figure 5), the mass spectrometer acquires two distinct but parallel data sets, one at low collision energy (CE) and the other at high CE. The resulting raw data file consists of two distinct chromatograms: one containing data for all precursor ions with the other containing product ion information. From a single LC injection, the complete MS full-scan precursor and product ion information can be obtained simultaneously.
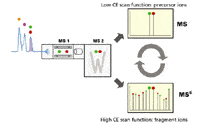
Figure 5: QTof MSE data acquisition strategy.
During a data-mining process, the software first uses chemical intelligence to predict phase I dealkylations by utilizing the dealkylation tool from the Mass Fragment software. These dealkylations are unique to a parent structure. They cannot be predicted by the addition of common routes of metabolism, and are essential in the determination of the soft spot of the parent drug (10). The software then automatically generates mass defect filters based on the result of the dealkylation and the knowledge of common metabolism routes to eliminate background interferences from endogenous compounds.
In addition to these functions, the software facilitates structural elucidation and uses the high energy product ion information for the confirmation of the metabolites that were initially identified.
Figure 6 shows a screen shot of the browser software used. In the browser, the following items are reported. In Figure 6a, the vial location of the injected sample; in Figure 6b, the possible metabolites with predicted elemental composition, proposed biotransformation, and the exact mass information; in Figure 6c, the parent drug structure; in Figure 6d, the combined extracted ion chromatogram (XIC) trace for all identified metabolites; in Figure 6e, the XIC of a user-specified metabolite (highlighted in blue bar, Figure 6b); in Figure 6f, the exact-mass XIC corresponding to the trace in Figure 6e from the control sample (all information here was obtained based upon the MS full-scan data); in Figure 6g, the MS full-scan spectrum for the user-specified metabolite; in Figure 6h, the high-collision energy spectrum for the user-specified metabolite. This software browser provides the essential information for building the quantification method in TargetLynx software.
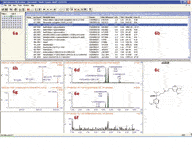
Figure 6: Metabolite identification report for verapamil in rat plasma displayed in MetaboLynx Browser software.
It is worth noting that in this software browser, the relative quantification information is calculated. As shown in Figure 6b, the absolute and relative peak areas for all metabolites are reported. Relative area is defined as the percentage of the total area for all metabolites identified. The absolute peak areas for all metabolites across multiple time points can be exported directly into an Excel spreadsheet. From the spreadsheet, a parent drug clearance curve and metabolite formation curves may be constructed so that the relevant rate information such as the half life of the parent can be determined. All quantitative information obtained here is in relative terms. No absolute concentration can be determined at this point.
To obtain the absolute quantification information, standard calibration curves must be constructed, and metabolite concentrations can then be determined by applying the relevant calibration curves.
Quantification Using Software
Theoretically, to properly quantify the rate of parent drug clearance and the rates of metabolite formation, calibration curves must be constructed for all analytes in question, that is, in addition to generating a calibration curve for the parent drug, each identified metabolite should have a relevant standard calibration curve. However, at the discovery stage, metabolite standards are usually unavailable. In order to quantify the metabolites, the use of the parent drug calibration curve is a typical practice. Therefore, we adopted this approach in this work.
Figure 7 shows the standard calibration curve of the parent drug verapamil. As shown in the figure, the curve is linear over four orders of dynamic range with an r2 value of 0.998. This result was obtained based upon triplicate injections per concentration point. As a part of the quantification process, three levels of quality control (QC) standards were injected, with nine injections made at each level. The low QC level was at a concentration of 10 ng/mL with 9.66% RSD, the mid QC level was at 100 ng/mL with 5.80% RSD, and the high QC level was at 1000 ng/mL with 1.92% RSD.
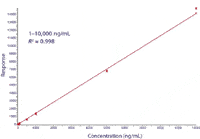
Figure 7: Calibration curve of verapamil spiked in rat plasma.
With the parent drug calibration curve available, the concentration of the parent drug and identified metabolites from the incubation samples at different time points were determined. As a result, the parent drug clearance curve and formation curves for several major metabolites were obtained and are presented in Figure 8.
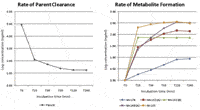
Figure 8: Curves for parent drug clearance and metabolite formation of verapamil in rat plasma.
Conclusion
A qualitative and quantitative Met ID workflow was demonstrated by using a sub-2-µm–QTof MSE system followed by data reduction and processing with proprietary software. The quantification technology available with the latest generation of quadrupole TOF mass spectrometers described here significantly enhances the quantification capabilities, producing a calibration curve for verapamil with a linear range of four orders of magnitude. This allows the parent drug clearance and metabolite formation to be determined with high confidence.
As a result, from a single analytical platform, it is now possible to perform a qualitative and quantitative discovery metabolite identification more easily at a higher throughput and at a lower expense.
Acknowledgment
The authors wish to thank Dr. Min Li, a private consultant, for performing all sample preparations for this work, and Dr. Marian Twohig (Waters Corporation) for her help with data processing in TargetLynx.
Kate Yu, Alan Millar, Henry Shion, Stephen McDonald, and Brian J. Murphy are with Waters Corporation, Milford, Massachsetts. Jeff Goshawk is with Waters Corporation, Manchester, UK.
References
(1) A.M. Issa, K.A. Phillips, S. Van Bebber, H.G. Nidamarthy, K.E. Lasser, J.S. Haas, B.K. Alldredge, R.M. Wachter, and D.W. Bates, Current Drug Safety 2(3), 177–185 (2007).
(2) W.A. Korfmacher, Using Mass Spectrometry for Drug Metabolism Studies (CRC Press, Boca Raton, Florida, 2005).
(3) D. O'Connor, R. Mortishire-Smith, D. Morrison, A. Davies, and M. Dominguez, Rapid Commun. Mass Spectrom. 20, 851–857 (2006).
(4) Waters White paper, "Ultra Performance LC UPLC: New Boundaries for the Chromatography Laboratory," 720000819 EN, May, 2004.
(5) A. Wallace, Amer. Lab., 13–17 (May 2010).
(6) "Quantitative Analysis of Alprazolam in Rat Plasma using ACQUITY UPLC Coupled with Xevo G2 Qtof", Waters Technical Brief 720003426EN, March 2010.
(7) E. Beck, W.J. Sieber, and R. Trejo, Amer. Family Phys. 71(4), 717–724 (2005).
(8) K. Bateman, J. Castro-Perez, M. Wrona, J. Shockcor, K. Yu, R. Oballa, and D. Nicoll-Griffith, Rapid Comm. Mass Spectrom. 21, 1485–1496 (2007).
(9) P. Tiller, S. Yu, J. Castro-Perez, K. Fillgrove, and T. Baillie, Rapid Comm. Mass Spectrom. 22, 1053–1061 (2008).
(10) R. Mortishire-Smith, J. Castro-Perez, K. Yu, and J. Shockcor, Rapid Comm. Mass Spectrom. 23, 938–948 (2009).
(11) "Instruction for Using Microsomes and S9 Fractions," In Vitro Technologies, July 11, 2003.

High-Speed Laser MS for Precise, Prep-Free Environmental Particle Tracking
April 21st 2025Scientists at Oak Ridge National Laboratory have demonstrated that a fast, laser-based mass spectrometry method—LA-ICP-TOF-MS—can accurately detect and identify airborne environmental particles, including toxic metal particles like ruthenium, without the need for complex sample preparation. The work offers a breakthrough in rapid, high-resolution analysis of environmental pollutants.
The Fundamental Role of Advanced Hyphenated Techniques in Lithium-Ion Battery Research
December 4th 2024Spectroscopy spoke with Uwe Karst, a full professor at the University of Münster in the Institute of Inorganic and Analytical Chemistry, to discuss his research on hyphenated analytical techniques in battery research.
Mass Spectrometry for Forensic Analysis: An Interview with Glen Jackson
November 27th 2024As part of “The Future of Forensic Analysis” content series, Spectroscopy sat down with Glen P. Jackson of West Virginia University to talk about the historical development of mass spectrometry in forensic analysis.
Detecting Cancer Biomarkers in Canines: An Interview with Landulfo Silveira Jr.
November 5th 2024Spectroscopy sat down with Landulfo Silveira Jr. of Universidade Anhembi Morumbi-UAM and Center for Innovation, Technology and Education-CITÉ (São Paulo, Brazil) to talk about his team’s latest research using Raman spectroscopy to detect biomarkers of cancer in canine sera.