Raman Spectroscopy Coupled with Advanced Chemometrics for Forensic Analysis of Semen and Blood Mixtures
Spectroscopy
In this study, regression and classification chemometrical algorithms were combined to achieve effective discrimination of pure body fluids from their binary mixtures.
Near-infrared (NIR) Raman spectroscopy has become widespread in different areas of the analytical study of materials, including forensic science. The nondestructive character, high selectivity, and possibility to explore a variety of materials make NIR Raman a valuable tool for the identification of body-fluid traces. In this study, we combined regression and classification chemometrical algorithms to achieve effective discrimination of pure body fluids from their binary mixtures. Raman spectra of dried blood, semen, and their mixtures in different ratios, collected in an automatic mapping manner, were used as a model system. The established detection limit for minor contributors is as low as a few percent. The proposed methodology takes into account the intrinsic heterogeneity of blood and semen and their variations between donors, and it potentially can be applied on other mixtures, including those which are of interest to forensic specialists.
In this article, we outline a recently published study on differentiating semen and blood mixtures from individual body fluids (1). The ultimate goal of this project is to develop a nondestructive, confirmatory method for the identification of trace amounts of body fluids for forensic purposes (2,3). Modern forensic tools, such as DNA- and RNA-based methods, provide confirmation of body-fluid type, race, and gender. Even a person involved in a crime can be unambiguously identified by genetic analysis of biological evidence. However, in real life, forensic laboratories equipped with such labor-intensive and expensive techniques are significantly outnumbered by the quantity of biological "footprints" associated with crimes. As a result, there are thousands of body-fluid samples waiting to be analyzed. This type of analysis can be difficult or impossible to perform when the amount of evidence is diminutive or is presented as a complex mixture.
Raman spectroscopy is a nondestructive, time-efficient, and easy-to-use technique suitable for the simultaneous characterization of multiple fluids. Our earliest studies demonstrated the exceptional potential of near-infrared (NIR) Raman spectroscopy for identifying pure body-fluid stains and encouraged us to address more complicated problems, such as differentiating pure body fluids from their mixtures (1,3–11). This practical task required a simplified formulation of the common statistical problem of spectroscopic signal demixing. A forensic expert is much more interested in determining the presence or absence of particular body fluids within a stain than their exact contributions (percentages), which are perfectly accidental.
This scientific problem has been studied using mixtures of blood and semen as model systems because they are highly practical. Blood and semen mixtures are often found at crime scenes related to sexual assaults. The detection of even minor remnants of these types of forensic evidence could be crucial for investigating a crime. Several methods for body-fluid identification were recently proposed and have been used efficiently in forensic laboratories. It is possible to characterize such biological evidence by fluorescence (12–14), immunological tests (15), electrophoretic separation (16), RNA and DNA profiling (17), and several other methods (18–22).
Despite the undeniable advantages of the methods listed above, a uniform approach that can save sample for further analysis and provide fast and accurate results is still a necessity. The Raman effect occurs due to the interaction of an incident photon with a vibrating molecule. The energies of the scattered photons with shifted frequencies can be graphically represented as Raman spectra that provide unique information about the biochemical composition of the analyzed samples (23). The volume of the analyzed matter can be as small as a few femtoliters or picograms of sample.
Recent developments in analytical instrumentation have allowed for the comprehensive manipulation of samples using techniques such as automatic imaging and mapping. This technique automatically collects spectra when a sample under the laser beam moves by a specified amount until all of the areas are scanned. This approach yields large data sets that can be preprocessed and treated with a variety of statistical software packages. Combining Raman spectroscopy with multivariate statistics helps avoid the problem of heterogeneity of body-fluid stains; their composition can vary between donors and within the sample. The method we propose can process samples with various fluorescent profiles and overlapping spectral bands, which are common features for biological objects.
Our method is based on the effective combination of regression and classification analyses that require a multistep discrimination procedure. Support vector machine (SVM) regression was selected to separate the mixture's spectra that can be easily distinguished from those of pure fluids. The final classification model was built on selected data using support vector machine discriminant analysis (SVMDA). Then, the entire data set was subjected to the analysis. As a result, we were able to distinguish spectra with minor contributions of blood or semen. The lowest concentrations that we were able to detect were 5% of blood in semen and approximately 1% of semen in blood stains. Lower concentrations could be detected, but the accuracy of detection decreased significantly. The proposed approach potentially can be plugged into portable instruments as a discriminative algorithm, which would be beneficial for forensic laboratories as a valuable tool for investigation directly at a crime scene.
Experimental
Mixtures of blood and semen in different ratios (5:95, 10:90, 20:80, 30:70, 40:60, 50:50, 70:30, 75:25, 85:15, 85.5:12.5, 92.75:6.25, 96.9:3.1, and 98.4:1.6) were prepared. All samples were thoroughly blended to reconstruct the most difficult scenario, where two body fluids are presented as a highly homogeneous mixture. Each microscope slide was covered with a piece of aluminum foil, which has a small Raman and fluorescence profile, and a 10 μL sample was deposited on the foil. The entire data set was formed from spectra recorded by a Renishaw inVia confocal Raman spectrometer equipped with a Leica microscope with a 50× objective and a Prior Scientific automatic stage. A 785-nm laser beam was used for excitation. A mapping procedure was performed on a 3.5 × 2.5 mm area, and a total of 108 spectra were accumulated from each sample.
Recorded spectra were preprocessed in GRAMS/AI 7.01 software (Thermo Scientific) and treated in MATLAB 7.4.0 (Mathworks). The preprocessing procedure included subtraction of the fluorescent background by the adaptive iteratively reweighted penalized least squares (airPLS) algorithm (25), removal of cosmic ray interference, and normalization of spectra by the total area to account for the total offset variation. SVM regression of dimensionally reduced data (principal component analysis, or PCA) was performed to select three characteristic groups of spectra: pure semen, pure blood, and their mixture. Those groups were analyzed using an SVMDA algorithm to find out the possibility of discrimination between mixture and pure fluid classes, and establish the detection limit.
Results and Discussion
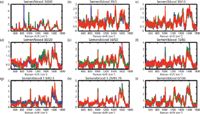
From our previous study, we know that the composition of all human body fluids may vary between donors and even within a sample (26). The Raman spectra of mixtures can be characterized by the presence of the most prominent peaks in blood at 754, 1003, 1226, and 1619 cm-1 (9) and semen at 716, 830, 959, 1268, 1329, and 1671 cm-1 (7) (Figure 1). In cases where body fluids are not well mixed and the surface of a dry spot has areas dominated by one of two fluids, the sample can be analyzed by multidimensional Raman spectroscopic signatures (7,9). The most difficult cases occur when the blood and semen are thoroughly mixed. Using the naked eye to observe the acquired data from a thoroughly mixed sample has revealed that the contribution from semen is less noticeable, which was especially true for mixtures with a blood concentration greater than 50%.

Figure 1: Selected characteristic raw Raman spectra acquired from pure (a) semen and (i) blood along with the spectra of (bâh) bloodâsemen mixtures.
A number of comprehensive chemometrical approaches, including classical least squares, inverse least squares, partial least squares, principal component regression, least-squares support vector machines, and artificial neural networks, were applied directly to the data to discriminate the components of the mixture (27–29). However, these attempts did not effectively separate the classes because of the high level of heterogeneity of blood and semen. Here, we present the results of the SVM classification and describe the weaknesses of its straightforward application. During the first stage of analysis, we assigned a total of 15 classes for all of the mixtures and pure body fluids (Figure 2a; the x-axis corresponds to the number of samples, and the y-axis corresponds to the predefined class). The calculations revealed that a significant part of the mixtures was misclassified as pure blood or semen. However, when we performed the same calculations using only three classes (pure semen, mixture, and pure blood), approximately 40% of the blood and semen samples were misclassified as a mixture (Figure 2b).

Figure 2: Assignment of Raman spectra (colored symbols) of semen/blood mixtures according to different SVM classification models: (a) All 15 mixtures with compositions varying from pure semen (red symbols) to pure blood (black symbols) were treated as separate classes. (b) A similar analysis performed with the same experimental data set, but with a different classification scheme: class 1 = pure semen, class 2 = mixture, class 3 = pure blood.
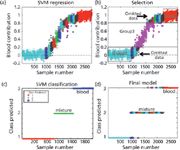
These results illustrate that characterizing complicated systems, such as body-fluid mixtures, requires a more comprehensive approach. To improve discrimination, we developed a method that effectively combines the regression and classification analyses (Figure 3). During the first stage of the investigation, we prepared the data as described in the Experimental section (background subtraction, removal of cosmic rays, normalization, and assignment of classes). The pretreated data were subjected to SVM regression with leave-one-out cross-validation to determine the relationships between the measured and predicted classes (Figure 3a). This step revealed a smooth sigmoidal transition from pure fluid 1 to pure fluid 2, which was in agreement with the concentrations of the components. This calibration procedure helped us to select mixture spectra that could be easily distinguished from those of pure fluids (Figure 3b).

Figure 3: (a) Blood contributions in a semen/blood mixture calculated using SVM regression. Blue crosses and red triangles represent the Raman spectra of pure semen and blood, respectively. Different types of symbols correspond to different mixtures. (b) The selection of Raman spectra for the following SVMDA classification. The first and second groups include the Raman spectra of pure fluids only, while Raman spectra of mixtures distinguishable from the first two groups compose the third group. (c) Cross-validated results of the SVMDA classification. (d) SVMDA analysis of the experimental Raman spectra, including those omitted during the classification model development stage (b). Each symbol corresponds to a single Raman spectrum.
Semen, mixture, and blood classes were chosen and assigned as classes 1, 2, and 3, respectively. Only these spectra were subjected to the SVMDA classification with the help of PCA compression and cross-validation by 1000 splits. Data points outside of the range of 15–75% of blood were omitted because they overlapped with the classes of pure semen and blood (see Figure 3b). As expected, discriminant analysis of the selected spectra correctly distinguished (100%) the assigned classes. This model was used as the basis for further calculations and was applied to all of the data, including those previously omitted. The majority of the spectra were assigned to the correct class or mixture (Figure 3d). These procedures significantly improved the results achieved by directly applying the classification methods.
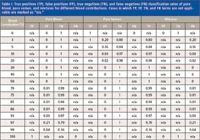
In addition to the achieved results, we performed an external validation of our model using new donors (six for each body fluid). Different ratios of blood and semen were prepared, and their spectra were automatically classified. The results revealed that most of the spectra were assigned to the correct class. Only several spectra from the boundary classes were misclassified (the possibility of producing a false positive, false negative, true positive, or true negative classification is summarized in Table I).

Table I: True positives (TP), false positives (FP), true negatives (TN), and false negatives (FN) classification rates of pure blood, pure semen, and mixtures for different blood contributions. Cases in which TP, FP, TN, and FN terms are not applicable are marked as "n/a."
Conclusions
This study examined the potential to use NIR Raman spectroscopy to characterize a mixture of blood and semen. The methodological aspects can be concisely summarized as follows: The spectroscopic data obtained from mixtures of blood and semen combined in different ratios were preprocessed and subjected to chemometrical analysis. During the first step, the spectroscopic data were subjected to a regression analysis, which allowed us to select three main classes that were distinguishable from each other and build an initial classification model. The spectra of the mixture samples with less than 15% and more than 75% blood were not considered during the preliminary discrimination procedure. After the model was developed, the SVMDA classification algorithm was applied to all of the data, including the previously omitted spectra. The obtained results were extensively cross-validated. The classification procedure revealed that the detection limits of both body fluids were as low as a few percent. Consequently, our recent studies, briefly delineated here, demonstrate the robustness of Raman spectroscopy coupled with advanced statistics and the validity of the initial studies.
Acknowledgments
This project was supported by Award No. 2011-DN-BX-K551 awarded by the National Institute of Justice, Office of Justice Programs, U.S. Department of Justice (I.K.L.). The opinions, findings, and conclusions or recommendations expressed in this publication are those of the authors and do not necessarily reflect those of the Department of Justice. We also would like to acknowledge Claire K. Luber for assistance with manuscript preparation.
References
(1) V. Sikirzhytski, A. Sikirzhytskaya, and I.K. Lednev, Forensic Sci. Int. 222, 259–265 (2012).
(2) K. Virkler and I.K. Lednev, Forensic Sci. Int. 188, 1–17 (2009).
(3) V. Sikirzhytski, A. Sikirzhytskaya, and I.K. Lednev, Appl. Spectrosc. 65, 1223–1232 (2011).
(4) V. Sikirzhytski, A. Sikirzhytskaya, and I.K. Lednev, J. Biophotonics (2012).
(5) V. Sikirzhytski, A. Sikirzhytskaya, and I.K. Lednev, Forensic Sci. Int. 216, 44–48 (2012).
(6) V. Sikirzhytski, A. Sikirzhytskaya, and I.K. Lednev, Anal. Chim. Acta 718, 78–83 (2012).
(7) K. Virkler and I.K. Lednev, Forensic Sci. Int. 193, 56–62 (2009).
(8) K. Virkler and I.K. Lednev, Analyst 135, 512–517 (2010).
(9) K. Virkler and I.K. Lednev, Anal. Bioanal. Chem. 396, 525–534 (2010).
(10) K. Virkler and I.K. Lednev, Forensic Sci. Int. 181, e1–5 (2008).
(11) K. Virkler and I.K. Lednev, Anal. Chem. 81, 7773–7777 (2009).
(12) N. Vandenberg and R.A.H. van Oorschot, J. Forensic Sci. 51, 361–370 (2006).
(13) H.J. Kobus, E. Silenieks, and J. Scharnberg, J. Forensic Sci. 47, 819–823 (2002).
(14) M. Stoilovic, Forensic Sci. Int. 51, 289–296 (1991).
(15) P.J. Ablett, J. Forensic Sci. Soc. 23, 255–256 (1983).
(16) R.H. Mokashi, A.G. Malwankar, and M.S. Madiwale, J. Indian Acad. Forens. Sci. 14, 1–3 (1975).
(17) T.A. Brettell, J.M. Butler, and J.R. Almirall, Anal. Chem. 81, 4695–4711 (2009).
(18) C. Haas, B. Klesser, C. Maake, W. Bar, and A. Kratzer, Forensic Sci. Int. Genet. 3, 80–88 (2009).
(19) J. Juusola and J. Ballantyne, Forensic Sci. Int. 135, 85–96 (2003).
(20) J. Juusola and J. Ballantyne, J. Forensic Sci. 52, 1252–1262 (2007).
(21) J. Juusola and J. Ballantyne, Forensic Sci. Int. 152, 1–12 (2005).
(22) R.I. Fleming and S. Harbison, Forensic Sci. Int. 4, 311–315 (2010).
(23) J.M. Chalmers and P.R. Griffiths, Eds., Applications in Life, Pharmaceutical and Natural Sciences (John Wiley & Sons, Ltd, Chichester, UK, 2002).
(24) B.M. Wise, N.B. Gallagher, R. Bro, J.M. Shaver, W. Windig, and J.S. Koch, PLS Toolbox 3.5 for use with Matlab, Eigenvector Research Inc., Manson, 2005.
(25) Z.M. Zhang, S. Chen, and Y.Z. Liang, Analyst 135, 1138–1146 (2010).
(26) V. Sikirzhytski, K. Virkler, and I.K. Lednev, Sensors 10, 2869–2884 (2010).
(27) J.E. Franke, in Handbook of Vibrational Spectroscopy, J.M. Chalmers and P.R. Griffiths, Eds. (John Wiley & Sons, Ltd., New York, 2001), vol. 3, pp. 2276–2292.
(28) T. Hasegawa, in Handbook of Vibrational Spectroscopy, J.M. Chalmers and P.R. Griffiths, Eds. (John Wiley & Sons, Ltd., New York, 2001), vol. 3, pp. 2293–2312.
(29) V.A. Shashilov and I.K. Lednev, Chem. Rev. 110(10), 5692–5713 (2010).
Aliaksandra Sikirzhytskaya, Vitali Sikirzhytski, and Igor K. Lednev are with the Department of Chemistry at the University at Albany, SUNY in Albany, New York.
Direct correspondence to: ilednev@albany.edu

AI-Powered SERS Spectroscopy Breakthrough Boosts Safety of Medicinal Food Products
April 16th 2025A new deep learning-enhanced spectroscopic platform—SERSome—developed by researchers in China and Finland, identifies medicinal and edible homologs (MEHs) with 98% accuracy. This innovation could revolutionize safety and quality control in the growing MEH market.
New Raman Spectroscopy Method Enhances Real-Time Monitoring Across Fermentation Processes
April 15th 2025Researchers at Delft University of Technology have developed a novel method using single compound spectra to enhance the transferability and accuracy of Raman spectroscopy models for real-time fermentation monitoring.
Nanometer-Scale Studies Using Tip Enhanced Raman Spectroscopy
February 8th 2013Volker Deckert, the winner of the 2013 Charles Mann Award, is advancing the use of tip enhanced Raman spectroscopy (TERS) to push the lateral resolution of vibrational spectroscopy well below the Abbe limit, to achieve single-molecule sensitivity. Because the tip can be moved with sub-nanometer precision, structural information with unmatched spatial resolution can be achieved without the need of specific labels.