Rapid Field Detection of Chemical Warfare Agents and Toxic Industrial Chemicals Using a Hand-Portable GC–TMS System
Special Issues
In this article, methods developed for rapid, automated detection of CWAs and TICs using a low thermal mass capillary gas chromatograph coupled to a toroidal ion trap mass spectrometer (TMS) are presented.
Rapid and accurate detection of chemical threats, such as chemical warfare agents (CWAs) and toxic industrial chemicals (TICs), is imperative for safety mitigation and human protection in warfare and security domains. Gas chromatography–mass spectrometry (GC–MS) is a very selective and sensitive analytical technique that is used routinely in laboratory settings. Now GC–MS can be applied to near-real-time detection of CWAs and TICs in the harsh operating conditions encountered in field environments using a hand-portable instrument. In this article, methods developed for rapid, automated detection of CWAs and TICs using a low thermal mass capillary gas chromatograph coupled to a toroidal ion trap mass spectrometer (TMS) are presented. The advantages of reliably detecting these types of target analytes in air, headspace, liquids, and dissolved solids from trace to neat concentrations with a hand-portable GC–TMS system will be demonstrated.
The ability to detect chemical warfare agents (CWAs) and toxic industrial chemical (TIC) threats in near real-time in the field can be extremely beneficial and is finding broader utilization for a number of applications by military personnel, emergency responders, and environmental scientists. To be effective, such detection technologies must address the criteria shown in Table I for making field measurements with portable instrumentation. Along with advances toward better sensitivity, faster analysis times, and affordability, detection technology is being miniaturized for hand-portability and reliable detection under harsh field environments. Faster speeds of analysis are key to providing the user with instantaneous data to answer time-sensitive questions immediately on-site.
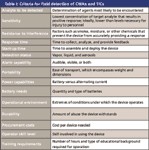
Table I: Criteria for field detection of CWAs and TICs
Technologies that are currently used for field detection of CWAs and TICs include dye solubility (detection paper), enzymatic reaction, gas–solid phase reaction (Draeger tubes), surface acoustic wave (SAW), infrared spectrophotometry, Raman spectroscopy, flame photometry, and ion mobility spectrometry (IMS) (1–4). Chemical detectors based upon these technologies, while meeting the criteria of being portable and relatively easy to use in the field, offer only limited chemical specificity and sensitivity and are prone to false positive responses (3). They often are referred to as one-dimensional sensors that can only confirm what is already believed to be present, but cannot provide information about other possible harmful agents (1,5).
Miniaturization of mass spectrometry (MS) for field measurements has been pursued intensively over the past decade. Efforts to develop small, portable mass analyzers have focused on various types and formats of devices, including time-of-flight MS (6), electrostatic-magnetic sector MS-MS (7), cylindrical ion traps (8,9), rectilinear ion traps (10,11), toroidal ion traps (12,13), and halo ion traps (14). Ion traps are emerging quickly as the preferred mass-based detection systems due to their ability to operate at higher pressures and their overall ruggedness.
Orthogonal pairing of different analytical techniques can be particularly advantageous for detection of chemical threats (12,13,15). For example, while MS is a sensitive and selective detection technology and is valuable for identifying unknown compounds from their characteristic mass spectral fragmentation patterns, its singular use for analysis of complex matrices found in real-world samples might not provide optimal results. However, MS coupled with a separation technique such as gas chromatography (GC) enables two-dimensional analysis, which provides significantly greater capability for identification of compounds in complex mixtures. Analytical advantages of high sensitivity, high selectivity, and rapid response time make GC–MS a preferred detection technique for CWAs and TICs (14,16) as long as it can be packaged for field use in a truly portable, durable, self-supported format that is relatively easy to operate by nonscientific personnel.
In this article, methods developed for rapid, automated detection of CWAs and TICs using a new low thermal mass capillary gas chromatograph coupled to a toroidal ion trap mass spectrometer are presented. This GC–toroidal ion trap mass spectrometry (TMS) instrument is completely self-contained with onboard helium carrier gas and battery power. A user-defined, embedded library of target analytes is used to provide identification of chemical compounds of interest automatically based upon their characteristic retention times and mass spectral ions. Results are reported in a tabular format that is displayed on the LCD screen. The advantages of reliably detecting CWA and TIC analytes in air, headspace, liquids, and dissolved solids from trace to neat concentrations with GC–TMS are demonstrated.
Experimental
Sample Preparation and Injection
Analyte mixtures were spiked in either water or isopropanol at concentrations ranging from 1 to 2000 ppm (w/v). Solid-phase microextraction (SPME) was used as a convenient approach for sampling gaseous, liquid, and dissolved solid samples, concentrating the analytes, and transferring them into the GC–TMS system. The target CWA and TIC analytes shown in this article were extracted and collected by direct immersion of an SPME fiber in the sample matrix for 5–30 s. The SPME fiber was a coated 65-μm df polydimethylsiloxane–divinylbenzene (PDMS–DVB) phase (Supelco Analytical, Bellefonte, Pennsylvania) and was housed in a syringe holder (CUSTODION SPME syringe, Torion Technologies Inc., American Fork, Utah). Thermal desorption of the SPME fiber was achieved by insertion of the fiber into the heated injection port of the GC–TMS system. The injection port was Sulfinert-treated to ensure inertness of the stainless steel components.
Sample Separation and Detection
A hand-portable GUARDION-7 (Torion Technologies Inc.) GC–TMS system was used for rapid separation and detection of the CWA and TIC analytes studied in this work. Fast separations were achieved using a low thermal mass (LTM) capillary GC system. Analytes desorbed from the SPME fiber into the injection port were separated quickly on a resistively heated LTM capillary GC column (MXT-5, 5 m × 0.1 mm, 0.4 μm df, Restek, Bellefonte, Pennsylvania) coupled directly to the TMS system. A rapid temperature program of 50–270 °C at 2 °C/s was employed. Helium carrier gas was supplied from an onboard disposable cartridge that is capable of supporting ~300 analyses. A septum purge of ~1 mL/min and a split ratio 1:20 were used in conjunction with the split injection method.
Detection of separated analytes was achieved by the miniaturized TMS system. The RF trapping field of the system was set at 4.0 MHz at an amplitude of ~1200 (max) Vp-p. Resonance ejection was achieved by applying 3.5 to –1.5 V to the filament end cap and scanning the ejection frequency from ~1.6 MHz to ~110 kHz, resulting in a scanned mass range from approximately 50 to 500 m/z. The dynamic ionization function of the TMS detector resulted in scan rates of 10–15 Hz. Measured mass resolution of 0.55 at m/z 91 (toluene) and 0.80 at m/z 222 (diethylphthalate) was typical for these experiments.
The GC–TMS system is totally self-contained, weighs less than 28 lbs, is battery (24 V) operated, has an onboard helium GC carrier gas supply cartridge (2500 psig, 90 cc), and is hand-portable. The system is packaged in a hardened case with dimensions of 18.5 in. (wide) × 14 in. (deep) × 7 in. (high). The average power consumption of the instrument is ~75 W per sample analysis. When operating under battery power, the system is capable of analyzing ~50 to 75 consecutive samples on a single set of batteries. The system also can be operated with line voltage using an AC-to-DC power converter. Using the temperature program above, the GC–TMS sample analysis cycle time was ~5 min, including GC cool-down time and data processing.
Automated Compound Identification
A PC-based operating software application, CHROMION-1 (Torion Technologies Inc.) was used to operate the GC–TMS system. This software application enables the user to edit the GC–TMS method and calibration parameters and develop analyte libraries for automated detection and identification of targeted chemical compounds based upon their characteristic retention times and mass spectra. Embedded peak deconvolution software (Ion Signature, North Smithfield, Rhode Island) was used to identify CWA and TIC target analytes, including coeluted peaks. A user-defined CWA/TIC library was developed and used by the GC–TMS system for automated detection and compound identification. Results were reported in an easy-to-understand tabular format that is displayed on the LCD screen.
Results
GC–TMS data have been obtained for several groups of compounds, including chemical warfare agents, explosives, and environmental contaminants, using the GC–TMS instrument. Figure 1 shows the GC–TMS analysis of several TICs and CWA simulants after sampling with SPME. Figure 2 shows the LCD screen display table demonstrating the automated library detection results of the 12 target analytes in this sample. Excellent chromatographic resolution for this separation of TICs and CWA simulants is observed even though the analysis is completed in less than 150 s. Note that although tetrachloroethylene (3) and 1,2-dibromoethane (4) are coeluted under the rapid temperature program LTM GC conditions, their identification is achieved and reported (Figure 2) using the embedded deconvolution–identification software.
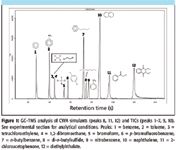
Figure 1
Figures 3 and 4 show the detection and identification of four CWAs at concentrations in isopropanol below standard surety levels used for research, development, testing, and evaluation. Figure 2 shows the results of the auto-identification of VX from this analysis. The mass spectrum for each compound is shown in the inset box. The LTM GC capillary column provided sufficient retention for all of the CWAs with adequate separation from the isopropanol solvent peak. For these compounds, neither the TMS soft or hard solvent delay functions were used. Even at low concentrations and with short SPME sampling times (10–30 s), all four CWAs were detected with signal-to-noise ratios well above the lower detection threshold for the sampling protocol used in this study.

Figure 2
Although SPME sample introduction into a GC is not generally considered a quantitative technique by many, it offers important advantages for field sampling and analysis. Early detection of chemical threats is the first priority for the types of field measurement considered here. SPME provides adequate capability in terms of its ability to absorb CWA and TIC analytes at low enough levels to provide warning at concentrations hazardous to human health. SPME injection also affords applicability to both volatile (VOC) and semivolatile (SVOC) organic compounds, unlike other membrane-based sample introduction technologies used in field GC–MS instrumentation. Another major advantage of applying this type of injection technology in field monitoring is that the SPME fiber has a finite absorption capacity and, therefore, protects the GC–TMS system from being overloaded and fouled to a point of inoperability. This protection assures the nontechnical user of continued operation in critical conditions.
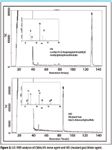
Figure 3
Although a majority of compounds demonstrate excellent spectral comparison, the TMS mass spectra of some compounds can differ slightly in relative fragment ion abundances when compared with spectra from other types of mass spectrometers (for example, quadrupole or magnetic sector instruments) that are found in reference libraries. For example, some compounds demonstrate increased molecular ion abundance in their mass spectrum on the TMS. This molecular ion information can be very useful for unknown analyte identification in situations in which a compound's breakdown products have similar mass spectra (such as VX). Together with mass spectral fragment information, the molecular ion information can be used to help identify an unknown. Using retention time and the mass spectra, the compound can then be included in the target compound library. Although the spectral fingerprints for some compounds differ slightly from standard libraries, the same principal fragment ions present in EI spectra are typically observed, which affords comparison to mass spectral reference libraries for unknown compound identification purposes when appropriate search algorithms are used.
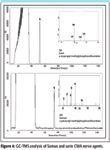
Figure 4
Figures 5–8 compare the mass spectra from the GC–TMS system with those from a widely used reference library for four CWAs and CWA simulants. The comparison of a VX mass spectrum (Figure 5) from the TMS system with the National Institute of Standards and Technology (NIST) library spectrum demonstrates that the TMS system can produce near-identical NIST spectra. Of course, this is an advantage when searching for compound identifications against reference libraries.
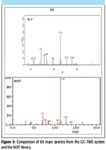
Figure 5
Three examples of different levels of variations for mass spectra from the TMS system and the NIST library can be seen in Figures 6–8. Figure 6 is a spectral comparison for the chemical nerve agent Soman or GD and demonstrates that nearly all of the major ions in the NIST spectrum are present in the TMS spectrum. There are, however, two additional major ions (m/z 117 and 85) present in the TMS spectrum that are not present in the NIST spectrum. It is beyond the scope of this article to provide interpretation of the molecular structures responsible for these two ions, but it is sufficient to note that these are additional characteristic ions that can be used in the identification library for Soman using this field-portable MS device.
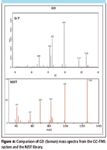
Figure 6
Figure 7 is a mass spectral comparison between NIST and the TMS spectra for bis(2-chloroethyl) ether. It is apparent from the isotopic ion clusters in both spectra that this is a chlorinated compound. While both spectra exhibit isotopic clusters at m/z 63 and 93, there are also isotopic ion clusters at m/z 107 and 143 in only the TMS spectrum. The cluster at m/z 143 is from the molecular ion. The presence of the molecular ion cluster for this compound can provide supplemental and useful confirmatory data to the user, as mentioned earlier.
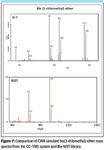
Figure 7
A TMS–NIST mass spectral comparison for pinacolyl alcohol is shown in Figure 8. This example shows that fairly significant differences in the relative abundances of ions in the TMS system as compared with the NIST spectra are observed. While all of the key identifier ions are present in both spectra, they vary in abundance. This type of phenomenon is demonstrated most frequently in relatively polar compounds, such as the low molecular weight alcohol shown in this example.
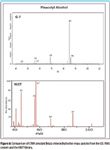
Figure 8
These variations in mass fragmentation patterns discussed here are not problematic, however, because the hand-portable GC–TMS system utilizes a TMS instrument-specific mass spectral library. In other words, when standard compounds are analyzed on the GC–TMS system, a library file is built using the characteristic ions from the TMS mass spectra. Coupled with the retention time information for the target analyte, compound identifications are achieved with a high degree of confidence.
Conclusions
The combination of SPME sampling methodology with GC–TMS for analyte detection and identification provides rapid and accurate determination of chemical threats in a hand-portable design. The SPME–GC–TMS instrument has been shown to be a reliable, selective, and sensitive method for detection of CWAs, CWA simulants, and TICs in less than 150 s. The application of SPME–GC–TMS to a field environment has been demonstrated. The ability to analyze a wide range of sample types from gases to dissolved solids positions this technology as an ideal methodology for the analysis of both VOC and SVOC target analytes in environments that exclude laboratory-based GC–MS instruments. A user's ability to create custom target compound libraries using TMS spectral fragment information together with deconvolution technology expands the capabilities of GC–TMS beyond typical NIST-type library matching.
Douglas W. Later, Tiffany C. Wirth, Christopher R. Bowerbank, and Edgar D. Lee are with Torion Technologies Inc., American Fork, Utah. Charles S. Sadowski is with Smiths Detection, Danbury, Connecticut.
References
(1) H.H. Hill and S.J. Martin, Pure Appl. Chem. 74, 2281–2291 (2002).
(2) G.A. Iceman and J.A. Stone, Anal. Chem. 76, 391A–397A (2004).
(3) Y. Seto, M. Kanamori-Kataoka, K. Tsuge, I. Ohsawa, K. Matsushita, H. Sekiguchi, T. Itoi, K. Iura, Y. Sano, and S. Yamashiro, Sens. Actuators, B 108, 193–197 (2005).
(4) W.E. Steiner, S.J. Klopsch, W.A. English, B.H. Clowers, and H.H. Hill, Anal. Chem. 77, 4792–4799 (2005).
(5) W.D. Smith, Anal. Chem. 74, 462A–466A (2002).
(6) J.A. Syage, B.J. Nies, M.D. Evans, and K.A. Hanold, J. Am. Soc. Mass Spectrom. 12, 648–655 (2001).
(7) J.A. Diaz, P. Daley, R. Miles, H. Rohrs, and D. Polla, Trends Anal. Chem. 23, 314–321 (2004).
(8) G.E. Patterson, A.J. Guymon, L.S. Riter, M. Everly, J. Griep-Raming, B.C. Laughlin, Z. Ouyang, and R.G. Cooks, Anal. Chem. 74, 6145–6153 (2002).
(9) M.G. Blain, L.S. Riter, D. Cruz, D.E. Austin, G. Wu, W.R. Plass, and R.G. Cooks, Int. J. Mass Spectrom. 236, 91–104 (2004).
(10) L. Gao, Q. Song, G.E. Patterson, R.G. Cooks, and Z. Ouyang, Anal. Chem. 78, 5994–6002 (2006).
(11) M. Fico, M. Yu, Z. Ouyang, R.G. Cooks, and W.J. Chappell, Anal. Chem. 79, 8076–8082 (2007).
(12) S.A. Lammert, A.A. Rockwood, M. Wang, M. Lee, E.D. Lee, S.E. Tolley, J.R. Oliphant, J.L. Jones, and R.W. Waite, J. Am. Soc. Mass Spectrom. 17, 916–922 (2006).
(13) J.A. Contreras, J.A. Murray, S.E. Tolley, J.L. Oliphant, D.H. Tolley, S.A. Lammert, E.D. Lee, D.W. Later, and M.L. Lee, J. Am. Soc. Mass Spectrom. 19, 1425–1434 (2008).
(14) D.E. Austin, M. Wang, S.E. Tolley, J.D. Maas, A.R. Hawkins, A.L. Rockwood, H.D. Tolley, E.D. Lee, and M.L. Lee, Anal. Chem. 79, 2927–2932 (2007).
(15) N.S. Arnold, J.P. Dworzanski, S.A. Sheya, W.H. McCleannen, and H.L.C. Meuzelaar, Field Anal. Chem. Tech. 4, 219–238 (2000).
(16) A.L. Makas and M.L. Troshkov, J. Chromatogr., B 800, 55–61 (2004).

High-Speed Laser MS for Precise, Prep-Free Environmental Particle Tracking
April 21st 2025Scientists at Oak Ridge National Laboratory have demonstrated that a fast, laser-based mass spectrometry method—LA-ICP-TOF-MS—can accurately detect and identify airborne environmental particles, including toxic metal particles like ruthenium, without the need for complex sample preparation. The work offers a breakthrough in rapid, high-resolution analysis of environmental pollutants.
The Fundamental Role of Advanced Hyphenated Techniques in Lithium-Ion Battery Research
December 4th 2024Spectroscopy spoke with Uwe Karst, a full professor at the University of Münster in the Institute of Inorganic and Analytical Chemistry, to discuss his research on hyphenated analytical techniques in battery research.
Portable and Wearable Spectrometers in Our Future
December 3rd 2024The following is a summary of selected articles published recently in Spectroscopy on the subject of handheld, portable, and wearable spectrometers representing a variety of analytical techniques and applications. Here we take a closer look at the ever shrinking world of spectroscopy devices and how they are used. As spectrometers progress from bulky lab instruments to compact, portable, and even wearable devices, the future of spectroscopy is transforming dramatically. These advancements enable real-time, on-site analysis across diverse industries, from healthcare to environmental monitoring. This summary article explores cutting-edge developments in miniaturized spectrometers and their expanding range of practical applications.
Mass Spectrometry for Forensic Analysis: An Interview with Glen Jackson
November 27th 2024As part of “The Future of Forensic Analysis” content series, Spectroscopy sat down with Glen P. Jackson of West Virginia University to talk about the historical development of mass spectrometry in forensic analysis.
Detecting Cancer Biomarkers in Canines: An Interview with Landulfo Silveira Jr.
November 5th 2024Spectroscopy sat down with Landulfo Silveira Jr. of Universidade Anhembi Morumbi-UAM and Center for Innovation, Technology and Education-CITÉ (São Paulo, Brazil) to talk about his team’s latest research using Raman spectroscopy to detect biomarkers of cancer in canine sera.