Recent Trends in the Use of LC-MS-MS for the Testing of Food and Environmental Contaminants
This article describes trends of using LC-MS-MS for multicompound analysis of food and environmental contaminants.
GC–MS and LC–MS-MS are powerful analytical tools for the analysis of food and environmental contaminants. Recently, LC–MS-MS has gained popularity for multitargeted screening, quantitation, and identification because of its ability to analyze a wider range of compounds. This article describes trends of using LC–MS-MS for multicompound analysis and discusses aspects of sample preparation, fast liquid chromatography, matrix effects during ionization, and confident compound identification using MS-MS.
Gas chromatography (GC) and liquid chromatography (LC) are essential analytical tools in modern food and environmental laboratories. A GC instrument equipped with element selective detectors or mass spectrometry (MS) has been the traditional method of choice for residue and contaminant analysis, with GC–MS being the preferred technique for the analysis of less polar and more volatile compounds, such as organochlorine pesticides, dioxins, and polychlorinated biphenyls (Figure 1). But time-consuming and labor-intensive sample preparation and derivatization steps and long chromatographic run times have led to the increased adoption of LC with tandem mass spectrometry (LC–MS-MS). Initially, LC–MS-MS was used primarily as a complementary tool for the analysis of compounds difficult or impossible to analyze by GC. But LC–MS-MS has gained popularity for quantitation due to its high selectivity and sensitivity in multiple reaction monitoring (MRM) mode. MRM works like a double mass filter. Only molecules with the correct molecular ion filtered in Q1 and the correct product ion filtered in Q3 can reach the detector and, thus, very little noise and matrix interferences are detected. As such, LC–MS-MS using electrospray ionization (ESI) has quickly become the analytical technique of choice for the analysis of polar, semivolatile, and thermally labile compounds, such as pesticides, mycotoxins, pharmaceuticals, personal care products, and drugs of abuse. More recently, LC–MS-MS has replaced traditional GC methods for multicompound screening because of its ability to analyze a wider range of food and environmental contaminants in a single analysis (1,2).
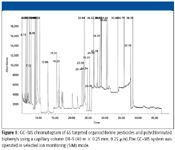
Figure 1
What are the big challenges in residue analysis laboratories using LC–MS-MS? There is a continuing demand to test for a larger number of compounds, with lower detection limits, in a wider range of matrices, in shorter time, all without sacrificing data quality. What recent LC–MS-MS developments help to address these challenges?
Sampling and Extraction
The demand to extend the scope of methods to screen for and quantify hundreds of targeted analytes requires using very generic extraction procedures. QuEChERS (quick, easy, cheap, effective, rugged, and safe) has become the most popular method to extract matrices with low fat content, such as fruits and vegetables. QuEChERS is based upon acetonitrile extraction with partitioning using MgSO4 and followed by a dispersive SPE cleanup. This procedure has been applied successfully to extract pesticides, antibiotics, mycotoxins, and other compounds effectively and reproducibly from a variety of food commodities (3–5).
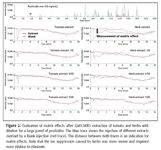
Figure 2
However, it is important to back up such generic extraction methods with a robust and high-sensitivity MS-MS detector, especially when dry and very complex matrices, such as herbs, tea, tobacco, and spices, must be analyzed. Generic extraction procedures also tend to extract many matrix components that can cause matrix effects, such as signal suppression or enhancement during ionization. As such, these matrix effects must be properly evaluated during method validation. A simple but powerful procedure to identify matrix effects is to infuse an internal standard, postcolumn, while injecting the matrix extract into the LC–MS-MS system (6). Figure 2 shows the typical results of such an experiment. The overlay of a matrix injection (blue) with a blank injection (red) reveals matrix effects. It is important to note that matrix effects are dependent upon the extracted matrix, extraction protocol, and chromatographic separation. One strategy to minimize or even eliminate matrix effects is simple dilution. In the example presented, a dilution factor of 1/5 is shown to eliminate all of the relevant matrix effects when analyzing pesticides in tomato, while the analysis of herbs required further dilution. In drinking water analysis, another recent trend is to eliminate sample preparation completely and to inject water samples directly into the LC–MS-MS system. This procedure also requires high-sensitivity detection to match required and challenging limits of detection, which can be as low as 0.1 µg/L (Figure 3).
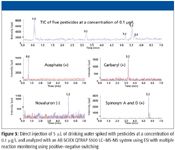
Figure 3
Liquid Chromatography
The LC separation employed also requires generic conditions to allow the analysis of a wide range of targeted compounds in a single injection. Typically, reversed-phase LC (C18, C8, or polar modified phases) with a gradient of water–methanol or water–acetonitrile and volatile buffers, such as formic acid or ammonium formate, is used to separate analytes and to separate analytes from matrix components.
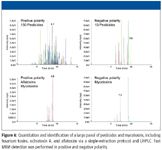
Figure 4
The current chromatography trend is to use ultrahigh performance liquid chromatography (UHPLC). UHPLC systems use columns packed with small particles, typically less than 2 µm. They can be operated at high flow rates and high pressure, resulting in narrower peaks. In addition to optimized peak shape and improved separation, UHPLC can be used to shorten analytical run times dramatically (Figure 3). However, these narrow chromatographic peaks, in combination with the demand to detect and quantify an increasing number of compounds per analysis, place an even heavier burden on mass spectral detection. UHPLC with peak width of as little as 5 s and the need to acquire enough data points across the peak for accurate and reproducible quantitation, while detecting hundreds of MRM transitions, requires fast MS-MS hardware — especially a fast collision cell allowing the use of short dwell times and pause times — and clever software to schedule MRM transitions automatically based upon retention times. Figures 4 and 5 show examples of combining UHPLC with fast MRM measurements to detect mycotoxins and pesticides.
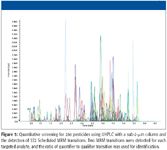
Figure 5
Compound Identification
Despite the high selectivity of multiple reaction monitoring, there is always a risk of false positive or false negative findings due to interfering matrix signals. Accordingly, additional qualitative information is needed for compound identification. Typically, a second MRM is monitored per analyte with the ratio of quantifier to qualifier transition calculated for each unknown sample and compared with the MRM ratio of standards. Various guidelines, such as the European Commission Decision 2002/657/EC, define tolerance levels of MRM ratios for compound identification. As an alternative, identification can be performed using full-scan MS-MS experiments and library searching to compare the unknown with a standard spectrum.
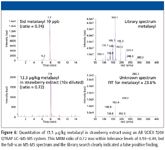
Figure 6
Figure 6 illustrates the benefit of using an MS-MS spectrum and library searching versus an MRM ratio for identification. The MRM ratio suggested the presence of metalaxyl in strawberry extract, but the corresponding MS-MS spectrum and the library search result clearly identified a false positive finding. Metalaxyl was not present in this strawberry sample. This example shows that the molecular fingerprint of the MS-MS contains much more compound information than a single MRM ratio and thus is a useful tool to minimize false positive and false negative findings.
Summary
GC–MS and LC–MS-MS are powerful analytical tools for the quantitation and identification of food and environmental contaminants, such as pesticides, mycotoxins, pharmaceuticals, personal care products, and drugs of abuse.
LC–MS-MS with electrospray ionization and operating in the multiple reaction monitoring mode is a standard technique for targeted quantitation of polar compounds because of its well-known selectivity and sensitivity. Furthermore, its popularity has increased due to the ability to screen for, quantify, and identify large panels of analytes across different compound classes, such as the ability to analyze hundreds of pesticides and mycotoxins in a single analysis.
Recently developed extraction procedures, such as QuEChERS, allow the efficient and reproducible extraction of hundreds of compounds from simple to complex matrices. In addition, the use of direct injection of drinking water into LC–MS-MS has gained in popularity to avoid time-consuming and labor-intensive sample preparation. However, as discussed, high-sensitivity LC–MS-MS instrumentation is needed to match the required limits of detection and to allow dilution of sample extracts to minimize matrix effects.
UHPLC in combination with small-particle-size columns is used frequently to improve chromatographic peak shape and separation and to increase throughput by shortening analysis times. However, to take advantage of these virtues, the MS-MS hardware must allow the use of short MRM dwell times, and the software must be able to schedule MRM transitions to acquire a sufficient number of data points across narrow UHPLC peaks for accurate and reproducible quantitation.
Finally, there is an increased demand for compound identification. While high-resolution MS detectors, such as TOF detectors, are powerful tools for empirical formula assignment, the capability to perform MS-MS fragmentation is needed to positively identify an analyte from others of identical molecular weight. Typically, the ratio of two MRM transitions is used for identification, but the acquisition of full-scan MS-MS spectra and library searching provides an added degree of confidence and reduces the risk of false positive and false negative results.
Although high-sensitivity LC–MS-MS can provide better selectivity and sensitivity, is able to analyze a wider molecular and polarity range of compounds, and reduces the need for extensive sample preparation, and thus, has become a preferred technique to GC–MS, both techniques often are complementary. Both LC–MS-MS and GC–MS are needed today and will be needed in the future to cover all analytes and compound classes of interest and to fulfill the need of identification and confirmation.
Acknowledgment
The authors wish to thank Paul Yang (Ministry of Environment, Toronto, Canada) and Jürgen Kunze and Angela Giger (SGS, Hamburg, Germany) for providing example chromatograms.
André Schreiber is with Applied Biosystems, a division of Life Technologies, Concord, Ontario, Canada. Kristin von Czapiewski is with Applied Biosystems, a division of Life Technologies, Darmstadt, Germany.
References
(1) L. Alder, K. Greulich, G. Kempe, and B. Vieth, Mass Spectrom. Rev. 25, 838–865 (2006).
(2) E. Scherbaum, M. Anastassiades, E. Schüle, N. Bauer. K. Ellendt. and M. Wieland, poster presentation at 7th European Pesticide Residue Workshop, Berlin, Germany (2007).
(3) M. Anastassiades, S.J. Lehotay, D. Stajnbaher, and F.J. Schenck, J. AOAC Int. 86, 412–431 (2003).
(4) S.J. Lehotay, J. AOAC Int. 90, 485–520 (2007).
(5) www.quechers.com
(6) R. Bonfiglio, R. King, T. Olah, and K. Merkle, Rapid Commun. Mass Spectrom. 13, 1175–1185 (1999)

High-Speed Laser MS for Precise, Prep-Free Environmental Particle Tracking
April 21st 2025Scientists at Oak Ridge National Laboratory have demonstrated that a fast, laser-based mass spectrometry method—LA-ICP-TOF-MS—can accurately detect and identify airborne environmental particles, including toxic metal particles like ruthenium, without the need for complex sample preparation. The work offers a breakthrough in rapid, high-resolution analysis of environmental pollutants.
Trends in Infrared Spectroscopic Imaging
September 13th 2013An interview with Rohit Bhargava, winner of the 2013 Craver Award. This interview is part of the 2013 podcast series presented in collaboration with the Federation of Analytical Chemistry and Spectroscopy Societies (FACSS), in connection with SciX 2013, the federation?s North American conference.
Mass Spectrometry for Forensic Analysis: An Interview with Glen Jackson
November 27th 2024As part of “The Future of Forensic Analysis” content series, Spectroscopy sat down with Glen P. Jackson of West Virginia University to talk about the historical development of mass spectrometry in forensic analysis.