Reducing the Impact of Spectral Interferences on the Determination of Precious Metals in Complex Geological Matrices Using DRC ICP-MS
Special Issues
The potential for signal drift, matrix suppression, and spectral interference, in addition to demanding sample preparation, can make geological matrices some of the most difficult to analyze by conventional inductively coupled plasma-mass spectrometry.
Geochemists represent some of the most demanding users of inductively coupled plasma mass spectrometry (ICP-MS). Invariably they are looking for ultratrace levels in the presence of large concentrations of major elements in digested rock samples. This alone presents difficulties for the sample introduction and interface region because of the potential for signal drift caused by the geological material depositing on the cones and ion lens system (1). In addition, if there are large concentrations of high-mass elements present in the sample, they can cause severe matrix suppression on the analyte masses (2). Another potential problem is that major and trace components in the sample can combine with argon-, solvent-, and acid-based species to produce quite severe polyatomic, isobaric, doubly charged, and oxide-based spectral interferences (3). When this is combined with the extremely demanding sample preparation methods using highly corrosive materials like concentrated aqua regia (hydrochloric acid–nitric acid, HCl/HNO3), hydrofluoric acid (HF), and fusion mixtures to dissolve the samples, the result is that geological matrices are some of the most difficult to analyze by ICP-MS.
Geological Samples
The determination of low levels of precious metals was one of the very first applications that attracted geochemists to ICP-MS (4), mainly because of the lengthy sample preparation and analysis times involved with previously used techniques including atomic absorption (AA), ICP-optical emission spectrometry (OES) and neutron activation analysis (NAA) (5, 6). However, even though ICP-MS offered significant benefits over these techniques, it was not without its problems because of the potential for spectral interferences from matrix components in the sample. In addition, refractory and rare earth elements in rocks, minerals, and natural water samples have a tendency to readily form oxide species, which potentially could interfere with the precious metal analytes. For that reason, instrument parameters usually need to be optimized, depending upon the analyte levels being determined and the kinds of interferences present in the sample.

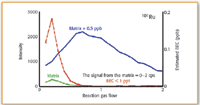
Figure 1. Optimized NH3 reaction gas flow rates for 101Ru, showing nickel-copper-chloride matrix (green), matrix plus 0.5 µ/L analyte (blue) and calculated background equivalent concentration (BEC) (red).
For example, plasma power and nebulizer gas flows often need to be adjusted to minimize the formation of oxide species. This is necessary because an oxide or hydroxide species of one element can interfere spectrally with the analyte element. The problem can be alleviated by using a sample desolvation device, such as a chilled spray chamber, to reduce oxide formation but unfortunately cannot be eliminated completely. For that reason, to obtain the best detection capability for precious metals in geological matrices, instrument sensitivity often must be sacrificed in order to maximize the reduction of oxide and other spectral interferences and even then, mathematical correction equations often have to be applied (7).
Use of Collision–Reaction Cells
However, with the recent development of collision–reaction cell technology to reduce or avoid the formation of problematic polyatomic spectral interferences, geochemists have another powerful analytical tool at their disposal. Commercialized about five years ago, collision–reaction cells have proven themselves to be an extremely useful addition to quadrupole technology to reduce the effects of troublesome matrix and argon-derived polyatomic interferences (8).
Initially used to improve the detection capability of semiconductor-significant elements such as Fe, Ca, and K (9), collision–reaction cell technology has expanded its applicability to other elements and has gained wider acceptance in the environmental (10) and clinical application segments (11). As more and more applications move into the public domain, geochemists are beginning to take an interest in collision–reaction cells to reduce the formation of the myriad of spectral interferences associated with the determination of low analyte levels in rocks and mineral samples.
One such development that is gaining a great deal of attention because of its interference reduction capabilities, is dynamic reaction cell (DRC) technology. The dynamic reaction cell, which previously has been described in the open literature (12), is a pressurized quadrupole positioned before the analyzer quadrupole. A highly reactive gas such as ammonia (NH3) is supplied to the cell, where ion-molecule chemistry takes place. Through various reaction mechanisms, the gaseous molecules react with the interfering ions to convert them either into species of different mass than the analyte or form an ionic complex–cluster with the analyte at a higher mass than the interfering ion. The analyte ion then emerges from the dynamic reaction cell free of its interference and enters the analyzer quadrupole for conventional mass separation.
The advantages of using a quadrupole in the reaction cell for geological-type samples is that the ion stability regions are well defined compared with higher order multipoles used in simple collision cells. As a result, the quadrupole inside the reaction cell can be operated with a narrower mass transmission window, not as just an ion guide. Therefore, by optimization of the quadrupole electrical fields (known as dynamic bandpass tuning), unwanted reactions between the gas and the geological sample matrix and solvent, which can generate new interferences, are prevented, while transmission of the analyte ions is not affected. Every time an analyte and interfering ion enters the dynamic reaction cell, the dynamic bandpass of the quadrupole is optimized automatically for that specific analysis and then changed on-the-fly for the next analyte. The added benefit of this approach for multielement analysis is that the instrument can be operated in both DRC and normal modes. By incorporating stabilization times in the method, different gases (and gas flows) can be used for the DRC elements, while the normal (non-DRC) mode can be used for the other elements in the same multielement run.
Determination of Platinum Group Elements
An ELAN DRC II (PerkinElmer SCIEX, Concord, ON, Canada) was used to carry out an investigation into the determination of the platinum group elements (PGE) in two notoriously difficult matrices, copper-bearing ores and precious metal-containing minerals. In the case of copper ores, which are digested in concentrated hydrochloric acid to remove the copper, high levels of chloride, copper and nickel ions together with argon ions from the plasma form polyatomic complexes, which interfere with the determination of rhodium, ruthenium, and palladium. This is emphasized in Table I, which shows some of the most common polyatomic spectral interferences in a copper–nickel chloride matrix and the PGE they potentially can interfere with.

Table I. The major isotopes of ruthenium, rhodium, and palladium together with some of the most common polyatomic spectral interferences in a copper-nickel chloride matrix.
In the analysis of digested minerals, the refractory metals hafnium, zirconium, and tantalum readily form oxides and interfere with the isotopes of palladium, gold, and platinum. This is shown in Table II.

Table II. Isotopes of palladium, gold, and platinum with potential refractory metal oxide interferences.
Instrumental Conditions
To test the capability of the dynamic reaction cell to reduce or avoid the interferences expected in a copper ore, a synthetic sample was prepared containing 0.5 µ/L of ruthenium, rhodium, and palladium dissolved in a matrix of 80 mg/L Ni and 40 mg/L Cu in 1% HCl, which represented typical analyte and matrix levels in solution.
To test the instrument's ability to reduce or avoid refractory oxide interferences in a digested rock, a synthetic sample was prepared containing approximately 0.5 µ/L of palladium, gold and platinum in 2 µ/L of Ta and Hf, together with 200 µ/L Zr in 0.5% HCl–0.33% HNO3, which represented typical analyte and matrix levels in solution.

Table III. Sampling conditions for both the copper-nickel chloride and digested rock matrices.
The sample introduction components and conditions for both sample-types are shown in Table III. These instrumental conditions then were used to optimize the gas flows and quadrupole electrical fields in order to maximize the number of analyte ions and reduce the formation of interfering species in the dynamic reaction cell.
DRC Optimization of Copper-Nickel-Chloride Matrix
In a series of experiments, which are beyond the scope of this study, ammonia was chosen as the reaction gas to reduce the formation of the kinds of Cu-Ni-Cl polyatomic spectral interferences shown in Table I. In these experiments,
101
Ru,
103
Rh, and
105
Pd were selected as the best isotopes to continue the investigation. The optimized NH
3
reaction gas flow rates for the nickel–copper–chloride matrix (green), matrix plus 0.5 µ/L analytes (blue) and calculated background equivalent concentration (BEC) (red) for all three masses, are shown in Figures 1–3 respectively.

Figure 2. Optimized NH3 reaction gas flow rates for 103Rh, showing nickel-copper-chloride matrix (green), matrix plus 0.5 µ/L analyte (blue) and calculated BEC (red).
It can be seen in all three plots that as the NH3 reaction gas flow rate increases, the sensitivity of the analyte in the matrix (blue plot) also increases (up to about 0.5–0.6 mL/min), while the background of the matrix (green plot) decreases gradually. At about 1 mL/min gas flow, the analyte signal compared with background appears to be at a maximum and as a result the calculated BEC (red plot) is at its lowest. It can be seen from the plots that both ruthenium and rhodium generated single-digit ppt BEC values, while palladium was slightly high at 10–20 ppt.

Figure 3. Optimized NH3 reaction gas flow rates for 105Pd, showing nickel-copper-chloride matrix (green), matrix plus 0.5 µ/L analyte (blue), and calculated BEC (red).
It should be noted that BEC is defined as the apparent concentration for the background signal based upon the sensitivity of the element at a specified mass. The lower the BEC value, the more easily a signal generated by an element can be discerned from the background. Many analysts believe that the BEC is a more accurate indicator of the performance of an ICP-MS system, particularly as a means of comparing background reduction techniques (13).

Figure 4. Optimized CH3F reaction gas flow rates for 105Pd, showing the Ta-Hf-Zr acid matrix (green), matrix plus 0.5 µ/L analyte (blue), and calculated BEC (red).
DRC Optimization of Digested Rock–Refractory Element Matrix
In another series of experiments, which also are beyond the scope of this study, methyl fluoride (CH
3
F) was chosen as the reaction gas to minimize the impact of the kinds of refractory oxide polyatomic spectral interferences described earlier. To overcome these interference problems, the CH
3
F reaction gas is utilized in two different ways. First, it is used to break up the
90
Zr
16
O
+
interference, which enables the use of
106
Pd
+
for quantitation. However, for the quantitation of gold and platinum, advantage is taken of the DRC's ability to measure gold and platinum cluster ions,
197
Au
12
CH
3
19
F
+
at 231 amu and
194
Pt
12
CH
19
F
+
at 226 amu, respectively. This use of ion-molecule chemistry (14) avoids the hafnium and tantalum oxides, which interfere spectrally with monoisotopic gold and the major isotopes of platinum, as shown in Table II.

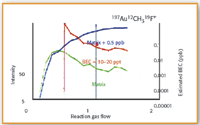
Figure 5. Optimized CH3F reaction gas flow rates for 197 Au 12 CH319 F + , showing the Ta-Hf-Zr acid matrix (green), matrix plus 0.5 µ/L analyte (blue), and calculated BEC (red).
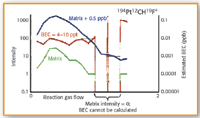
CH3F gas flow optimization plots for all three masses are shown in Figures 4–6. The background intensity of the matrix composed of 2 µ/L Ta, 2 µ/L Hf and 200 µ/L Zr in 0.5% HCl–0.33% HNO3 is shown by the green line. The intensity of the matrix spiked with 0.5 µ/L of the analyte is shown by the blue line, while the calculated BEC from these two signals is represented by the red line.

Figure 6. Optimized CH3F reaction gas flow rates for 194Pt12CH19F+ showing the Ta-Hf-Zr acid matrix (green), matrix plus 0.5 µ/L analyte (blue), and calculated BEC (red).
It can be seen in all three plots that as the CH3F reaction gas flow rate increases the sensitivity of the analyte in the matrix (blue plot) also increases, while the background of the matrix (green plot) gradually decreases. In the case of the optimization of palladium and gold, the best BEC value (red plot) is obtained at 1.4–1.5 mL/min. However, with platinum, the lowest BEC value (red plot) is reached at a much lower gas flow (approx 0.5 mL/min). At the optimum gas flows, palladium and platinum generated BEC's in the single-digit ppt range, while gold was slightly higher at 10–20 ppt. This means that in a multielement run, to achieve the best detection capability, Pd and Au would in all probability be measured at the same reaction gas flow of 1.5 mL/min, while Pt would be determined at a much lower rate of 0.5 mL/min.
Validation of DRC Methodology
To validate this method, an aqua regia–digested rock sample (supplied by a geological testing laboratory) was analyzed for low levels of palladium, gold, and platinum using DRC-ICP-MS technology. The sample previously had been analyzed by conventional ICP-MS and generated spurious values, which were not supported by other analytical techniques. For this reason, the sample was analyzed three different ways — on its own, spiked with known concentrations of PGE's, and finally spiked with high levels of the refractory elements Hf, Zr, and Ta to see what effect they had on the PGE analyte concentrations. The results in micrograms per liter in solution are shown in Table IV.

Table IV. A spike recovery and refractory element interference study of palladium, gold, and platinum in a digested rock sample using DRC technology.
It can be seen from this data that the conventional ICP mass spectrometer gave much higher values than the results generated by the dynamic reaction cell instrument. The 0.2-µ/L spike data showed that palladium and gold were being recovered extremely well, while platinum was showing a more positive bias. The interference study sample also confirmed these results showing excellent spike recoveries for palladium and platinum. The high value for platinum indicates that the method might need to be fine-tuned. However, even though more work is required to further validate this DRC method, it is clear that conventional ICP-MS gives erroneous results because of the spectral interferences generated by the sample.
Conclusions
This study has shown that an ICP mass spectrometer fitted with a dynamic reaction cell can be used to determine low levels of platinum group elements in complex geological samples. By careful selection of the reaction gas, optimum gas flow rates and the best dynamic bandpass tuning conditions, advantage can be taken of the power of DRC technology to either break up the polyatomic interfering species or create new cluster ions for successful quantitation of the analyte. This study represents a brief look at the enormous potential of using ion-molecule chemistry to reduce the impact of problematic spectral interferences when analyzing complex geological matrices. There is no question that this kind of capability, together with the recognized benefits of ICP-MS, will further enhance the credibility of the technique in the geological analytical community.
References
1. D.J. Douglas,
Can. J. of Spectrosc.
34
(2) (1989).
2. E.R. Denoyer, D. Jacques, E. Debrah, and S.D. Tanner, Atomic Spectrosc.16(1) (1995).
3. F.E. Lichte, A.L. Meier, and J.G. Crock, Anal. Chem.59(8), 1150–1157 (1987).
4. H.P. Longerich, G.A. Jenner, and S.E. Jackson, Chem. Geol.83, 105 (1990).
5. C. Riddle, A. Vander Voet, and W. Doherty, Geostandards Newsletter12(1), 203 (1988).
6. F.E. Beamish and J.C. Van Loon, Analysis of Noble Metals (Academic Press, New York, 1977), p. 178.
7. F.E. Lichte, A.L. Meier and J.G. Crock, Anal. Chem.59(8), 1150–1157 (1987).
8. P. Turner, T. Merren, J. Speakman, and C Haines, Plasma Source Mass Spectrometry: Developments and Applications ISBN 0-85404-727-1, 28–34 (1996).
9. M. Radle, H. Lian, B. Nicoley, and A.J. Howard, Semicond. Int., July, 2001.
10. H. Gurleyuk, R.C. Brunette, and C.R. Howard, Spectroscopy20(1), 24–31, (2005).
11. K. Neubauer and U. Voellkopf, Atomic Spectrosc.20(2), 64–68 (1999).
12. S.D. Tanner and V.I. Baranov, Atomic Spectrosc.20(2), 45–52 (1999).
13. J.M. Collard, K. Kawabata, Y. Kishi, and R. Thomas, Micro, January, (2002).
14. D.S. Bollinger and A.J. Schleisman, Atomic Spectrosc.20(2), 60–63 (1999).
PerkinElmer SCIEX, Dynamic Reaction Cell and DRC are trademarks of PerkinElmer, Inc.
ELAN is a registered trademark of MDS Sciex, a division of MDS, Inc.
Steven Beres, Luc Dionne, and Kenneth Neubauer are with PerkinElmer Life and Analytical Sciences (Shelton, CT). Robert Thomas is with Scientific Solutions (Gaithersburg, MD). E-mail: thomasrj@bellatlantic.net.

High-Speed Laser MS for Precise, Prep-Free Environmental Particle Tracking
April 21st 2025Scientists at Oak Ridge National Laboratory have demonstrated that a fast, laser-based mass spectrometry method—LA-ICP-TOF-MS—can accurately detect and identify airborne environmental particles, including toxic metal particles like ruthenium, without the need for complex sample preparation. The work offers a breakthrough in rapid, high-resolution analysis of environmental pollutants.
Trending on Spectroscopy: The Top Content of 2024
December 30th 2024In 2024, we launched multiple content series, covered major conferences, presented two awards, and continued our monthly Analytically Speaking episodes. Below, you'll find a selection of the most popular content from Spectroscopy over the past year.