Shedding New Light on Forensic Timelines
Spectroscopy
The development of novel, nondestructive technologies for rapid analysis of evidence discovered at crime scenes is pertinent to our criminal justice system to solve the millions of violent crimes that occur each year. Without a witness, establishing the precise timeline of a crime is difficult. Therefore, technologies based on sensitive, nondestructive techniques are needed to evaluate evidence and create such a timeline. We propose the use of Raman spectroscopy to analyze the age of bloodstains for potential use as a forensics tool. Previous studies have revealed Raman spectroscopy is sensitive to changes in blood analyte concentration and different oxidative states of hemoglobin. Raman spectroscopy could allow for rapid comparison of spectra from blood stains of unknown age to spectra of known age with high temporal accuracy. Though further investigation into other substrates and biochemical components should be performed, our study reveals Raman spectroscopy has the potential to accurately and nondestructively determine the age of a bloodstain for use in criminal investigations.
The development of novel, nondestructive technologies for rapid analysis of evidence discovered at crime scenes is pertinent to our criminal justice system to solve the millions of violent crimes that occur each year. Without a witness, establishing the precise timeline of a crime is difficult. Therefore, technologies based on sensitive, nondestructive techniques are needed to evaluate evidence and create such a timeline. We propose the use of Raman spectroscopy to analyze the age of bloodstains for potential use as a forensics tool. Previous studies have revealed Raman spectroscopy is sensitive to changes in blood analyte concentration and different oxidative states of hemoglobin. Raman spectroscopy could allow for rapid comparison of spectra from bloodstains of unknown age to spectra of known age with high temporal accuracy. Though further investigation into other substrates and biochemical components should be performed, our study reveals Raman spectroscopy has the potential to accurately and nondestructively determine the age of a bloodstain for use in criminal investigations.
In recent years, forensic investigation has undergone a surge in popularity among scientists and researchers. Focus has shifted to developing novel, nondestructive techniques for rapid analysis of evidence discovered at crime scenes. This technology is pertinent to our criminal justice system as nearly 1.2 million violent crimes are committed in the United States each year (1). Oftentimes, without a witness, it is difficult to determine the time a crime occurred and the time of injury to or death of an individual. This specific time is paramount in a police investigation to confirm or reject a suspect’s alibi. Of the techniques that currently exist to enable formation of this timeline, most require a body. These techniques are also prone to error because of environmental conditions and variability of skill among investigators (2). Therefore, there exists a need for a sensitive, nondestructive technique to quickly and accurately determine the time a crime occurred.
The analysis of blood discovered at a crime scene can provide authorities with pertinent information regarding the crime and those involved, including blood type and DNA. Further analysis, however, has the potential to reveal other valuable information including the age of the bloodstain. The “age” is considered to be the amount of time the blood has been outside of the body and exposed to air. Prior research by Bremmer and colleagues used diffuse reflectance spectroscopy to determine the age of a bloodstain (3). Changes in oxyhemoglobin, methemoglobin, and hemichrome profiles were analyzed to predict the bloodstain’s age. Methemoglobin is produced through the auto-oxidation of oxyhemoglobin, while hemichrome is the result of the denaturation of methemoglobin. Though this technique proved to be highly accurate over the first 20 days, it had limited accuracy as the blood continued to age over an extended period of time. Diffuse reflectance spectroscopy is also sensitive to environmental factors, potentially affecting the accuracy of the age estimation. Other work has looked at RNA degradation (4), electron paramagnetic resonance spectroscopy (5), oxygen electrodes (6), and atomic force microscopy (7) to determine a bloodstain’s age. The accuracy of each of these techniques has temporal limitations. Therefore, in an effort to strengthen temporal accuracy, we present the use of Raman spectroscopy as a possible technique to determine the age of a bloodstain
Raman spectroscopy is an inelastic scattering technique, requiring monochromatic light. The laser light is used to excite a substance and cause alterations to the vibrational modes of its constituent molecules. Each of the molecules requires a specific amount of energy to vibrate, producing a shift in the output laser energy. Raman spectroscopy allows for the detection of the biochemical signatures specific to the molecule’s vibrational modes, which results in the determination of a substance’s constituent components. Because of its nondestructive nature, ability to take rapid measurements, and extreme sensitivity, Raman spectroscopy has the potential to correlate changes in blood’s biochemistry with time.
Analysis of Blood Using Raman Spectroscopy
Numerous studies have revealed the ability of Raman spectroscopy to analyze blood components. Two studies, in particular, analyzed hemoglobin and deoxygenated red blood cells (RBCs) (8,9). These studies revealed the effect of excitation wavelength on the resultant spectral signal. Wood and colleagues used 488-, 514-, 568-, 633-, and 785-nm excitation wavelengths to analyze deoxygenated RBCs (8). The results showed variances in peak intensities with differing excitation wavelength. Similar changes in peak intensity occurred when Wood and colleagues analyzed human hemoglobin with 632.8-, 780-, and 1064-nm excitation wavelengths (9).
Sikirzhytski and colleagues found that as blood dries, it becomes more heterogeneous, altering the Raman spectral signal compared to that of fresh, liquid blood (10). The components that contribute most to the Raman signal in its various states of drying were determined through principal component analysis (PCA). They concluded that the two major components of dried blood, based on the location of spectral peaks, were hemoglobin and fibrin. According to Sikirzhytski and colleagues, this result was to be expected because the literature states hemoglobin and its derivatives are the primary components remaining when red blood cells dry out. Fibrin appears as part of the blood coagulation process. It is believed that this process contributes to the spectral differences of liquid and dried blood. Knowing how the contribution of fibrin and hemoglobin change as blood dries and coagulates could allow for an age estimation of an unknown sample of dried blood.
Berger and colleagues used Raman spectroscopy to look at blood analytes, focusing specifically on glucose, cholesterol, triglycerides, urea, total protein, and albumin (11). Using partial least squares (PLS), they determined that each of these analytes had its own contribution to the overall Raman signature of both whole blood and serum. The extent to which each analyte contributed is proportional to its concentration. During this experiment, each sample of blood was only analyzed once; therefore, an evaluation of blood analyte concentration as a function of time could aid in the determination of blood age.
The studies performed by Bremmer and colleagues revealed diffuse reflectance spectroscopy to be sensitive to differences in hemoglobin in its various states including methemoglobin, oxyhemoglobin, and hemichrome (3). Dasgupta and colleagues demonstrated that Raman spectroscopy is also sensitive to these states (12). They concluded that RBCs can be monitored for their oxygen-carrying capacity because of the conformational changes that occur when oxygen binds or dissociates from the heme molecule.
Because of the decreased sensitivity of diffuse reflectance spectroscopy for bloodstain evaluation across extended time periods and the need for a rapid, nondestructive technique to analyze bloodstains for forensic purposes, we propose the use of Raman spectroscopy as an ideal technique to predict the age of a bloodstain. As can be seen through previous research, various components of blood are altered as it ages ex vivo that may be useful in determining how old a bloodstain is. One of these components is fibrin, which appears because of blood coagulation. Other components are hemoglobin derivatives such as oxyhemoglobin, methemoglobin, and hemichrome. Based on the sensitivity of Raman spectroscopy to the presence and concentration of these constituents, along with various blood analytes, a timeline could be formed for rapid comparison of the Raman spectrum of an unknown blood sample to the Raman spectra of blood samples of known ages with high temporal accuracy. This timeline would allow for the prediction a bloodstain’s age without destruction to forensic evidence.
Materials and Methods
Fresh blood samples were obtained from three healthy adult volunteers, two males and one female (IRB-151532). The blood samples were placed on various substrates and allowed to air dry at room temperature as measurements were acquired. Spectral measurements were obtained using an inVia confocal Raman microscope (Renishaw). The microscope was chosen for its high spatial resolution because of the degree of confocality it offers. A 785-nm diode laser (Innovative Photonic Solutions) was used to excite the samples. The blood samples were viewed in the microscope using a 50× objective. Measurements were taken at several integration times, laser powers, and various spatial locations in an effort to obtain the greatest possible signal-to-noise ratio while preventing damage to the sample. Data were collected as a time course, with measurements taken every 3-5 min for fresh blood and then daily at various time points up to 63 days.
Spectral measurements were normalized against the 520 cm-1 peak intensity of silicon to account for daily fluctuations in the setup. Spectra also underwent fluorescence subtraction using a fifth-order polynomial fit to extract the Raman signature.
Following data collection, a linear least squares model was developed to evaluate the contributions of various biochemical constituents over time. Nine pure components, commercially purchased from Sigma Aldrich, were measured using the same system. These components are albumin, biliverdin, cholesterol, fibrin, fibrinogen, globulins, glucose 6-phosphate, glutathione, and human hemoglobin A0. The model holds two basic assumptions. The first assumption is that the Raman spectrum is a linear combination of its component spectra. The second is that the intensity of the signal is linearly related to the constituent’s concentration in the blood (11).
For this experiment to be effective, two practical considerations needed to be addressed. These considerations included the substrate used to measure the blood and photoinduced changes from the laser.
Practical Considerations: Substrate
Crime scenes can have bloodstains present on any number of materials, which can complicate signal detection. Depicted in Figure 1, a variety of substrates were tested for their efficacy in obtaining spectral measurements for our purposes. Two main concerns about the substrates were addressed during testing. The first was that the substrate’s spectrum should be of low-intensity and featureless in shape, such that its contribution to the measured blood spectrum is minimized to prevent confounding factors. The second concern we addressed was to choose a substrate that would allow us to focus specifically on the bloodstain under the microscope objective and not the substrate.
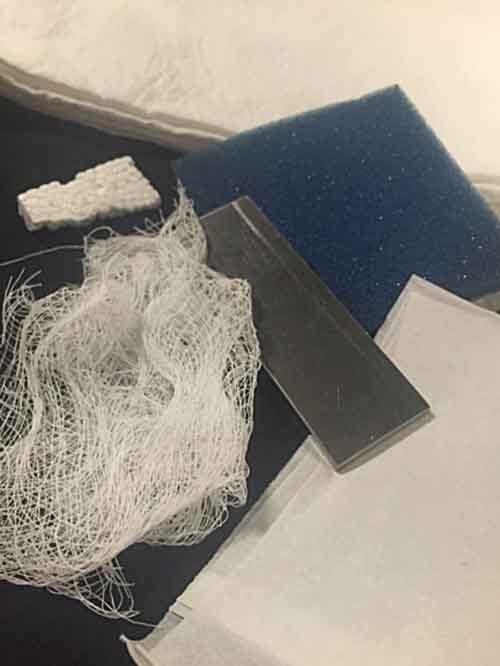
Figure 1: Material substrates investigated with Raman spectral measurement for blood stain age.
Next, 11 substrates were tested for their compatibility with these concerns. Displayed in Figure 2 are the Raman spectral signals of these substrates. The tested substrates included black cotton, blue sponge, blue tape, gauze, laboratory tissue (KimWipes, Kimberly-Clark), masking tape, paper towel, stainless steel, polystyrene foam (Styrofoam), white cotton, and white tape. Of these substrates, all had intense Raman signals with distinct peaks except for the blue sponge, stainless steel, and white cotton. Because interference from the substrate’s spectral signal is of concern, the other eight substrates were eliminated as options to carry out this experiment.
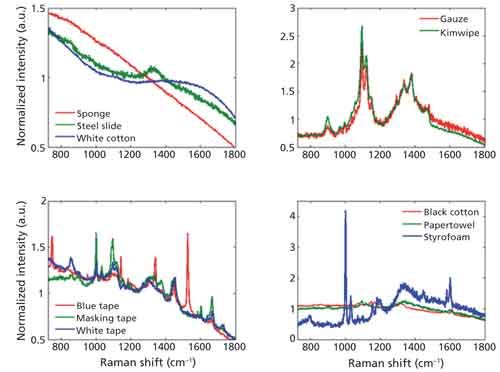
Figure 2: Raman spectral signals of the 11 substrates.
Further testing was performed on the white cotton, blue sponge, and stainless steel. Fresh blood samples were placed on these substrates and the Raman spectral data was collected. The heterogeneity of the white cotton and blue sponge on the microscopic level made it difficult to focus on the bloodstain. Focus was disrupted by the intricate network of fibers that compose these substrates. Though we did our best to focus between fibers and on the blood, when the spectral signals were analyzed, they appeared identical to the pure cotton and sponge spectra. However, when the blood sample was placed on stainless steel, we were able to focus on the blood instead of the substrate. The resultant spectra were distinct from that of stainless steel and were similar to the Raman spectra of blood found in literature.
Because it was the only substrate that allowed us to focus on the blood without imparting its own spectral signal, the stainless steel was used for further testing. Shortly thereafter, however, a problem was encountered. As the blood dried, it began to flake off of the stainless steel, preventing long term measurements. To avoid this problem with future samples, a small well, holding approximately 10 µL of blood, was drilled into the 75 mm × 25 mm slide. The experiment was repeated in the same manner with fresh blood in the well. Again, we were able to focus solely on the blood. This time, though, the blood was held in place by the well and did not easily flake off the stainless steel. For this reason, we chose to continue using stainless steel in our analysis of photoinduced changes to the sample.
Practical Considerations: Photoinduced Changes
Several publications address the effect of photoinduced changes to a sample because of the laser power. Wood and colleagues attributed an increase in signal-to-noise ratio of RBC measurements to heme aggregates that formed as a result of protein degradation from exposure to intense laser power and increased temperatures (8). Dasgupta and colleagues used optical tweezers to analyze how RBCs were affected by prolonged exposure to laser light (12). They found spectral changes occurred even with the laser power at a few milliwatts and also attributed these changes to aggregation of heme.
In an effort to combat effects from the laser, we experimented with a variety of integration times and laser powers to minimize irradiance to the sample while maintaining a good signal-to-noise ratio. We first addressed the laser power reaching the sample. By using a combination of pinhole aperture and neutral density filters, we were able to reduce the amount of scattered light focused on a 1.5-µm spot on the sample. This drastically reduces the power of the laser that reaches the sample, which in this case, was beneficial. Ultimately, the sample received 1.5 mW of power.
Though we chose a minimal laser power, long exposure times or even short exposure times to the same spot have the potential to cause unwanted destruction of the sample. Initially, we believed an exposure time of 15 s and five accumulations was acceptable; however, further experimentation revealed that was too long. Spectral changes that had previously been attributed to photodamage were seen in our spectra. Therefore, the parameters were adjusted to a 10 s integration time with two accumulations. Measurements were also acquired at different spatial locations to prevent photodamage to the sample at individual measurement spots. Secondarily, this also accounts for effects of spatial variability in the sample as it allows measurements across the sample to be averaged at a single time.
Figure 3 displays spectral signals across the first 6 h for a single sample, separated for clarity. Obvious changes in the signal can be observed, even after eliminating potential photoinduced alterations from the laser. Among these changes are the appearance of peaks known to be associated with fibrin at 970 cm-1 and 1246 cm-1 and the disappearance of a peak associated with hemoglobin at 1639 cm-1 (13). Because of the careful measures taken to prevent photoinduced changes to the sample, these figures suggest the observed transformations are because of chemical alterations in the sample as it dries-that is, oxidation and coagulation, rather than changes caused by the laser. It is possible, therefore, that observing peak ratios over time may provide an indicator of blood age. Figure 4 reveals consistent trends among peak ratios (1246 cm-1/1638 cm-1) of samples over the first 24 h (Figure 4a). Over the first 5 h, a drastic increase in the ratio occurs, implying a large increase in the presence of fibrin in the sample during this time. Consistent patterns are lost, however, as the samples become days to months old (Figure 4b). Expanding the data size may help to reveal and establish meaningful trends in the aging process.
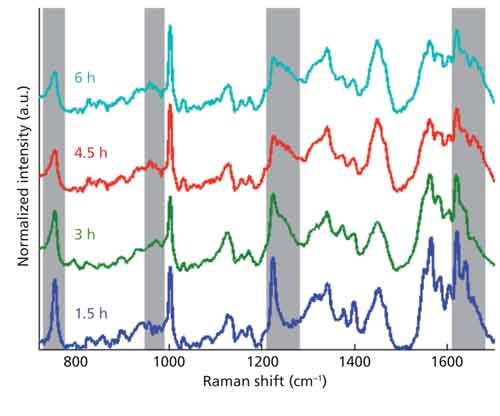
Figure 3: Raman spectral signal of a single sample during the first 6 h. Gray regions depict distinct signal changes over time.
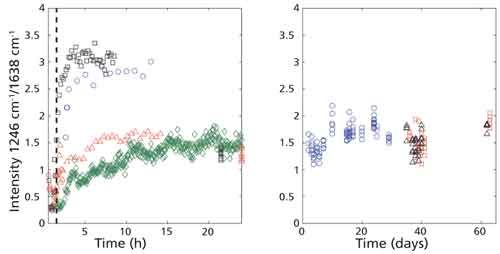
Figure 4: Peak ratio of 1246 cm-1/1638 cm-1 over 24 h (left panel) and 63 days (right panel). Each distinct color-shape combination represents measurements taken from various wells.
Despite the changes observed in several peak ratios, the determination of a timeline is complicated because of the variability that occurs even within a single time point. This warrants further investigation into intradonor variability and the heterogeneity of the blood sample. Additionally, nonlinear trends, as seen in the peak ratios, in the aging process complicate the quantitative estimation of an appropriate timeline, thus requiring the use of component coefficients from the linear least squares model to obtain new quantitative metrics.
Figure 5 displays the Raman spectral signals of the nine components used in the linear least squares model. The modeled summation of these components at 1.5 h is displayed in the right panel of Figure 6, along with the true spectrum on the left. The difference between the true spectrum and the modeled spectrum is the residual, also displayed. The obvious features that remain in the residual, primarily at 970, 1225, and 1638 cm-1, reveal that our model is missing some of the constituents that account for the spectral changes we are seeing at these same locations. Potential constituents that might increase the accuracy of our model will be investigated further, the inclusion of which may improve the clarity of trends as a function of time.
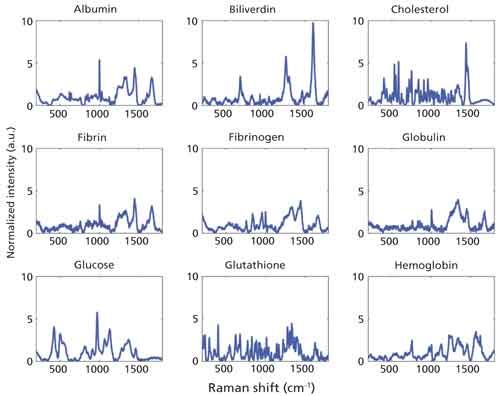
Figure 5: Raman spectra of biochemical constituents used to create the linear least squares model.
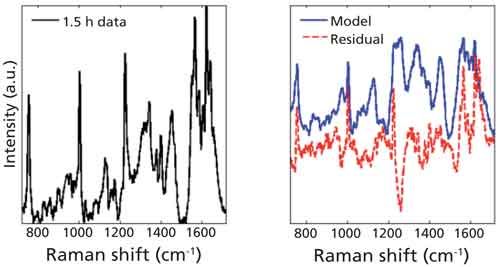
Figure 6: Raman spectrum of a blood sample at 1.5 h (left). Spectra of linear least squares model and the residual, obtained from subtracting the model spectrum from the spectrum taken at 1.5 h.
Conclusions
Raman spectroscopy is sensitive to changes in blood as a function of time and therefore, has the potential to aid in creating a forensic timeline of blood age. There are a variety of complications, however, which prevent this from being a simple process. Primarily, caution needs to be taken to ensure the sample is not being damaged and the aging process is not being altered by the laser. Consistent changes, based on peak ratios, occur in the sample over the first 24 h. This consistency is lost as the sample continues to age. Despite this, an increased sample size and multivariate statistical models have the potential to enable accurate age prediction. Our use of a stainless steel substrate does not mimic likely conditions at a crime scene, yet absorbent materials may affect the ability to obtain an accurate spectral signal. Further investigation into other substrates is underway to combat these problems. By addressing issues with the substrate, increasing sample size, and having consistent measurement parameters, we can demonstrate the feasibility of using Raman spectroscopy to determine the age of a bloodstain for use in criminal investigations.
References
- Crime in the United States, Federal Bureau of Investigations (FBI), 2014.
- C. Swanson, in Criminal Investigation, 10th Edition (McGraw-Hill Higher Education, New York, New York, 2008), pp. 275–312.
- R.H. Bremmer et al., Forensic Sci. Int.206(1–3), 166–171 (2011).
- M. Bauer et al., Forensic Sci. Int. 138(1–3), 94–103 (2003).
- Y. Fujita et al., Forensic Sci. Int.152(1), 39–43 (2005).
- T. Matsuoka et al., Biol. Pharm. Bull.18(8), 1031–1035 (1995).
- S. Strasser et al., Forensic Sci. Int.170(1), 8–14 (2007).
- B.R. Wood et al., Anal. Bioanal. Chem.387(5), 1691–1703 (2007).
- B.R. Wood et al., Biochim. Biophys. Acta1539(1–2), 58–70 (2001).
- V. Sikirzhytski et al., Sensors10(4), 2869–2884 (2010).
- A.J. Berger et al., Appl. Opt.38(13), 2916–2926 (1999).
- R. Dasgupta et al., J. Biomed. Opt.15(5), 055009-1-055009–11 (2010).
- K. Virkler et al., Anal. Bioanal. Chem.396(1), 525–534 (2009).
Maggie O’Connor, Kiana Jansen, Joseph Hodge, Christine O’Brien, Isaac Pence, and Anita Mahadevan-Jansen are with the Department of Biomedical Engineering at Vanderbilt University in Nashville, Tennessee. Direct correspondence to: anita.mahadevan-jansen@vanderbilt.edu â¾
AI-Powered SERS Spectroscopy Breakthrough Boosts Safety of Medicinal Food Products
April 16th 2025A new deep learning-enhanced spectroscopic platform—SERSome—developed by researchers in China and Finland, identifies medicinal and edible homologs (MEHs) with 98% accuracy. This innovation could revolutionize safety and quality control in the growing MEH market.
New Raman Spectroscopy Method Enhances Real-Time Monitoring Across Fermentation Processes
April 15th 2025Researchers at Delft University of Technology have developed a novel method using single compound spectra to enhance the transferability and accuracy of Raman spectroscopy models for real-time fermentation monitoring.
Nanometer-Scale Studies Using Tip Enhanced Raman Spectroscopy
February 8th 2013Volker Deckert, the winner of the 2013 Charles Mann Award, is advancing the use of tip enhanced Raman spectroscopy (TERS) to push the lateral resolution of vibrational spectroscopy well below the Abbe limit, to achieve single-molecule sensitivity. Because the tip can be moved with sub-nanometer precision, structural information with unmatched spatial resolution can be achieved without the need of specific labels.