Kinetic Imaging of Epoxy Curing
Spectroscopy
Adhesives are a group of materials that are found extensively in manufacturing and production industries and are of great interest for quality control and failure analysis. This paper discusses the use of an array detector in conjunction with ultrafast mapping to produce kinetic chemical imaging to monitor the curing process in a two-part epoxy resin. This technique allows for simultaneous analysis of both the kinetics of the epoxy reaction along with the spatial information of the reaction. This kinetico-spatial information gives insight about localized domains that form when the epoxy is mixed and how the reaction progresses.
Adhesives are materials that are found extensively in manufacturing and production industries and are of great interest for quality control and failure analysis. This article discusses the use of an array detector in conjunction with ultrafast mapping to produce kinetic chemical imaging to monitor the curing process in a two-part epoxy resin. This technique allows for simultaneous analysis of both the kinetics of the epoxy reaction along with the spatial information of the reaction. This kinetico-spatial information gives insight about localized domains that form when the epoxy is mixed and how the reaction progresses.
Many industries use adhesives for bonding materials when other, standard connections (welding, fasteners, or tapes) are either unreliable, too expensive, or difficult to implement (1). For instance, in the automotive industry a major source of improved efficiency (for example, fuel economy) involves incorporating lightweight materials. Beams and struts attached with adhesives are far lighter than those attached with standard connections, but there is concern over their durability and safety. There is a need for a wide range of adhesives that can bond to many different materials. Rapid advances in materials based on carbon fibers, aluminum, and other metals and polymers require specific adhesive properties (1). Application under water or in the vacuum of space and on a wide range of materials requires different bonding techniques that maintain strength even when managing differing thermal expansion properties. These requirements can be further complicated by surface treatments, including nonstick coatings. Common uses include bonding plastic to plastic or plastic to metal, devising fillers for repairs, potting electronics, and setting optics (2,3). The field of dental adhesives alone is enormous, with the additional requirements of nontoxic vapors and exposure to a range of solvents and acids.
Two-part epoxies generally consist of a resin and a hardener. Mixing initiates a reaction that forms linkages, a process known as curing. Cure times can be controlled by adjusting the concentrations of components, and epoxy types vary from the common 5-min epoxies to ones needing hours (4,5). Being able to monitor the reaction at both the macro- and microscales is of great importance to understanding the curing process (1,5).
Probing adhesives at the bulk level requires measuring the viscoelastic properties, which are typically measured using devices like a rotating disk viscometer. These properties and the bond strength are controlled at a molecular level, however, as bonds form and cross-linking of chains occurs. Infrared and Raman spectroscopy can be used to probe the molecular nature of these changes, tying the bulk property to a molecular source. Fourier transform infrared (FT-IR) spectroscopy in particular has long been used in this application (1).
Standard FT-IR can supply a general view of a curing epoxy (2,4,6). However, the analysis spot size is typically a few millimeters in size, so the experiment is viewing a relatively large zone. The spectral information is effectively averaged over the area. FT-IR microspectroscopy provides users with the chemical analysis but also adds a spatial component to the chemical information. This area of information can be gathered by point-by-point mapping or imaging using a multielement detector. With fast-setting epoxies, using FT-IR mapping to cover an area would generally be slow, which does not lend itself to kinetics analysis. Studying a 5-min epoxy requires the data to be collected in seconds over the full area (4,5,7). This article shows how rapid FT-IR microspectroscopy can be used to carry out this work, identify localized domains, and follow the kinetics in a two-part epoxy.
Experimental
To set our microspectroscopy parameters, we first studied a two-part epoxy using a standard FT-IR. A Thermo Scientific Nicolet iS50 FT-IR spectrometer with a built-in iS50 attenuated total reflectance (ATR) accessory was used. This ATR unit uses a monolithic diamond crystal, which provided excellent spectra and also enabled aggressive cleaning after the epoxy cured.
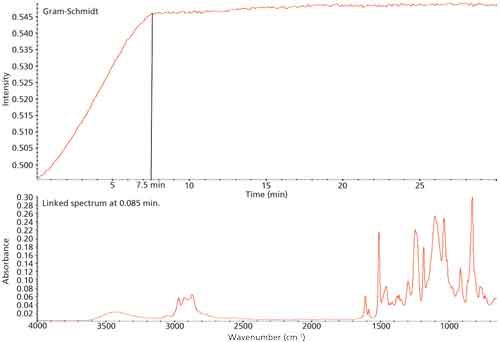
The resin and hardener were mixed thoroughly according to the manufacturer’s recommendations. A drop of the mixture was deposited onto the diamond. Infrared spectra were collected continuously for 15 min using the Thermo Scientific Omnic Series time-based software. This produced a Gram-Schmidt plot, shown in Figure 1, that shows the overall signal change. The Gram-Schmidt profile levels out after about 7.5 min, which we took as the approximate cure time for our microscope experiments. For the FT-IR microspectroscopy, the same resin and hardener were mixed per the instructions. The blending step produced a mixture that had some bubbles, but that appeared to be homogeneous. The mixture was deposited on a gold-mirrored slide and spread out to produce a thin film. Data were collected using reflection-absorption spectroscopy (IRRAS) in which the IR beam passed through the sample, reflected off the mirror, and then passed the sample again.

Figure 1: Gram-Schmidt plot for curing epoxy.
Data were collected using a Thermo Scientific Nicolet iN10 FT-IR microscope equipped with an array detector and ultrafast mapping capability. An area of 500 × 550 µm was selected, and the spatial resolution within the maps was set to 25 µm per pixel. With this combination, each map was collected in about 2.2 s. About 23 images were collected over a span of 8 min (as determined by the earlier experiments), which proved to be enough to see the changing chemistry.
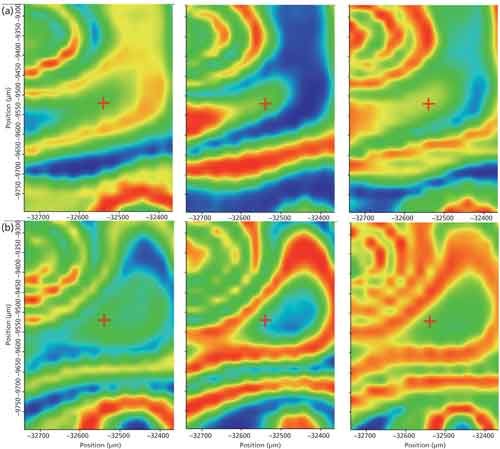
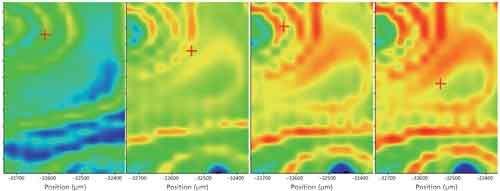
We will not delve into the specific chemistry of this epoxy, although the FT-IR data enable that analysis. Instead, we produced correlation maps that show the spatial distribution of specific components as identified from their individual spectra. Spectra collected on the ATR unit of the unmixed resin, hardener, and from the cured epoxy provided the reference spectra for the correlations. In the maps shown in Figures 2 and 3, red indicates a high correlation, meaning the component is present at that location, and blue represents the absence of the specified component. Figure 2 shows snapshots at particular times, while Figure 3 shows a time sequence for the reacted epoxy as time passed.

Figure 2: Correlation maps comparing the (a) first and (b) 23rd map for the resin (left), hardener (center), and mixture (right).
Results
The Gram-Schmidt profile (Figure 1), which records the change of the IR spectrum over time, indicates that the epoxy cured to its hold point in about 7.5 min, followed by a period of much slower curing thereafter. On this basis, we used 8 min as a boundary condition for the microscopy, basically assuming the epoxy had cured sufficiently.
Infrared correlation images of the uncured mix collected as soon after mixing as possible are shown in Figure 2. As noted above, these images represent how strongly a spectrum at a point in space correlated to the reference spectrum of either the resin, the hardener, or the mixture.
In Figure 2, domains of high resin concentration, high hardener concentration, and mixed domains are clear. If you overlay the images, the resin and hardener regions are almost opposites, whereas the mixture traces the boundaries in many cases. Given the vigorous mixing applied, it seems surprising that the images show a high degree of inhomogeneity at the microscale. This can be attributed to the high initial viscosity of the two components which makes the mixing difficult.
Figure 2 shows spectra from the same location for the sample 8 min after application (roughly 10 min after initial mixing). The heterogeneous structure of the material is still present-the reaction has not proceeded equally through the entire mixture-as shown by the strong swirl marks generated during the application of the epoxy. Both the resin and the hardener are showing less red (except for the strong swirl), as expected for the reactants. Figure 3 shows the evolution of the sample.

Figure 3: Infrared correlation images of the curing mix, correlated to a reference spectrum of the cured mix, from the first image (t = 0) to the 23rd image (t = 8 min), on a constant color scale red indicates areas of high correlation, blue of low correlation, with the cured mix reference spectrum.
Figure 3 shows color normalized correlation images using a spectrum of the cured material (taken on the ATR system). Initially, there is almost no trace of the product. As time proceeds, domains of cured epoxy appear and these begin to overlap with one another. Even so, the cured material shows some localization and there are sizeable domains of unreacted resin and hardener present. Clearly, in these microdomains, set times vary and the cure is not uniform.
From our analysis, it appears after 8 min that this material is only about 50–60% cured. The continued slow evolution seen in the series data is likely because of the continued slow reaction of the material in regions where the mixing was poor. From a quality control perspective, the lack of general cure could mean this adhesive needs a longer cure time, which we note from the manufacturer’s instructions when they say “full strength curing occurs in 8–10 hours.” In critical alignment operations, this would mean bonded parts might slip or move during the slow final cure time.
Conclusions
FT-IR microspectroscopy has been shown effective in studying the curing of an epoxy. The appearance of microdomains clearly related to the mixing process would provide clues for process quality control. We did not follow the slower, long time cure, but we expect in this time the reaction would proceed in the poorly mixed areas. If this were a critical process, we would advise better mixing of the hardener and resin.
Though not done in this work, other work reported by our team coupling rheometry and infrared or Raman spectroscopy in epoxy studies allows the correlation of viscoelastic properties to the bulk chemical properties can be visualized. Combining that information with the microscopic domain picture as outlined here would provide a full view-molecular, microdomains, and bulk-for adhesives analysis.
References
- J. Canavate, X. Colom, P. Pages, and F. Carrasco, Polym.-Plast. Technol. Eng.39(5), 937–943 (2000).
- T. Scherzer and U. Decker, Vib. Spectrosc.19(2), 385–398 (1999).
- B. Bilyeu, W. Brostow, and K.P. Menard, J. Mater. Educ. 23(4-6), 189–204 (2001).
- S.-G. Hong and C.-S. Wu, Thermochim. Acta316(2), 167–175 (1998).
- L. Li, Q. Wu, S. Li, and P. Wu, Appl. Spectrosc.62(10), 1129–1136 (2008).
- R.E. Parker and N.S. Isaacs, Chem. Rev. 59, 737–799 (1959).
- N. Goran et al., Sensor10, 684–696 (2010).
Stephan Woods, Michael Bradley, and David Drapcho are with Thermo Fisher Scientific in Madison, Wisconsin. Direct correspondence to: stephan.woods@thermofisher.com â¾

Real-Time Battery Health Tracking Using Fiber-Optic Sensors
April 9th 2025A new study by researchers from Palo Alto Research Center (PARC, a Xerox Company) and LG Chem Power presents a novel method for real-time battery monitoring using embedded fiber-optic sensors. This approach enhances state-of-charge (SOC) and state-of-health (SOH) estimations, potentially improving the efficiency and lifespan of lithium-ion batteries in electric vehicles (xEVs).
Microplastics Widespread on Catalan Beaches, Study Finds
March 28th 2025In a recent study published in Marine Pollution Bulletin, a team of researchers from several Spain and Portugal universities and institutions (Rovira i Virgili University, Universitat de Barcelona, University of Porto, and Institut d'Investigació Sanitaria Pere Virgili (IISPV) assessed microplastic (MP) contamination along the Mediterranean coastline.
Exoplanet Discovery Using Spectroscopy
March 26th 2025Recent advancements in exoplanet detection, including high-resolution spectroscopy, adaptive optics, and artificial intelligence (AI)-driven data analysis, are significantly improving our ability to identify and study distant planets. These developments mark a turning point in the search for habitable worlds beyond our solar system.