In Situ Enhancement of Microplastic Raman Signals in Water Using Ultrasonic Capture
Special Issues
Of the 78 million tons of plastic packaging manufactured every year, approximately one-third ends up in the ocean, the air, and most foods and beverages. To monitor the proliferation of these plastics, an ultrasonic capture method is demonstrated that produces a 1500-fold enhancement of Raman signals of microplastics in water.
Microplastic particles in aqueous ecosystems constitute a worldwide environmental problem. Raman spectroscopy is uniquely positioned to detect and classify even the smallest, and most abundant, particle sizes, down to micrometers in size. However, the current “filter and scan” method used to concentrate and detect dilute microplastics in water is slow, and prone to contamination from handling and interference from the filter substrate. Here, we present a simpler approach to concentrate the particles in situ, without any sample preparation, in the focus of a Raman probe. The technique uses an ultrasonic resonator with a 2 MHz standing acoustic wave to capture 3.4 µm poly(methyl methacrylate) (PMMA) microspheres in the sample solution for direct detection. When tested with a 90 ppm solution, ultrasonic capture for 5 min enabled a clear PMMA Raman signal to be distinguished from the background. The signal enhancement provided by ultrasonic capture was estimated to be greater than 1500x.
The majority of plastics, like the 78 million tons of plastic packaging manufactured every year, is produced for single-use items, approximately a third of which ends up in the ocean (at the rate of one garbage truck every minute). Engulfed by these vast waters, it gradually breaks apart into progressively smaller particles, and eventually enters the food chain as microplastics, which are defined as plastic particles smaller than 5 mm in size. Slowly, and unbeknownst to the world until recently, microplastic particles have spread to every continent, ocean (1–3), the air (4), and most food and beverages (5–8).
Studies into the nature and distribution of microplastics across the world have found both bottled and ocean water to contain concentrations on the order of 100 particles per liter of microplastics 5 µm or larger in size, and several 1000s of microplastic particles greater than or equal to 1 µm in size. The most common microplastic particles found are polypropylene (PP), polyethylene (PE), polyethylene terephthalate (PET) in drinking water, and PE, PP, and polystyrene (PS) in the ocean.
Currently, the most common approach to detecting microplastics requires filtering large sample volumes of water to concentrate particles for detection, then scanning the filter substrate for any particles (9), and chemically identifying the particles with Fourier-transform infrared spectroscopy (FT-IR) or Raman spectroscopy (10–11). However, this approach is very time-consuming (12), and can be prone to contamination of the filter and to interference from the filter material itself (13). This approach has shown variable sensitivity to the most abundant, but smallest, particles (14). Furthermore, the lack of a unified protocol for filtering and detection leads to inconsistent results, and thus compromises the collection and comparison of quantitative data for global monitoring (15–19).
Raman microscopy on filter substrates is currently the only tool capable of detecting and identifying the smallest, and most numerous, particles of 20 µm in size or less, as its short wavelength, tight laser focus, and ability to raster systematically across the sample is sensitive to even small particles at low density. However, Raman microscopy in the present form uses large bench top-sized instruments, scanning slowly across the membrane used for the filtration of a water sample. As one review put it: “There is an urgent need for a fast and easily implementable monitoring tool capable of detecting small microplastics (20).”
Instead of filtration, a different approach to capture and bring these microparticles to the point of measurement is proposed here as a proof of concept investigation (21). It employs a strong ultrasonic standing wave of about 2 MHz frequency in a resonator composed of a piezo transducer on one end and a Raman probe on the other. Small particles are trapped in the nodes of the standing wave field, where they are held by acoustic radiation forces (22). If one of the nodal planes of the ultrasonic trap is colocated with the laser focus of a Raman immersion probe, the particles can immediately be studied in situ. A trap of this design can be employed directly in the sample stream as collected, bypassing all preparation steps. This reduces the analysis time from hours to minutes, prevents any contamination of the sample from handling, and eliminates the Raman background commonly seen when concentrating samples onto a filter in the currently accepted method.
Materials and Methods
The Raman system consisted of a compact Wasatch Photonics WP 785 Raman spectrometer with an integrated 785-nm laser set to 350-mW, equipped with a temperature-regulated CCD detector, and a 50 µm slit leading to a resolution of 10 cm-1. The spectrometer was chosen for its f/1.3 input aperture and transmissive optical design, as the application requires a high degree of sensitivity in a portable design to enable eventual deployment in the field. The laser and spectrometer were fiber-coupled to a Raman probe with a 1/2” immersion probe tip terminated by a sapphire ball lens with a very short working distance.
The ultrasonic resonator used for particle capture, soniccatch by usePAT, has been described in detail elsewhere (23). Briefly, a piezo-electric transducer generates the outgoing ultrasonic wave with an approximate frequency of 2 MHz, while the Raman probe ball lens forms the reflector for the resonator at a distance of about 3 mm from the surface of the transducer. Superposition of the incoming and reflected waves generates a standing wave with a small number of nodes, as shown in Figure 1.
Figure 1: An ultrasonic standing wave formed between a piezo transducer and a Raman probe used as the reflector captures small particles in its nodes.
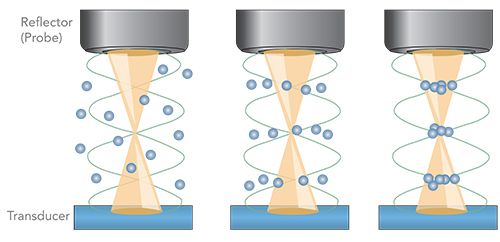
The radiation forces imposed by the ultrasonic wave are predominantly dependent on the particle size, but also depend on their mass density and compressibility relative to the medium. The forces exerted are due to the scattering of the wave at the particles’ surfaces, and lead to agglomerations in the nodal or anti-nodal regions of the standing wave (23).
The resonator assembly consisting of the ultrasonic transducer and the Raman probe was lowered directly into a stirred 90-ppm suspension of 3.4 µm poly(methyl methacrylate) (PMMA) microspheres in water, in which the microspheres had been dispersed with a drop of detergent. PMMA is a lightweight, transparent plastic most commonly known as acrylic or plexiglass, and is also used as microbeads in personal care products.
The integration time of the spectrometer was set to 2.5 s, and 500 individual non-averaged spectra were continuously recorded for each experiment. Five repeat runs were performed, four in which ultrasonic capture was activated at the beginning of each run, and one static reference run (no capture).
Results and Discussion
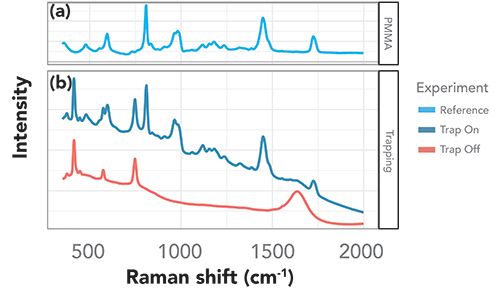
Comparing the Raman spectra with and without ultrasonic capture of the PMMA microspheres, as shown in the bottom panel of Figure 2, we identified three main contributions to the signal arising from the sample and setup. The first contribution comes from a series of bands at ~414 cm-1, ~574 cm-1, and 748 cm-1, present in all spectra, which do not change with ultrasonic capture. These were attributed to the sapphire of the ball probe lens, an effect also reported in Raman imaging using sapphire fiber (24). The second contribution, present in all spectra with ultrasonic capture in the steady state, agrees well with a bulk PMMA signal shown for comparison in the top panel of Figure 2, with key peaks at ~596 cm-1, ~812 cm-1, 970 cm-1, 990 cm-1, ~1450 cm-1, and ~1725 cm-1. The third contribution, a broader peak at roughly ~1640 cm-1, was present without ultrasonic capture, but disappeared over time once capture was activated. This more elusive signal can be attributed to the front window of the transducer. As particles are trapped, the Raman laser no longer reaches the surface of the transducer, but instead gets scattered by the trapped particles, leading to the marked reduction in signal and to the enhancement of the signal of the particles of interest. A direct comparison of the Raman spectra with and without ultrasonic capture to bulk PMMA in Figure 2 indicates that trapping leads to a large enhancement of the PMMA signal. The difference is distinct, from no discernible signal without ultrasonic capture to a very large and clean signal after ultrasonic trapping is activated.
Figure 2: Trapped PMMA microspheres. (a) Raman spectrum of neat PMMA for comparison. (b) Raman spectra of 90 ppm dispersion of PMMA microspheres with and without the ultrasonic trap.
To study the ultrasonic capture process in greater detail, we recorded the Raman signal as a time series after activating the ultrasonic transducer and were able to observe the continuous evolution of the PMMA trapping in time as illustrated in Figure 3. Here, we have bound the region associated with the main PMMA Raman lines using vertical lines just beyond 750 cm-1 and 1500 cm-1. In this region, we subtracted the baseline to obtain a clearer illustration of the growth of the PMMA signal in time (Figure 4). The asymmetric least squares (ALS) method (25) (26) was used for baseline correction.
Figure 3: Raman spectra while trapping. Evolution of dip probe spectra during ultrasonic capture. Vertical lines indicate region with main PMMA Raman lines used for baseline correction.
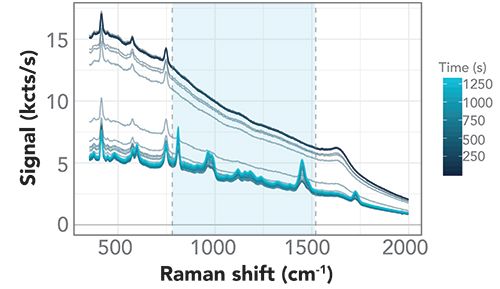
Figure 4: Baseline-corrected Raman spectra. Key PMMA Raman peaks show steady growth of PMMA signal after ultrasonic capture is activated.
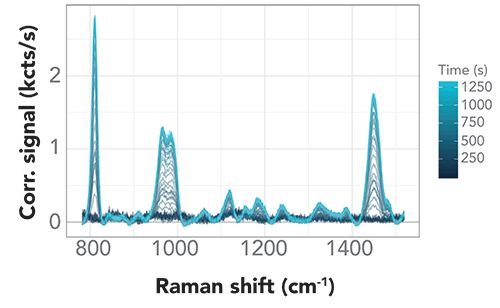
With background subtraction applied, the PMMA signal was clearly seen to rise after an initial induction period with no discernible signal change, during which we saw no indication of any PMMA signal in the baseline to indicate ultrasonic capture. Once initiated, the signal grew and reached a maximum quickly.
For a quantitative analysis, we separated the signal contributions to the spectra set using multivariate curve resolution (MCR). MCR is an iterative method that can be used to identify a potential separation of the spectra set into fixed component spectra and time-varying contributions for each component. This separation is “ill-defined,” and does not lead to a unique solution, that is, the results depend on the initial guess for the spectra. As we already expected three independent contributions (dip probe, PMMA, and transducer), we limited the decomposition to three components and seeded the analysis with the first three loadings from the principal component analysis (PCA) of the same spectra, setting those three component spectra as our initial guesses for the MCR spectra.
In addition, we enforced additional non-negative constraints on both the component spectra and the component contributions of the separation, an approach known as the ALS (alternative least squares) variant of MCR (27). This matches the expectations of actual spectra and “concentrations”, each of which would be expected to contribute additively to the observed spectra.
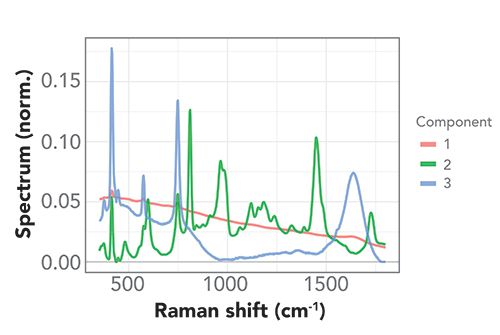
Figure 5 shows the component spectra resulting from the MCR-ALS analysis. We assigned components 1 and 3 to the Raman signal arising from the dip probe and the transducer, and component 2 to the Raman signal from the PMMA microspheres in solution. Comparison to the Raman spectrum of neat PMMA (Figure 2, top panel) shows very good agreement; the PMMA component spectrum shows little interference from the signal caused by the setup (sapphire ball lens or transducer material).
Figure 5: MCR-ALS component spectra. Multivariate analysis of time-dependent Raman spectra during capture using MCR-ALS to isolate individual spectral components from dip probe, PMMA, and transducer.
The MCR-ALS result for the time-varying contribution of component 2, which we assigned to PMMA, can be interpreted as the time evolution of the PMMA signal, as shown in Figure 6 for four independent repeat runs of the same experiment. The figure presents a similar growth curve of the signal for each run, with an induction period of approximately 250 s, and a full, steady state PMMA signal after about 1000 s. The rapid signal evolution after the initial induction period may be due to a feedback effect in which captured PMMA particles slow down other particles near the trapping nodes of the standing wave.
Figure 6: MCR-ALS component 2. Time-dependent contribution of MCR-ALS component assigned to PMMA from four independent runs with ultrasonic capture, and a shorter reference run without capture.
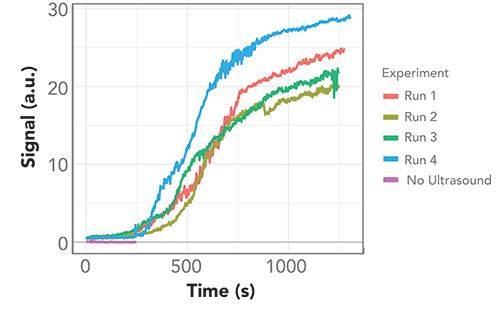
To determine the Raman signal enhancement for PMMA attributable to ultrasonic capture in the 90 ppm dispersion, we averaged the MCR-ALS result for the contribution of the component assigned to PMMA with and without ultrasonic trapping activated. The average for the signal with trapping is formed across all four runs for all measurements past the 1000 second mark (steady state capture), leading to an average signal of about 23,100 (arbitrary units).
For the reference signal, we used a separate experiment with the same sample in the same setup, but without trapping activated, and determined the MCR-ALS signal contributions using the same decomposition as used in the four runs with trapping activated. Averaging over the entire run of 100 spectra, we found a reference signal of 15±20 (arbitrary units) with the uncertainty given by the standard deviation across the 100 spectra. Even at “one sigma,” this signal is not significantly different from zero, limiting the possibilities of standard approaches for calculation of a lower limit for the enhancement factor. Though the true magnitude of the enhancement factor for ultrasonic capture cannot be fully quantified, a minimum enhancement of 1500x can safely be reported using this reference signal value.
Conclusion
Growing concern over the increasing presence of microplastics in our environment and their potential environmental impact has heightened the need for a simple, robust, and portable measurement method. Capture of PMMA microspheres with an ultrasonic standing wave for direct detection using a compact Raman system is one possible alternative to current filtration-based methods. Here, we demonstrated a more than 1500-fold enhancement of the Raman signal using ultrasonic capture and a dip probe from a 90 ppm suspension in water. The captured microplastic sample amount increased in time up to the capacity of the resonator trap, reaching the full enhancement in about 500 s. While still experimental, the method shows a possible route to microplastic measurements in water requiring little to no sample preparation, and which can be performed using compact, portable instrumentation in the field.
References
- J. Li, H. Liu, and J. Paul Chen, Water Research 137, 362–374 (2018).
- N. P. Ivleva, A.C. Wiesheu, and R. Niessner. 2017, Angew. Chem. Int. Ed. 56, 1720–1739 (2017).
- L. Van Cauwenberghe, A. Vanreusel, J. Mees, and C.R. Janssen, Environ. Pollut. 182, 495–499 (2013).
- E. Gaston, M. Woo, C. Steele, S. Sukumaran, and S. Anderson, Appl. Spectrosc. 24 (2020).
- D. Schymanski, C. Goldbeck, H.-U. Humpf, and P. Fürst, Water Research 129, 154–162 (2018).
- T.M. Karlssona, A.D. Vethaaka, B. Carney Almrothd , F. Ariesee, M. van Velzena, M.Hassellöv, and H.A. Leslie. Mar. Pollut. Bull. 122, 403–408 (2017).
- B.E. Oßmann, G. Sarau, H. Holtmannspotter, M. Pischetsrieder, Silke H. Christiansen, and W. Dicke, Water Research 141, 307–316 (2018).
- A.C. Wiesheu, P.M. Anger, T. Baumann, R. Niessner, and N.P. Ivleva, Anal. Methods 8, 5722 (2016).
- G. Sarau, L. Kling, B.E. Ossmann, A-K. Unger, F. Vogler, and S.H. Christiansen, Appl. Spectrosc. 24 (2020).
- R.Lenz, K. Enders, C.A. Stedmon, D. M.A. Mackenzie, and T.G. Nielsen, Mar. Pollut. Bull. 100, 82–91 (2015).
- L. Vethaak, G.H. Tinnevelt, J.J. Jansen. J. Raman Spectrosc. 49, 1136–1144 (2018).
- L. Frère, I. Paul-Pont, J. Moreau, P. Soudant, C. Lambert, A. Huvet, and E. Rinnert, Mar. Pollut. Bull. 113, 461–468 (2016).
- B.E. Oßmann, G. Sarau, S.W. Schmitt, H. Holtmannspötter, S.H. Christiansen, and W. Dicke, Anal. Bioanal. Chem. 409, 4099–4109 (2017).
- A.M. Elert, R. Becker, E. Duemichen, P. Eisentraut, J. Falkenhagen, H. Sturm, and U. Braun, Environ. Pollut. 231, 1256–1264 (2017).
- S. Primpke, R.K. Cross, S.M. Mintenig, M. Simon, A. Vianello, G. Gerdts, and J. Vollertsen. Appl. Spectrosc. 24, (2020).
- S. Primpke, S.H. Christiansen, W. Cowger, H. De Frond, A. Deshpande, M. Fischer, E.B. Holland, M. Meyns, B.A. O’Donnell, B.E. Ossmann, M. Pittroff, G. Sarau, B.M. Scholz-Böttcher, and K. J. Wiggin. Appl. Spectrosc. 24, (2020).
- C. Thaysen, K. Munno, L. Hermabessiere, C.M. Rochman. Appl. Spectrosc. 24, (2020).
- L. Mai, L-J. Bao, L. Shi, C.S. Wong, and E.Y. Zeng, Environ. Sci. Pollut. Res. 25, 11319–11332 (2018).
- T. Hamm, C. Lorenz, and S. Piehl, Microplastics in Aquatic Systems – Monitoring Methods and Biological Consequences YOUMARES 8 -Oceans Across Boundaries: Learning from each other Proceedings of the 2017 conference for YOUng MARine RESearchers.
- C.F. Araujo, M.M. Nolasco, A.M.P. Ribeiro, and P.J.A. Ribeiro-Claro, Water Research 142, 426–440 (2018).
- M. Wiklund, S. Radel and J.J.Hawkes. Lab Chip 13, 25–39 (2013).
- S. Radel, et al. Elektrotechnik und Informationstechnik 125, 82–85 (2008).
- K. Wieland, S. Tauber, C. Gasser, L. A. Rettenbacher, L. Lux, S. Radel, and B. Lendl, Anal. Chem. 91, 14231−14238 (2019).
- S. Deng, et al. Opt. Express 27(2), (2019).
- P.H.C. Eilers, Anal. Chem.75, 3631–3636 (2003).
- P.H.C. Eilers and H.F.M. Boelens, “Baseline Correction with Asymmetric Least Squares Smoothing,” Leiden University Medical Centre, Leiden, The Netherlands, 2005.
- M. Garrido, F.X. Rius, and M.S. Larrechi, Anal. Bioanal. Chem. 390, 2059–2066 (2008).
Samantha Derksen, Christoph Gasser, and Stefan Radel are with usePAT GmbH, in Vienna, Austria. Dieter Bingemann, Cicely Rathmell and David Creasey are with Wasatch Photonics, in Morrisville, North Carolina. Direct correspondence to: marketing@wasatchphotonics.com
AI-Powered SERS Spectroscopy Breakthrough Boosts Safety of Medicinal Food Products
April 16th 2025A new deep learning-enhanced spectroscopic platform—SERSome—developed by researchers in China and Finland, identifies medicinal and edible homologs (MEHs) with 98% accuracy. This innovation could revolutionize safety and quality control in the growing MEH market.
New Raman Spectroscopy Method Enhances Real-Time Monitoring Across Fermentation Processes
April 15th 2025Researchers at Delft University of Technology have developed a novel method using single compound spectra to enhance the transferability and accuracy of Raman spectroscopy models for real-time fermentation monitoring.
Nanometer-Scale Studies Using Tip Enhanced Raman Spectroscopy
February 8th 2013Volker Deckert, the winner of the 2013 Charles Mann Award, is advancing the use of tip enhanced Raman spectroscopy (TERS) to push the lateral resolution of vibrational spectroscopy well below the Abbe limit, to achieve single-molecule sensitivity. Because the tip can be moved with sub-nanometer precision, structural information with unmatched spatial resolution can be achieved without the need of specific labels.
