Spectrometers for Elemental Spectrochemical Analysis, Part III: Arc/Spark Optical Emission Spectrometers
Following a discussion of the basic modules of spectrometer systems in Part I, the author continues his series on spectrochemical analysis with a discussion of ark/spark optical emission spectrometers.
Of the arc/spark optical emission spectrometers in service today, 99% are used for the routine spectrochemical analysis of metals. Alloys of iron, aluminum, and copper together make up about 80% of this total. The remaining applications concern alloys of nickel, cobalt, zinc, titanium, magnesium, and the lead/tin/solder group. Refractories, precious metals, steel-making slags and geological materials, and other exotic materials account for the remaining 1% (2,3).
Arc/Spark Excitation
Electrical discharge excitation sources were developed in the latter part of the 19th entury. The first two decades of the 20th century saw considerable development in direct current, alternating current, and high voltage excitation sources.
In the arc/spark spectrometer, the excitation is produced by the energy of the electrical discharge between the sample and the electrode. The resulting plasma temperatures effectively remove sample material (called "ablation") and excite the constituent atoms. Today, this electrical discharge typically is carried out in an argon atmosphere, although all early instruments were run in air. For this type of spectrometer using electrical excitation, the sample must be electrically conductive. Therefore, this instrumentation is very popular in the metals industry.
The Spark Stand and Arc/Spark Source: A diagram of a typical spark stand (electrode and sample geometry) is shown in Figure 1. It illustrates the conventional "point-to-plane" configuration (electrode to sample). The electrode typically is made of tungsten, although graphite electrodes have been used in the past with nonferrous materials.

Figure 1: Basic sample stand configuration for arc/spark excitation.
The spark stand in modern instrumentation is flushed with argon to prevent oxidation effects and allow transmission of UV wavelengths absorbed by oxygen.
A very basic electrical circuit diagram used to provide the discharge is shown in Figure 2, where V is a voltage source, S is a switch, C a capacitor, L an inductor, and R is a resistor. When the switch is closed the capacitor is charged to the voltage V. When the switch is opened, the electrical energy stored in the capacitor is released through the inductor and resistor, producing a discharge across the spark gap.

Figure 2: Simple electrical circuit diagram for arc/spark excitation.
Several comments must be made concerning the basic electrical circuit of Figure 2:
- The voltage in the circuit is generally between about 400 and 1000 V. This is not enough to cross ("breakdown") the 3–4 mm spark gap. A much higher voltage, on the order of 10,000 V, is required. This is provided by an ignitor circuit (similar to the ignition coil of an automobile), whose sole function is to bridge the gap. Once this short path has been ionized, the lower voltage is sufficient for a continued discharge.
- In modern spark excitation sources, the discharge is unidirectional, from the electrode to the sample. To prevent an oscillating discharge as would occur normally in the circuit of Figure 2, a diode D is included across the capacitor. (A diode is an electrical circuit component that only permits a current to flow in only one direction.)
- The switch S is opened and closed electronically many times per second. This is referred to as the "frequency" of the discharge.
- The "spark gap" generally is referred to as the "analytical gap" in arc/spark spectrometry. The 5000–15,000 K plasma temperatures generated in this region is where the analytical processes important for spectrochemical analysis occur. The sample is the cathode (negative) and the electrode is the anode (positive).
The nature of the electrical discharge between the sample and electrode is dependent on the electrical parameters of the source, specifically, the values of R, L, and C. These parameters determine the way the current varies with time in the analytical gap. The electrical discharges fall into three categories: spark-like, arc-like, and high-energy prespark (HEPS) discharges. The latter is not really an excitation at all, but rather a sample homogenization discharge.
Spark-Like and Arc-Like Excitation: Spark-like refers to high-current discharges that come in short bursts, like "gunshots." For a "spark-like" discharge, some typical electrical parameters are as follows:
- Frequency: 200–1000 Hz
- Operating voltage: 400–1000 V
- Peak current: 50–150 A
- FWHM: 50–100 µs
Note: FWHM is "full width at half maximum," in this case a measure of the duration of the electrical discharge.
Arc-like refers to a lower current, drawn-out, almost continuous discharge. Arc-like discharges can be either direct current (DC), or alternating current (AC) with a frequency like the spark-like discharges discussed earlier. The DC arc is a low-current discharge, on the order of perhaps 3–10 A. The AC arc can provide currents as high as 20–30 A with a frequency of 100–200 Hz and a total duration for each cycle of 500–1000 µs.
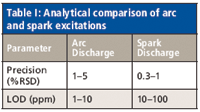
Analytically, the differences between the arc and spark excitations can be summarized as in Table I, which compares precision and limits of detection (LODs). The precision numbers listed are at concentrations well above the limit of detection.

Table I: Analytical comparison of arc and spark excitations
The primary function of the excitation source is to generate spark- or arc-like electrical discharges. These will vaporize sample material and produce excitation of the electrons of the atoms for the measurement of spectral line light intensities.
High Energy Prespark: The excitation source has, however, a second very important function: The sample surface is first subjected to a HEPS. This is a high-current spark discharge designed to homogenize the sample surface in preparation for the actual measurement of light intensities which follows.
The action of HEPS can be compared to that of a remelt furnace, in the sense that the sample surface subjected to the electrical discharge is effectively "re-melted." This technique is important in removing any effects of the metallurgical history or structure of the sample (for example, cast versus wrought, heat treatment, and so forth). Typical prespark currents can be from about 120 to 150 A with durations from about 10 to 20 s. Depending upon the electrical parameters used, the crater produced in the sample surface during the high-energy prespark is about 10 mm in diameter with a maximum depth (penetration at the center) on the order of 50 μm.
Excitation Source Cycle: After the prespark period the sample is ready for the actual measurement or integration of the light intensity signals. This is generally carried out with a spark-like discharge for about a 5-s time period. Arc-like discharges are used primarily where very small amounts of the elements present must be detected (see Table I). If this were the case, however, we would include a second integration or measurement period of 5 s using an arc-like discharge. Therefore, the complete source cycle during the sparking of a sample would look like the following:
- HEPS (homogenization): 10 s
- Spark (measurement): 5 s
- Arc (measurement): 5 s
Special Topics
Time-Resolved Spectrometry: There is spectral background radiation across the electromagnetic spectrum and this is crucial to an understanding of detection limits. The spectral background radiation determines the limit of detection attainable at any particular analytical spectral line for a given optical system (4,5). If this background could somehow be reduced, then better detection limits would result.
Figure 3 shows a rough sketch of the time evolution of the light intensities in a spark-like discharge. It shows the background radiation along with light from both ionic and atomic spectral lines. By eliminating the initial spectral background and ionic line radiation, a significant reduction in the spectral "noise" could be achieved for atomic spectral lines. We must delay the integration of the light intensity by about 100–150 µs after initiation of the spark. The actual integration should take place in the "afterglow" period, that is, after the actual spark discharge shuts down.

Figure 3: Time evolution of light intensities from a spark discharge.
Note that the idea of time resolving the measured light intensities is not new. Spectroscopists have researched this technique since the early part of the 20th century. Early work used a rotating disk with only a small opening to allow light to pass. The rotation of the disk could be timed so that any particular time period of the discharge could be viewed. Today, the procedure is much easier through the use of electronics.
An electronic gate is inserted between the output of the photomultiplier tube and the integrator. After the preset time delay, the light signal from the photomultiplier is integrated for a short time, on the order of 50 µs. Because of the low signal level, an amplifier is necessary.
Time-resolved spectroscopy (TRS) provides several benefits for the analyst (3):
- Improved detection limits: The limits of detection improve by a factor of 10–100 for the aluminum and copper alloys. For ferrous alloys, the improvement in LODs is less, generally on the order of 2–10 times. This might be attributed to the magnitude of spectral lines for iron.
- Reduced interelement effects: Another result of the time-resolved spectroscopy technique is the reduction of line overlap problems from ionic spectral lines. The majority of the light from the ionic lines is no longer integrated by using a time delay.
- Improved calibration: The calibration curve fits for trace elements in aluminum and copper also show improvement using TRS. The quality of the curve fit improves by about a factor of about four using this technique.
Single Spark Evaluation: In conventional spark OES, the emission intensities of the individual sparks generally is integrated over a suitable measurement interval, usually about 5 s. However, instead of integrating, with suitable readout electronics it is possible to evaluate the intensity of each individual spark.
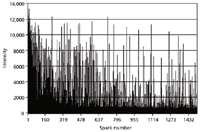
For the matrix element and elements in solid solution, this produces a random (Gaussian) distribution of spark intensities. Things become more interesting, however, when one evaluates the single sparks of inclusions. Figure 4 shows the pulse height distribution of 1500 single sparks as measured at the Al I 396.1 nm spectral line in a low alloy steel sample (6).

Figure 4: Single-spark evaluation spectrum of Al in steel.
The aluminum in this certified reference material is present in both insoluble and acid soluble components. The baseline intensities (around 500 counts) are representative of the soluble fraction, whereas the spikes up to several thousand counts are due to the spark discharge encountering an inclusion (Al2O3).
This technique has important applications for steelmakers as it allows a quick determination of the "cleanliness" of the steel, a function of the number of inclusions.
Volker Thomsen, a physicist by training, has some 30 years of experience in elemental spectrochemical analysis (OES and XRF). He is currently a consultant in this area from his home in Atibaia, São Paulo, Brazil. His other interests include mineralogy and history of science. Occasionally, he still plays the blues harmonica. He can be reached at vbet1951@uol.com.br.
References
(1) V. Thomsen, Spectroscopy 25(1), 46–54 (2010).
(2) K. Slickers, Automatic Emission Spectroscopy, 2d ed. (Bruehlische Univ. Press, Germany, 1993).
(3) V. Thomsen, Modern Spectrochemical Analysis of Metals: An Introduction for Users of Arc/Spark Instrumentation (ASM International, Materials Park, Ohio, 1996).
(4) V. Thomsen, G. Roberts, and K. Burgess, Spectroscopy 15(1), 33–36 (2000).
(5) V. Thomsen, D. Schatzlein, and D. Mercuro, Spectroscopy 18(12), 112–114 (2003).
(6) V. Thomsen, Spectroscopy 16(12), 20–22 (2001).

Best of the Week: AI and IoT for Pollution Monitoring, High Speed Laser MS
April 25th 2025Top articles published this week include a preview of our upcoming content series for National Space Day, a news story about air quality monitoring, and an announcement from Metrohm about their new Midwest office.
LIBS Illuminates the Hidden Health Risks of Indoor Welding and Soldering
April 23rd 2025A new dual-spectroscopy approach reveals real-time pollution threats in indoor workspaces. Chinese researchers have pioneered the use of laser-induced breakdown spectroscopy (LIBS) and aerosol mass spectrometry to uncover and monitor harmful heavy metal and dust emissions from soldering and welding in real-time. These complementary tools offer a fast, accurate means to evaluate air quality threats in industrial and indoor environments—where people spend most of their time.