The Grand Review II: Why Do Different Functional Groups Have Different Peak Heights and Widths?
Integrating peak position, height, and width information is important to properly interpret infrared spectra. But do you understand why peak heights and widths vary? We explain.
As part of our ongoing review of infrared spectroscopic theory, we will discuss why different functional groups have different peak heights and widths. We find that Beer’s law determines peak height, and that the absorptivity in Beer’s law depends upon a mysterious quantity called the dipole moment, and is in large part responsible for why infrared peaks vary in size, from large to non-existent. Infrared peak widths can vary from a few wavenumbers to thousands of wavenumbers in width. We explore the role of intermolecular interactions in this phenomenon. We will wrap up by discussing the importance of integrating peak position, height, and width information to properly interpret spectra.
When I first introduced infrared spectral interpretation theory many columns ago (1), it was interspersed with discussions of the interpretation of specific functional groups. This approach made sense at the time, but, by not presenting all the theory of a piece, some important concepts that you need to know to interpret spectra successfully might have gotten short shrift. Hence the need for this Grand Review.
There are three important pieces of information in an infrared spectrum; peak positions, peak heights, and peak widths. All these pieces of information can be used to distinguish different functional groups from each other, and I have emphasized repeatedly in my columns the importance of integrating all these pieces of information to interpret spectra. It then makes sense for you to learn the reasons why different functional groups have different peak position, heights, and widths.
In my last column, I discussed why different functional groups have different peak positions (2). Here, we will discuss why different functional groups have different peak heights and widths. We will find that Beer’s law determines peak height, and that the absorptivity in Beer’s law depends upon a mysterious quantity called the dipole moment, and is in large part responsible for why infrared peaks vary in size from large to nonexistent. Infrared peak widths can vary from a few wavenumbers to thousands of wavenumbers in width. We will explore the role of intermolecular interactions in this phenomenon.
Peak Heights
When plotted in absorbance, the peak heights in an infrared spectrum are proportional to concentration, allowing infrared spectra to be used to determine the concentration of chemical species in samples (3). The relationship between absorbance and concentration is summarized in Beer’s law (3):
where A equals absorbance, ɛ equals absorptivity, l equals pathlength, and c equals concentration.
The pathlength is simply the thickness of sample seen by the infrared beam. The absorptivity is the proportionality constant between absorbance and concentration. The absorptivity also has physical meaning; it is a constant for a given pure molecule at a given wavenumber. For example, the absorptivity of pure acetone at 1716 cm-1 (if not stated, assume all peak positions are in cm-1 going forward) under standard conditions of temperature and pressure is a constant. This means that, under these conditions and for a fixed pathlength, a sample of pure acetone will always absorb the same amount of light at 1716.
Since different molecules have different absorptivities, this quantity must somehow be related to chemical structure. Consider the electronic structure of the CO2 molecule seen in Figure 1.
FIGURE 1: The dipole moments of the CO2 molecule. Par- tial positive charges are represented by δ+ and partial negative charges by δ-. The dipole moment vectors are represented by arrows.

In CO2, the electronegativity difference between the carbon and the oxygen atoms causes the electrons to be shared unevenly (4), leading to a partial positive charge on the carbon, and partial negative charges on the oxygens. In Figure 1, a partial positive charge is represented by a δ+, and a partial negative charge by a δ-.
A dipole moment can be defined as two charges separated by a distance. Since chemical bonds, such as the ones in CO2, can consist of charges separated by a distance, chemical bonds have what are called bond dipole moments. The bond dipole is a vector quantity; it has a magnitude and direction. The arrows in Figure 1 show the dipole moment vectors for CO2. Each arrow’s length represents the magnitude of the dipole moment for that bond, while the arrow head denotes its direction.
The magnitude of a bond dipole is simply the size of the charges multiplied by their distance apart, and can be calculated as such:
where μ equals dipole moment, q equals the charge, and r equals the distance.
The bond dipole is a measure of charge asymmetry, and bonds with large charges held far apart having bigger dipole moments than bonds with small charges held close together. Thus, polar bonds, such as O-H and C=O, have large charge asymmetry, and therefore large dipole moments. Covalent bonds such as C-C bonds have small change asymmetry, and therefore small dipole moments.
The net dipole moment for a molecule is the sum of the bond dipoles for that molecule. Note in Figure 1 that, for CO2 at equilibrium, the two bond dipoles are equal in magnitude and opposite in direction. When added together, these two dipole moments cancel each other, giving a net dipole of zero.
So what does all this dipole moment stuff have to do with molecular vibrations and peak heights? Consider the symmetric and asymmetric stretching peaks of CO2, seen in Figure 2.
FIGURE 2: The symmetric and asymmetric stretches of the CO2 molecule.

During the symmetric stretch, the length of the bonds changes, but, since they stretch in phase with each other, the two bonds are always the same length, and always point in opposite directions. We say the symmetry of the molecule is maintained during the symmetric stretch (hence its name), and further meaning that the net dipole of the molecule is always zero at all points during this stretch. We can then say that, for the symmetric stretch of CO2, the change in dipole moment, dμ, with respect to the bond length, dx, is zero. In other words:
An inspection of the infrared spectrum of CO2 shows the intensity of its symmetric stretching peak is zero, which means there is no peak corresponding to the symmetric stretch in CO2’s spectrum. Notice that there is a connection between dμ/dx being zero and the peak intensity being zero.
On the other hand, when CO2 undergoes an asymmetric stretch, as seen in Figure 2, the bond’s lengths are different at the same point in time. This means at points during this vibration, the two bond dipoles have different values, and that the net dipole is non-zero during this vibration. In this case, we say the symmetry of the molecule is broken, hence the name asymmetric stretch. Since the two bond dipoles values vary during the asymmetric stretch, this means the net dipole during this vibration has non-zero values. In other words:
for the asymmetric stretch of CO2. In fact, dμ/dx is quite large for this vibration, since we are stretching large dipole moments asymmetrically. The asymmetric stretching peak in the spectrum of CO2 falls around 2350cm-1, and is quite intense, as seen in Figure 3. In fact, it is the intensity of this absorbance that makes CO2 such a potent greenhouse gas.
FIGURE 3: The mid-infrared spectrum of Earth’s atmosphere. Note the relative strength of the CO2 asymmetric stretching peak at 2350 cm-1.
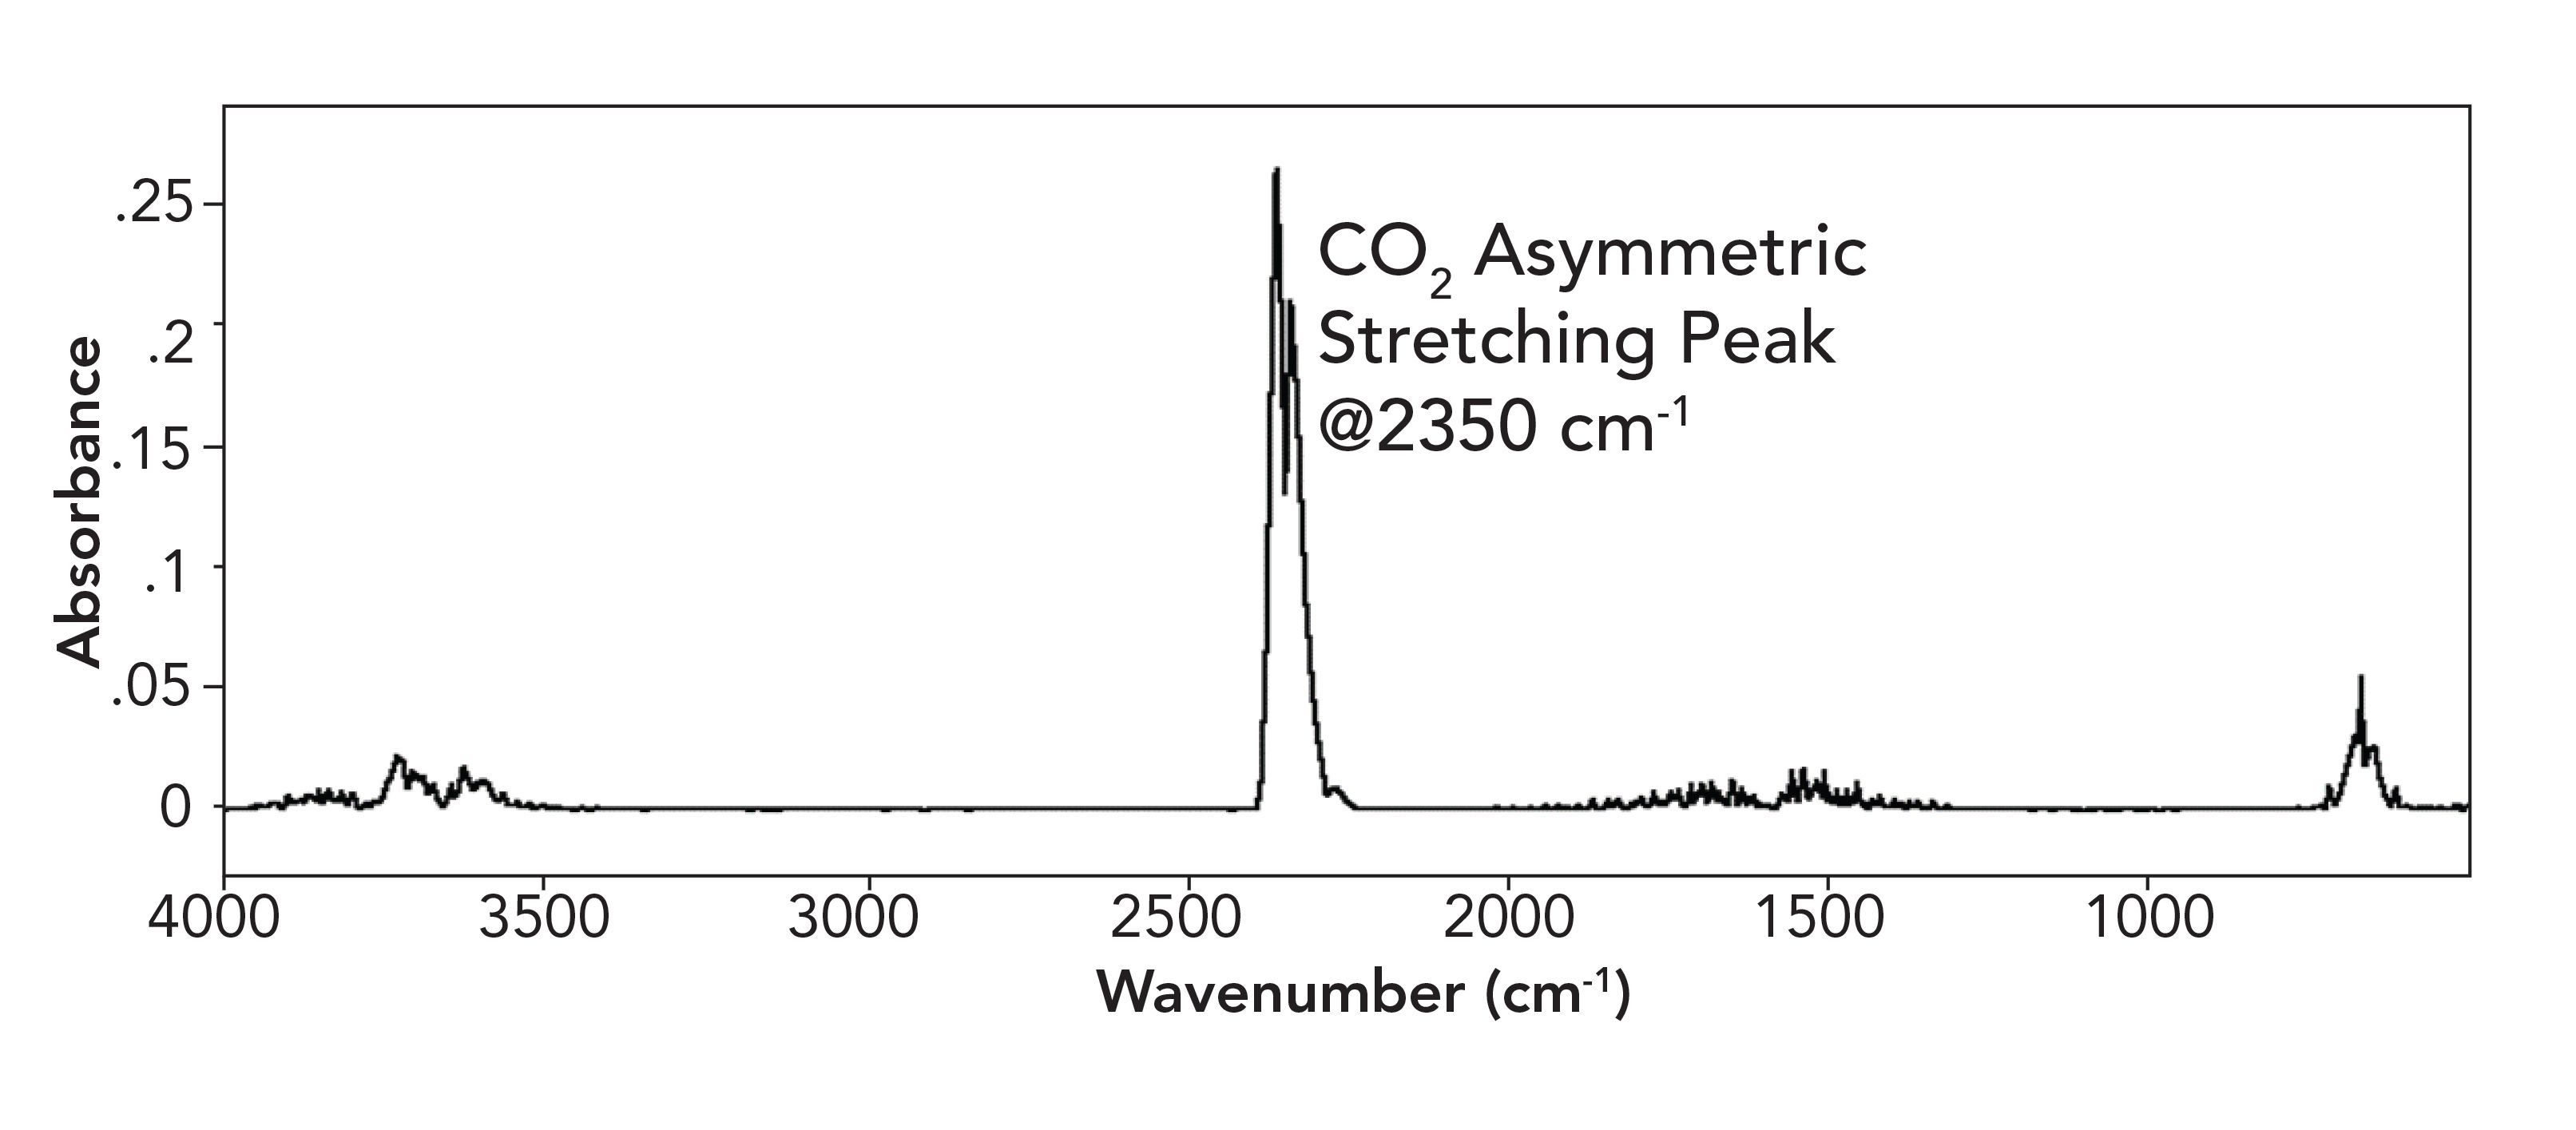
You may have seen 2350 peak before in sample spectra measured with a Fourier-transform infrared (FT-IR) spectrometer. This peak occurs when the CO2 concentration inside the spectrometer increases between the measurement of the background and sample spectra (please consult my book on FT-IR to learn how to avoid this problem [5]).
Note that dμ/dx for the asymmetric stretch of CO2 is large, and the vibration’s corresponding peak is large. What, then, is the connection between dμ/dx and intensity, and how does this new discovery of ours fit in with Beer’s law?
I will skip the derivation here, but quantum mechanics tells us that (6):
ɛ = (dμ/dx)2 [5]
where ɛ equals absorptivity, dμ equals change in dipole moment during a vibration, and dx equals change in bond length during a vibration.
Therefore, the absorptivity depends upon the change in dipole moment with respect to bond length during a vibration squared. In other words, the absorptivity depends upon how the electronic structure of a molecule or functional group changes during a vibration. It is this equation that links peak height to molecular structure, and is why different functional groups have different peak heights.
A vibration such as the symmetric stretch of CO2 for which dμ/dx = 0 and the resultant peak intensity is zero is called an infrared inactive vibration. On the other hand, vibrations such as the asymmetric stretch of CO2 for which dμ/dx ≠ 0 and the resultant peak’s intensity is non-zero are called infrared active peaks. One of the reasons that the number of normal modes a molecule has is greater than its number of infrared peaks is that not all vibrations are infrared active.
Polar functional groups such as C-O or C=O have large values of μ, hence have vibrations with large values of dμ/dx, and generally have intense peaks. On the other hand, for non-polar functional groups, such as C-C bonds that have small values of μ and their vibrations have small values of dμ/dx, their peaks are generally small. This means that infrared spectroscopy is better at detecting some functional groups than others, and that polar functional groups are generally the easiest to see. In other words, infrared spectroscopy is not a democracy, and, from the point of view of an infrared spectrometer, not all functional groups are created equal. This actually limits us as to what functional groups infrared spectroscopy can see. Fortunately, other molecular spectroscopy techniques, such as Raman scattering, are excellent at seeing the functional groups infrared (IR) cannot see, and thus can take up the slack.
Peak Widths
In addition to peak positions and heights, peak widths can also be used to distinguish functional groups. Infrared peak widths vary greatly across the spectrum of known molecules. Figure 4 shows the infrared spectrum of liquid water.
FIGURE 4: The infrared spectrum of liquid water. The O-H stretching peak centered near 3300 cm-1 has a full width half maximum (FWHM) of about 500 cm-1.
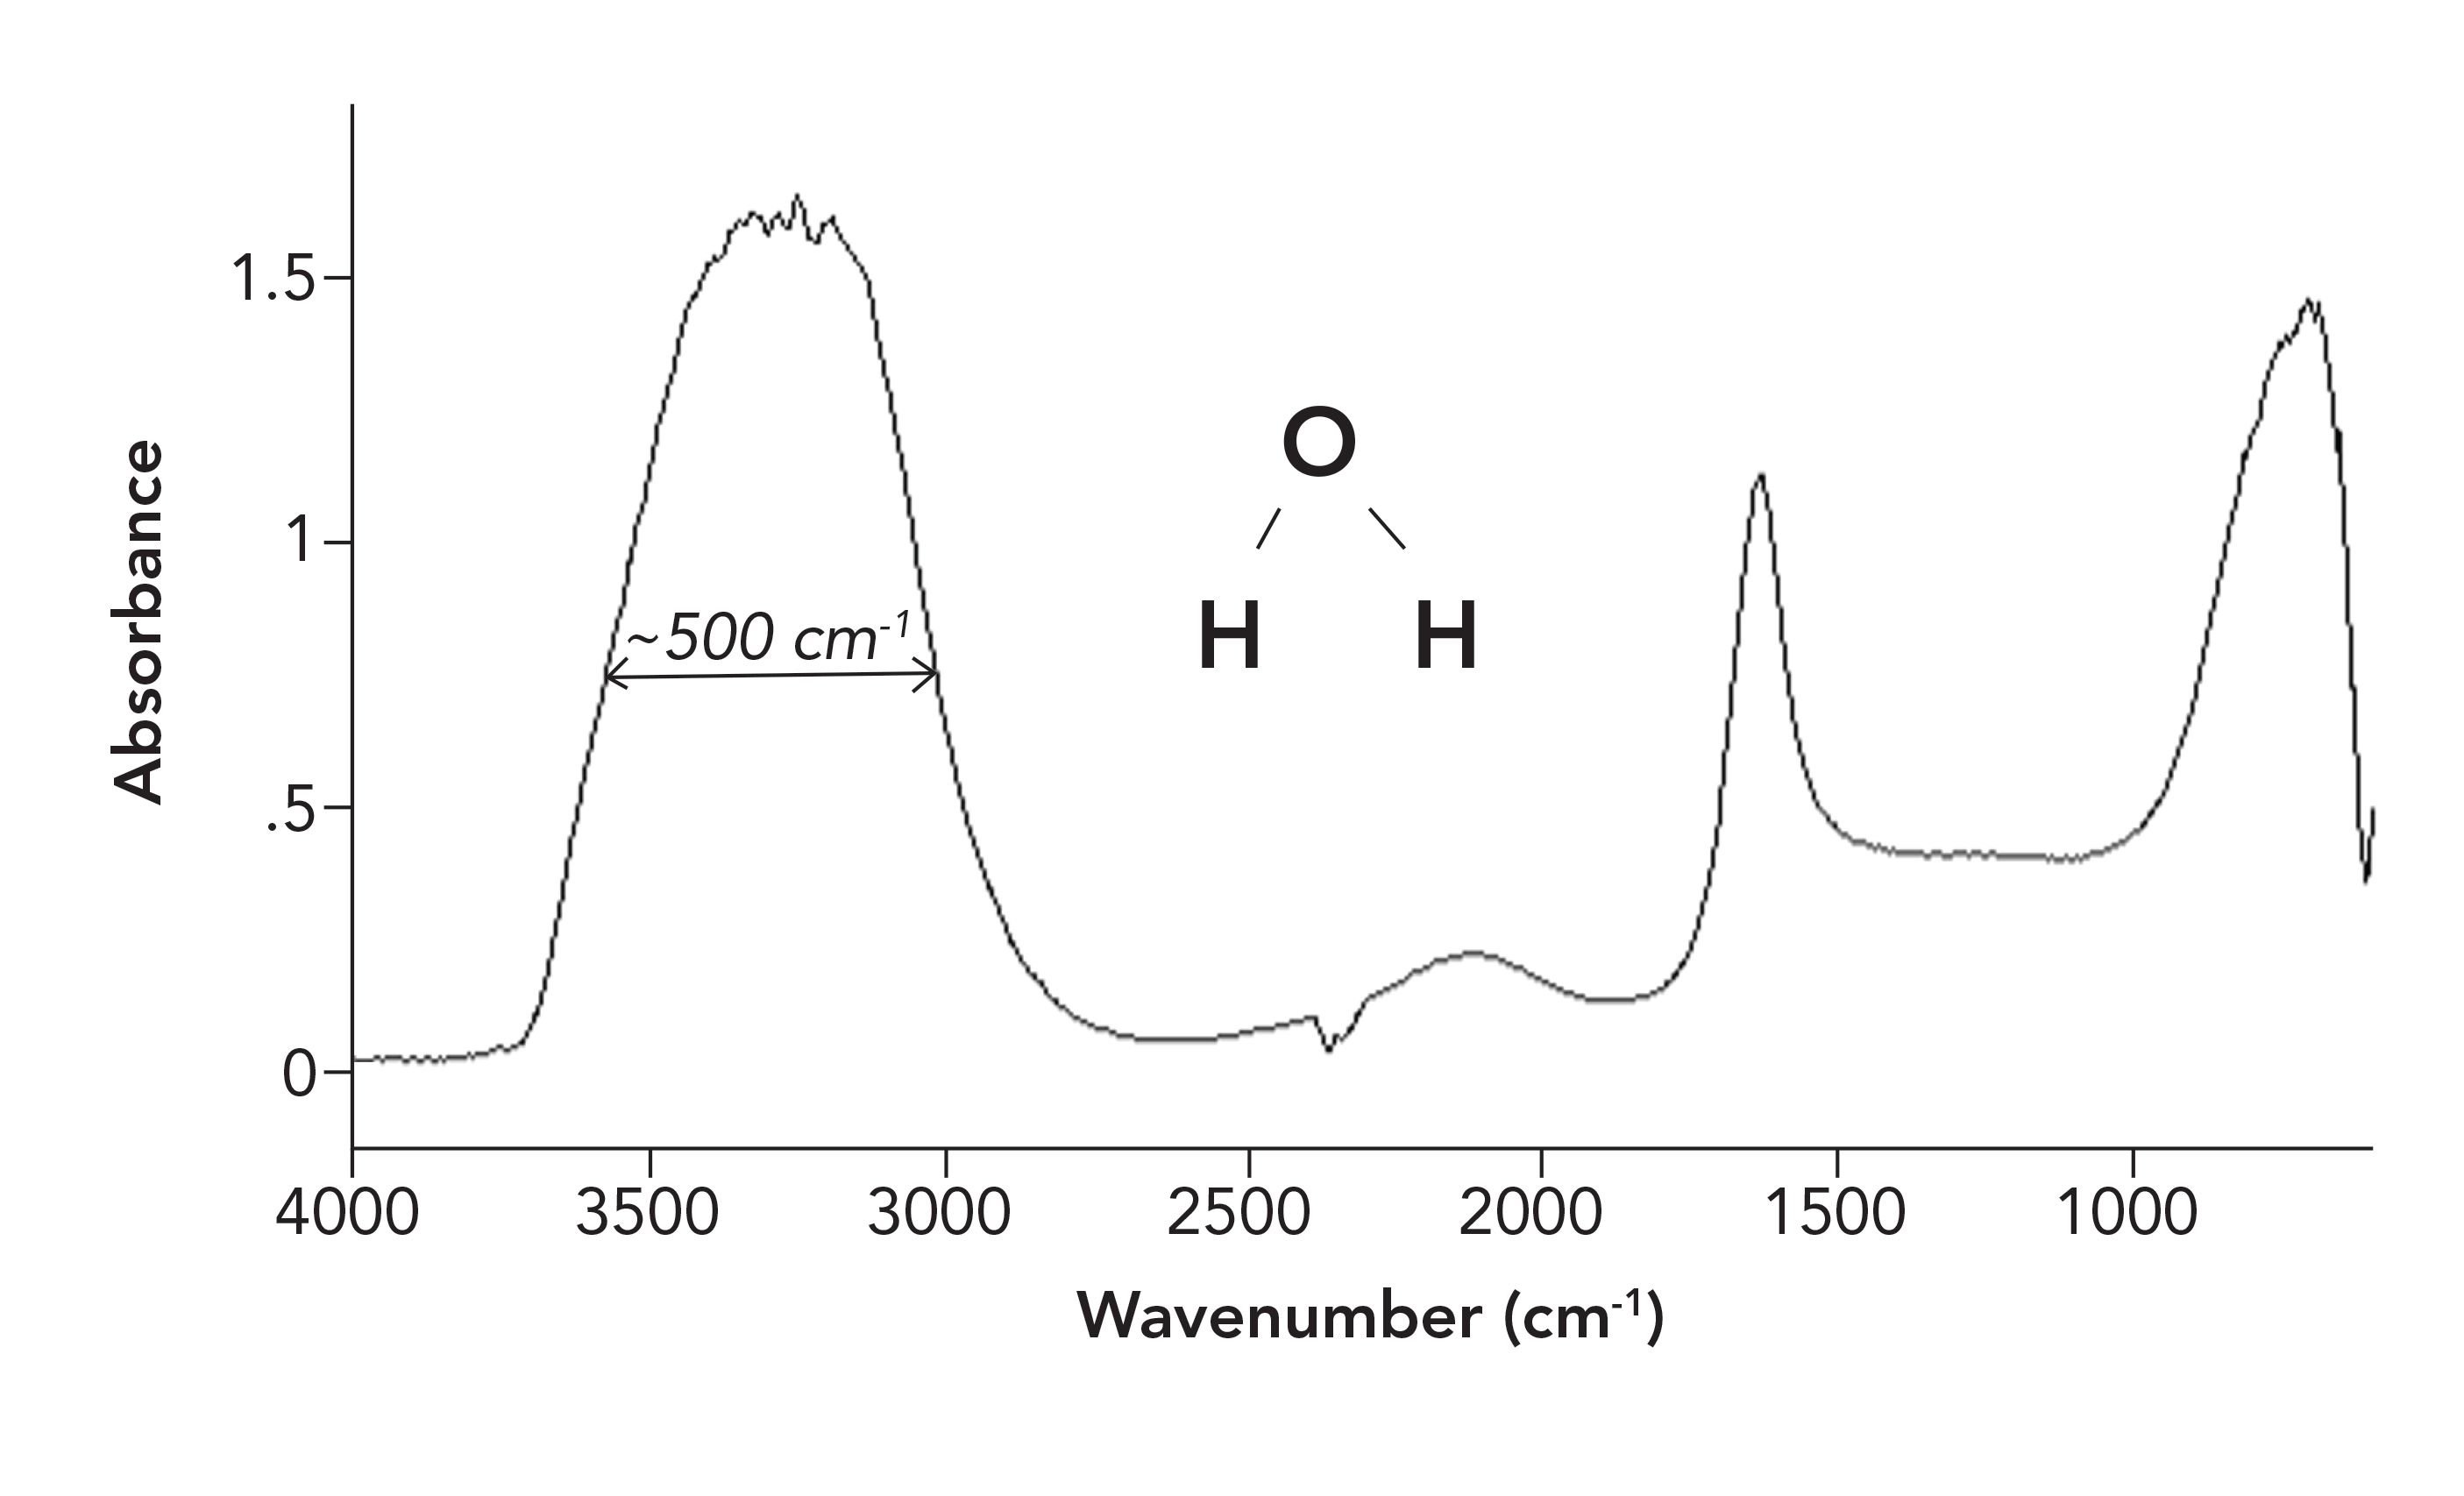
Infrared peaks are generally narrow at their tops, and wider at their bottoms. How, then, do we measure peak widths in a standard fashion? One way spectroscopists do this is to measure what is called the full width half maximum (FWHM) of a peak (6). To measure a FWHM, take the height of a peak, go to where it is half this height, and then measure its width there. For example, if a peak is 1.0 absorbance unit (AU) high, we would measure this peak’s FWHM at 0.5 AU. The FWHM os the O-H stretching peak of water at 3300 cm-1 is about 500 cm-1, as illustrated in Figure 4. This is an unusually broad peak for an infrared spectrum.
Figure 5 shows an example of a spectrum with narrow peaks; it is of the molecule benzonitrile.
FIGURE 5: The infrared spectrum of benzonitrile. The FWHM of the peak at 2228 cm-1 is less than 10 cm-1, as indicated by the red dot.
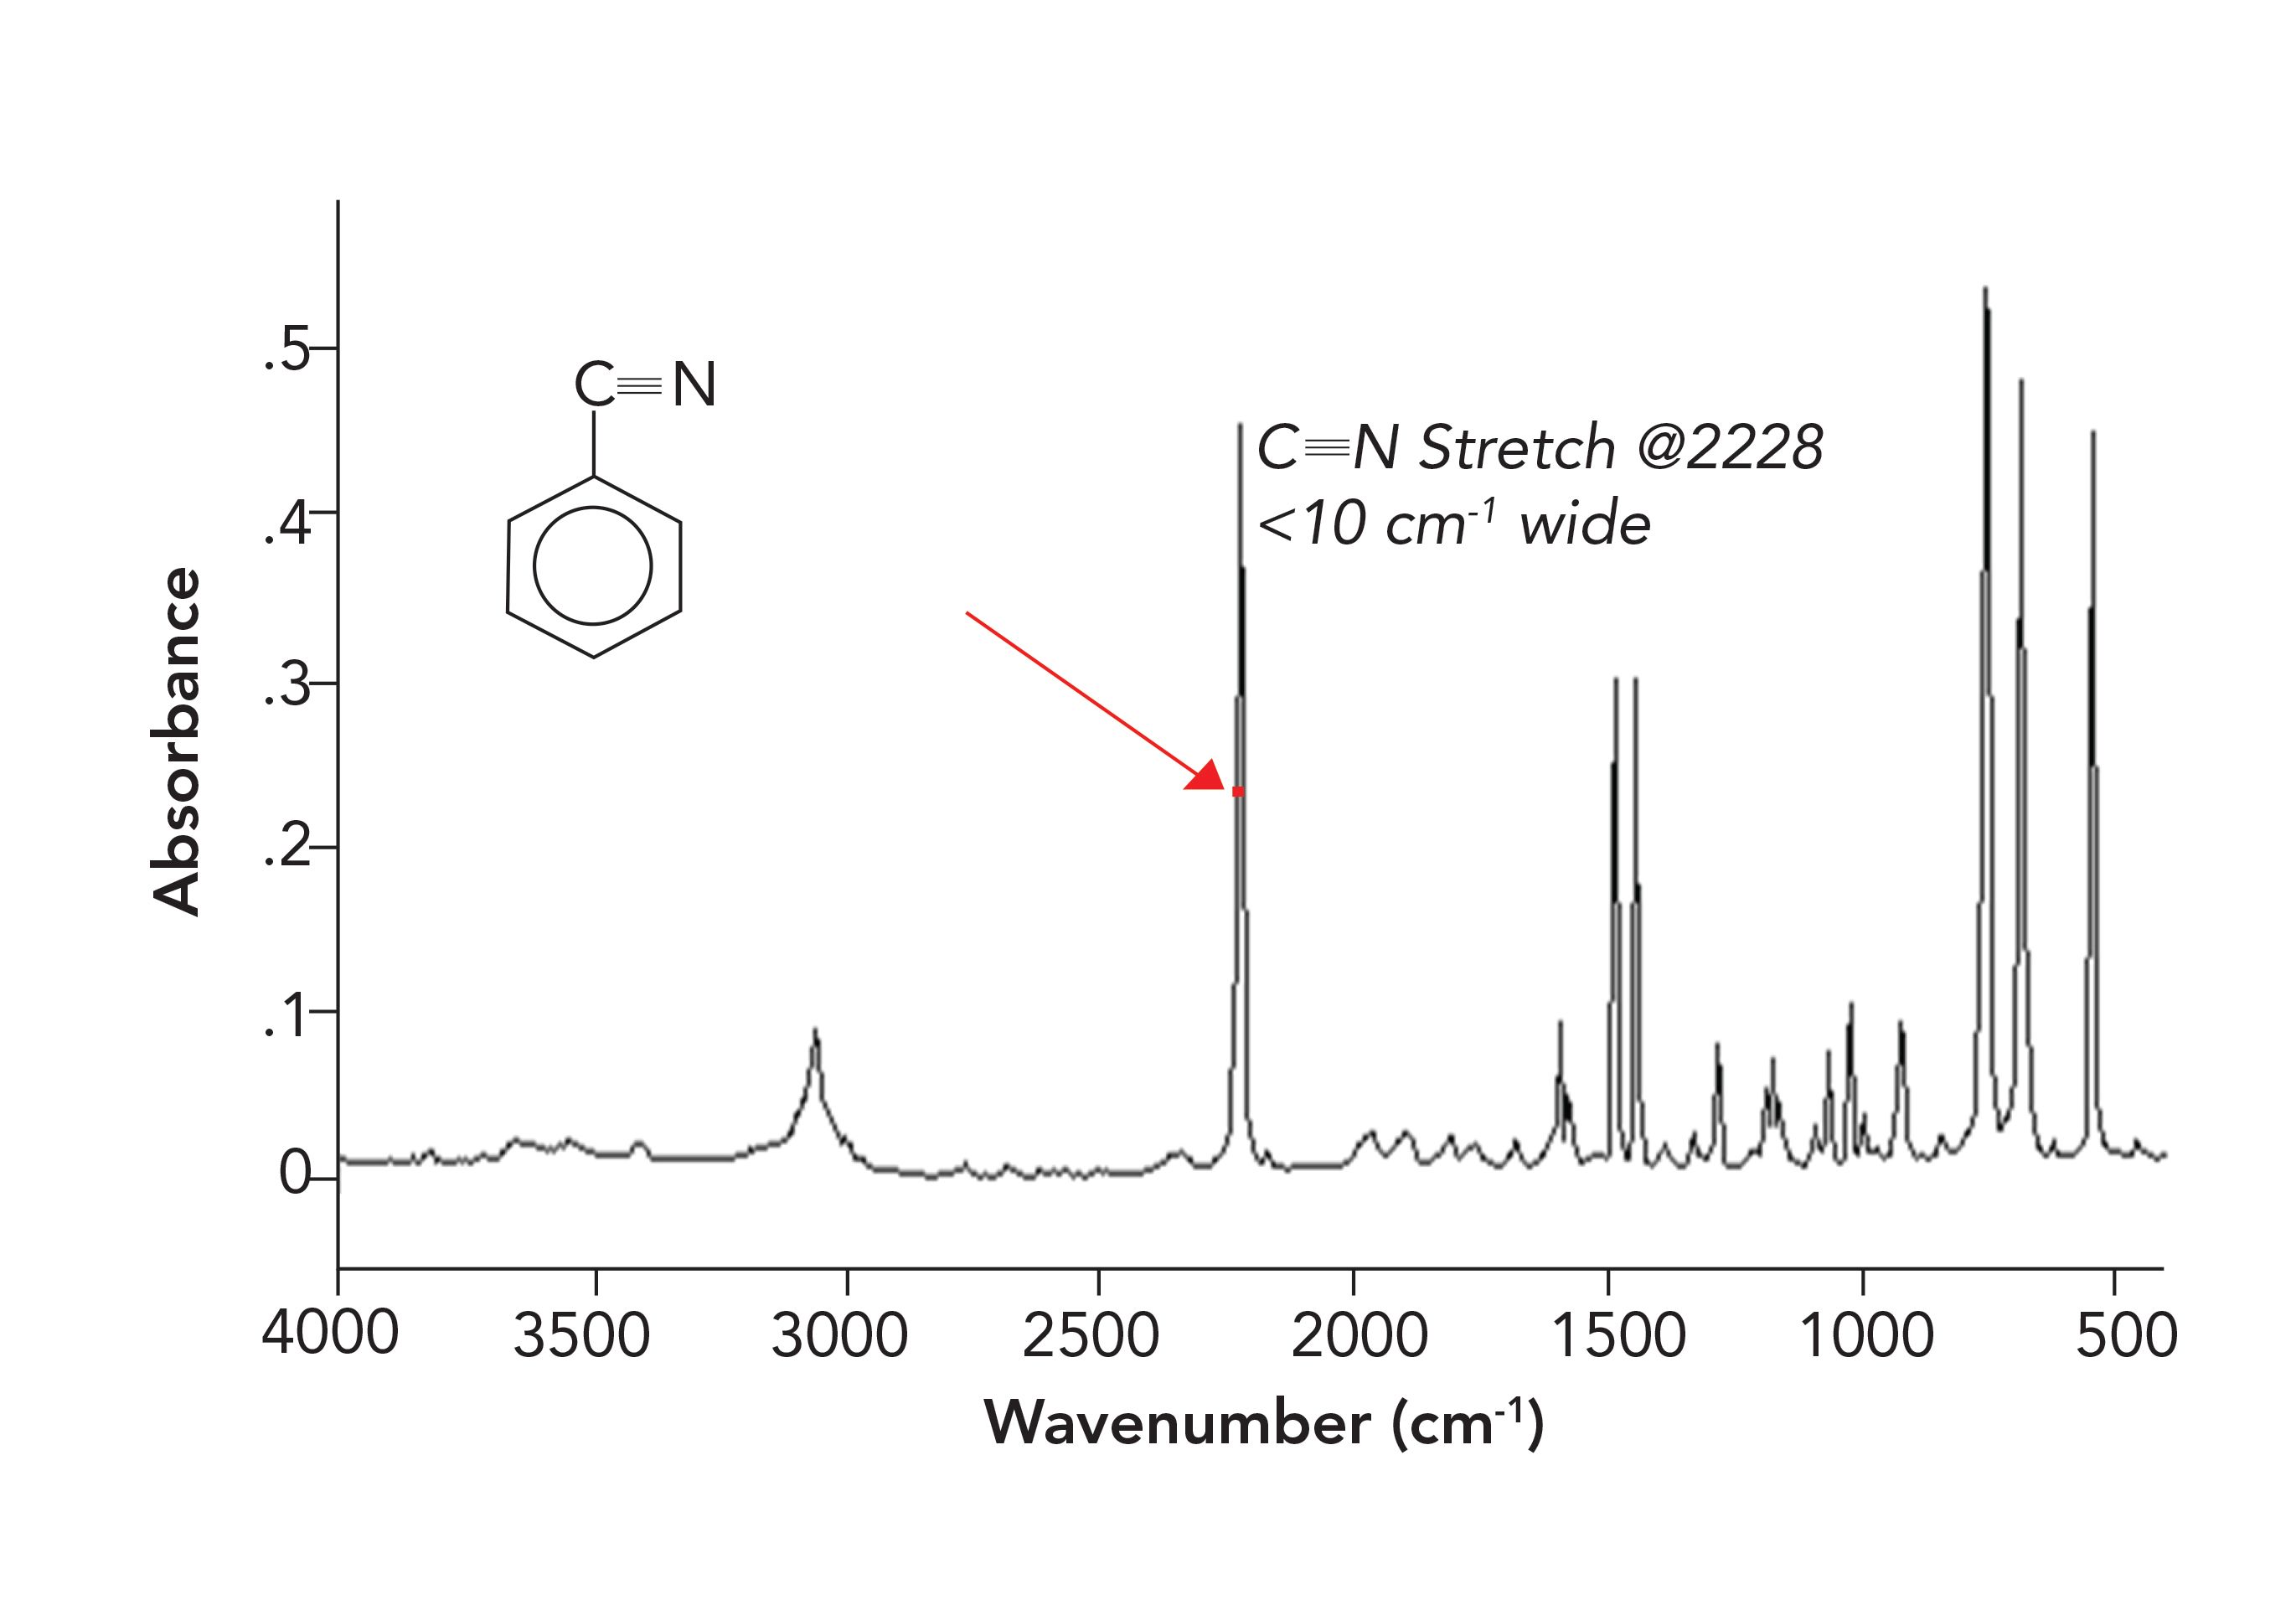
In Figure 5, the FWHM of the C≡N stretching peak at 2228 is less than 10 cm-1. The barely discernible red dot shows the FWHM. This peak is 50 times narrower than the FWHM of the O-H stretching peak of water. Why?
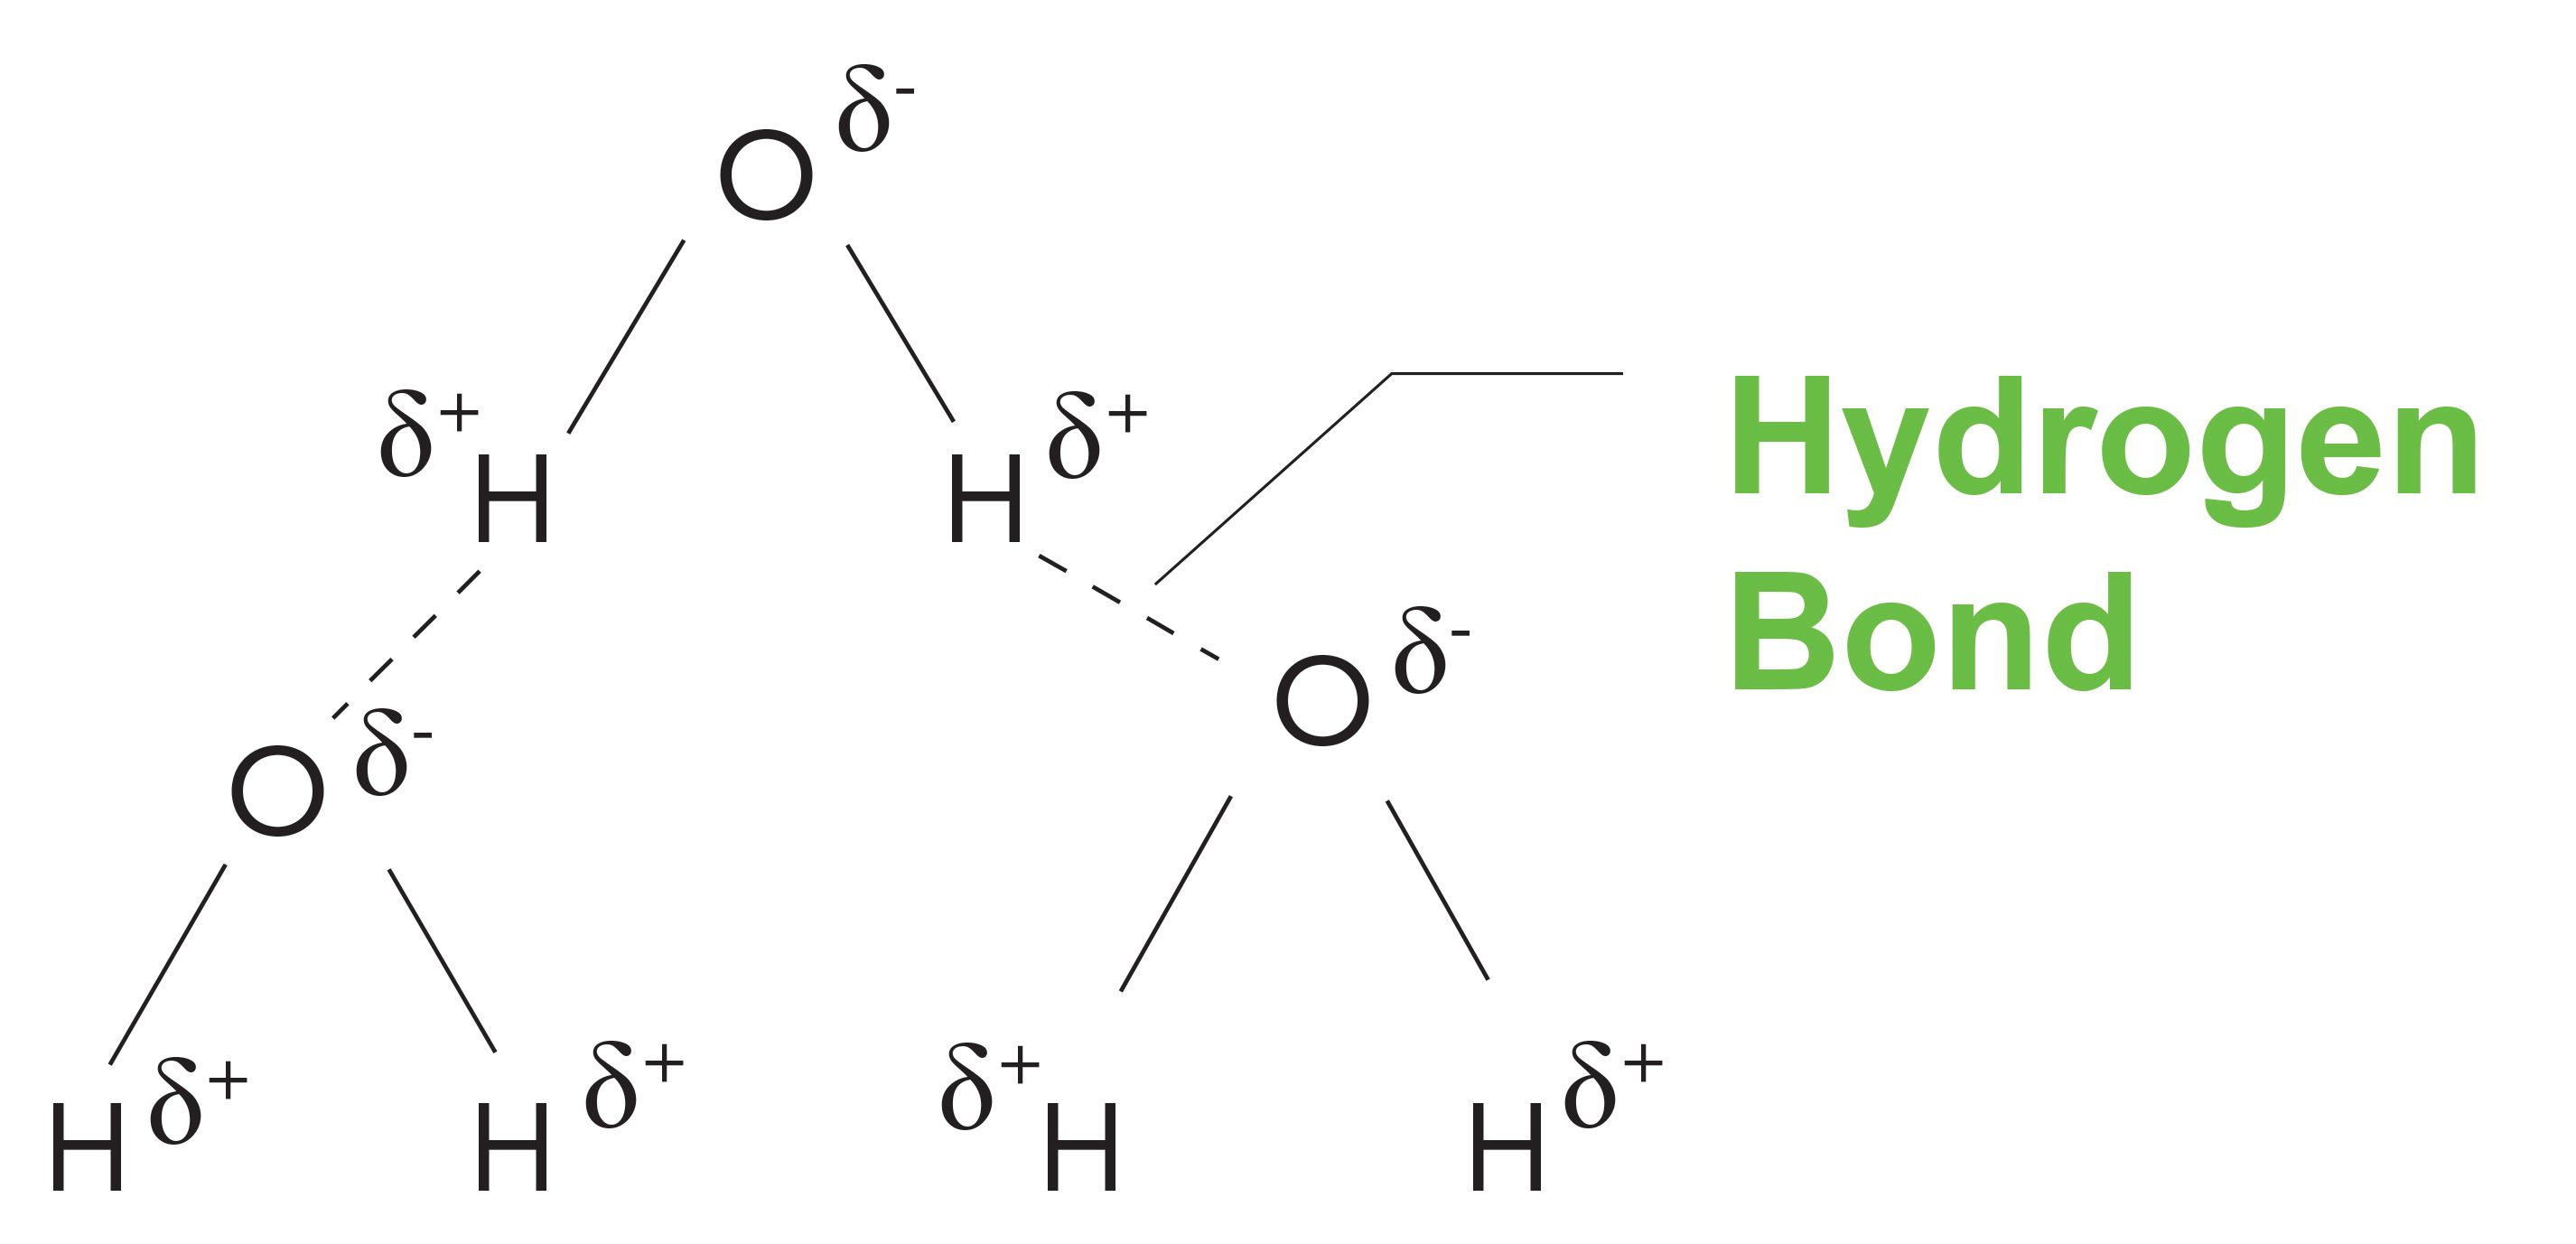
Consider Figure 6, which shows the interactions between neighboring water molecules, known as intermolecular interactions. The O-H bond in water is polar, because of the electronegativity differences between oxygen and hydrogen. This means, in an O-H bond, the hydrogen has a partial positive charge on it, and that the oxygen has a partial negative charge on it. Because of this, individual water molecules coordinate with each other with the partially positive hydrogen of one molecule interacting with the partially negative oxygen on a neighboring molecule, as seen in Figure 6. These two molecules form a weak, but very real, chemical bond called a hydrogen bond. These are represented by the dashed lines in Figure 6. Hydrogen bonds are an example of a strong intermolecular interaction, and note that water has broad peaks. In fact, any functional group that engages in hydrogen bonding, including alcohols, carboxylic acids, and amines, will have broadened peaks as a result of hydrogen bonding.
FIGURE 6: An illustration of the hydrogen bonding that takes place in liquid water.
As noted, benzonitrile has narrow peaks. Why? The bonds in this molecule are non-polar, so there is no hydrogen bonding, and the interactions between neighboring molecules is weak, consisting of what are called van der Waals bonds (6). This shows us that molecules with weak intermolecular interactions have narrow peaks. Ultimately, then, the peak widths in infrared spectra are determined by the strength of intermolecular interactions; this is why peak width differences can be used to distinguish functional groups from each other. An example of this is seen in Figure 7.
FIGURE 7: (a) The N-H stretching peaks of a primary amine. (b) The O-H stretching peak of an alcohol. Note the difference in peak widths.
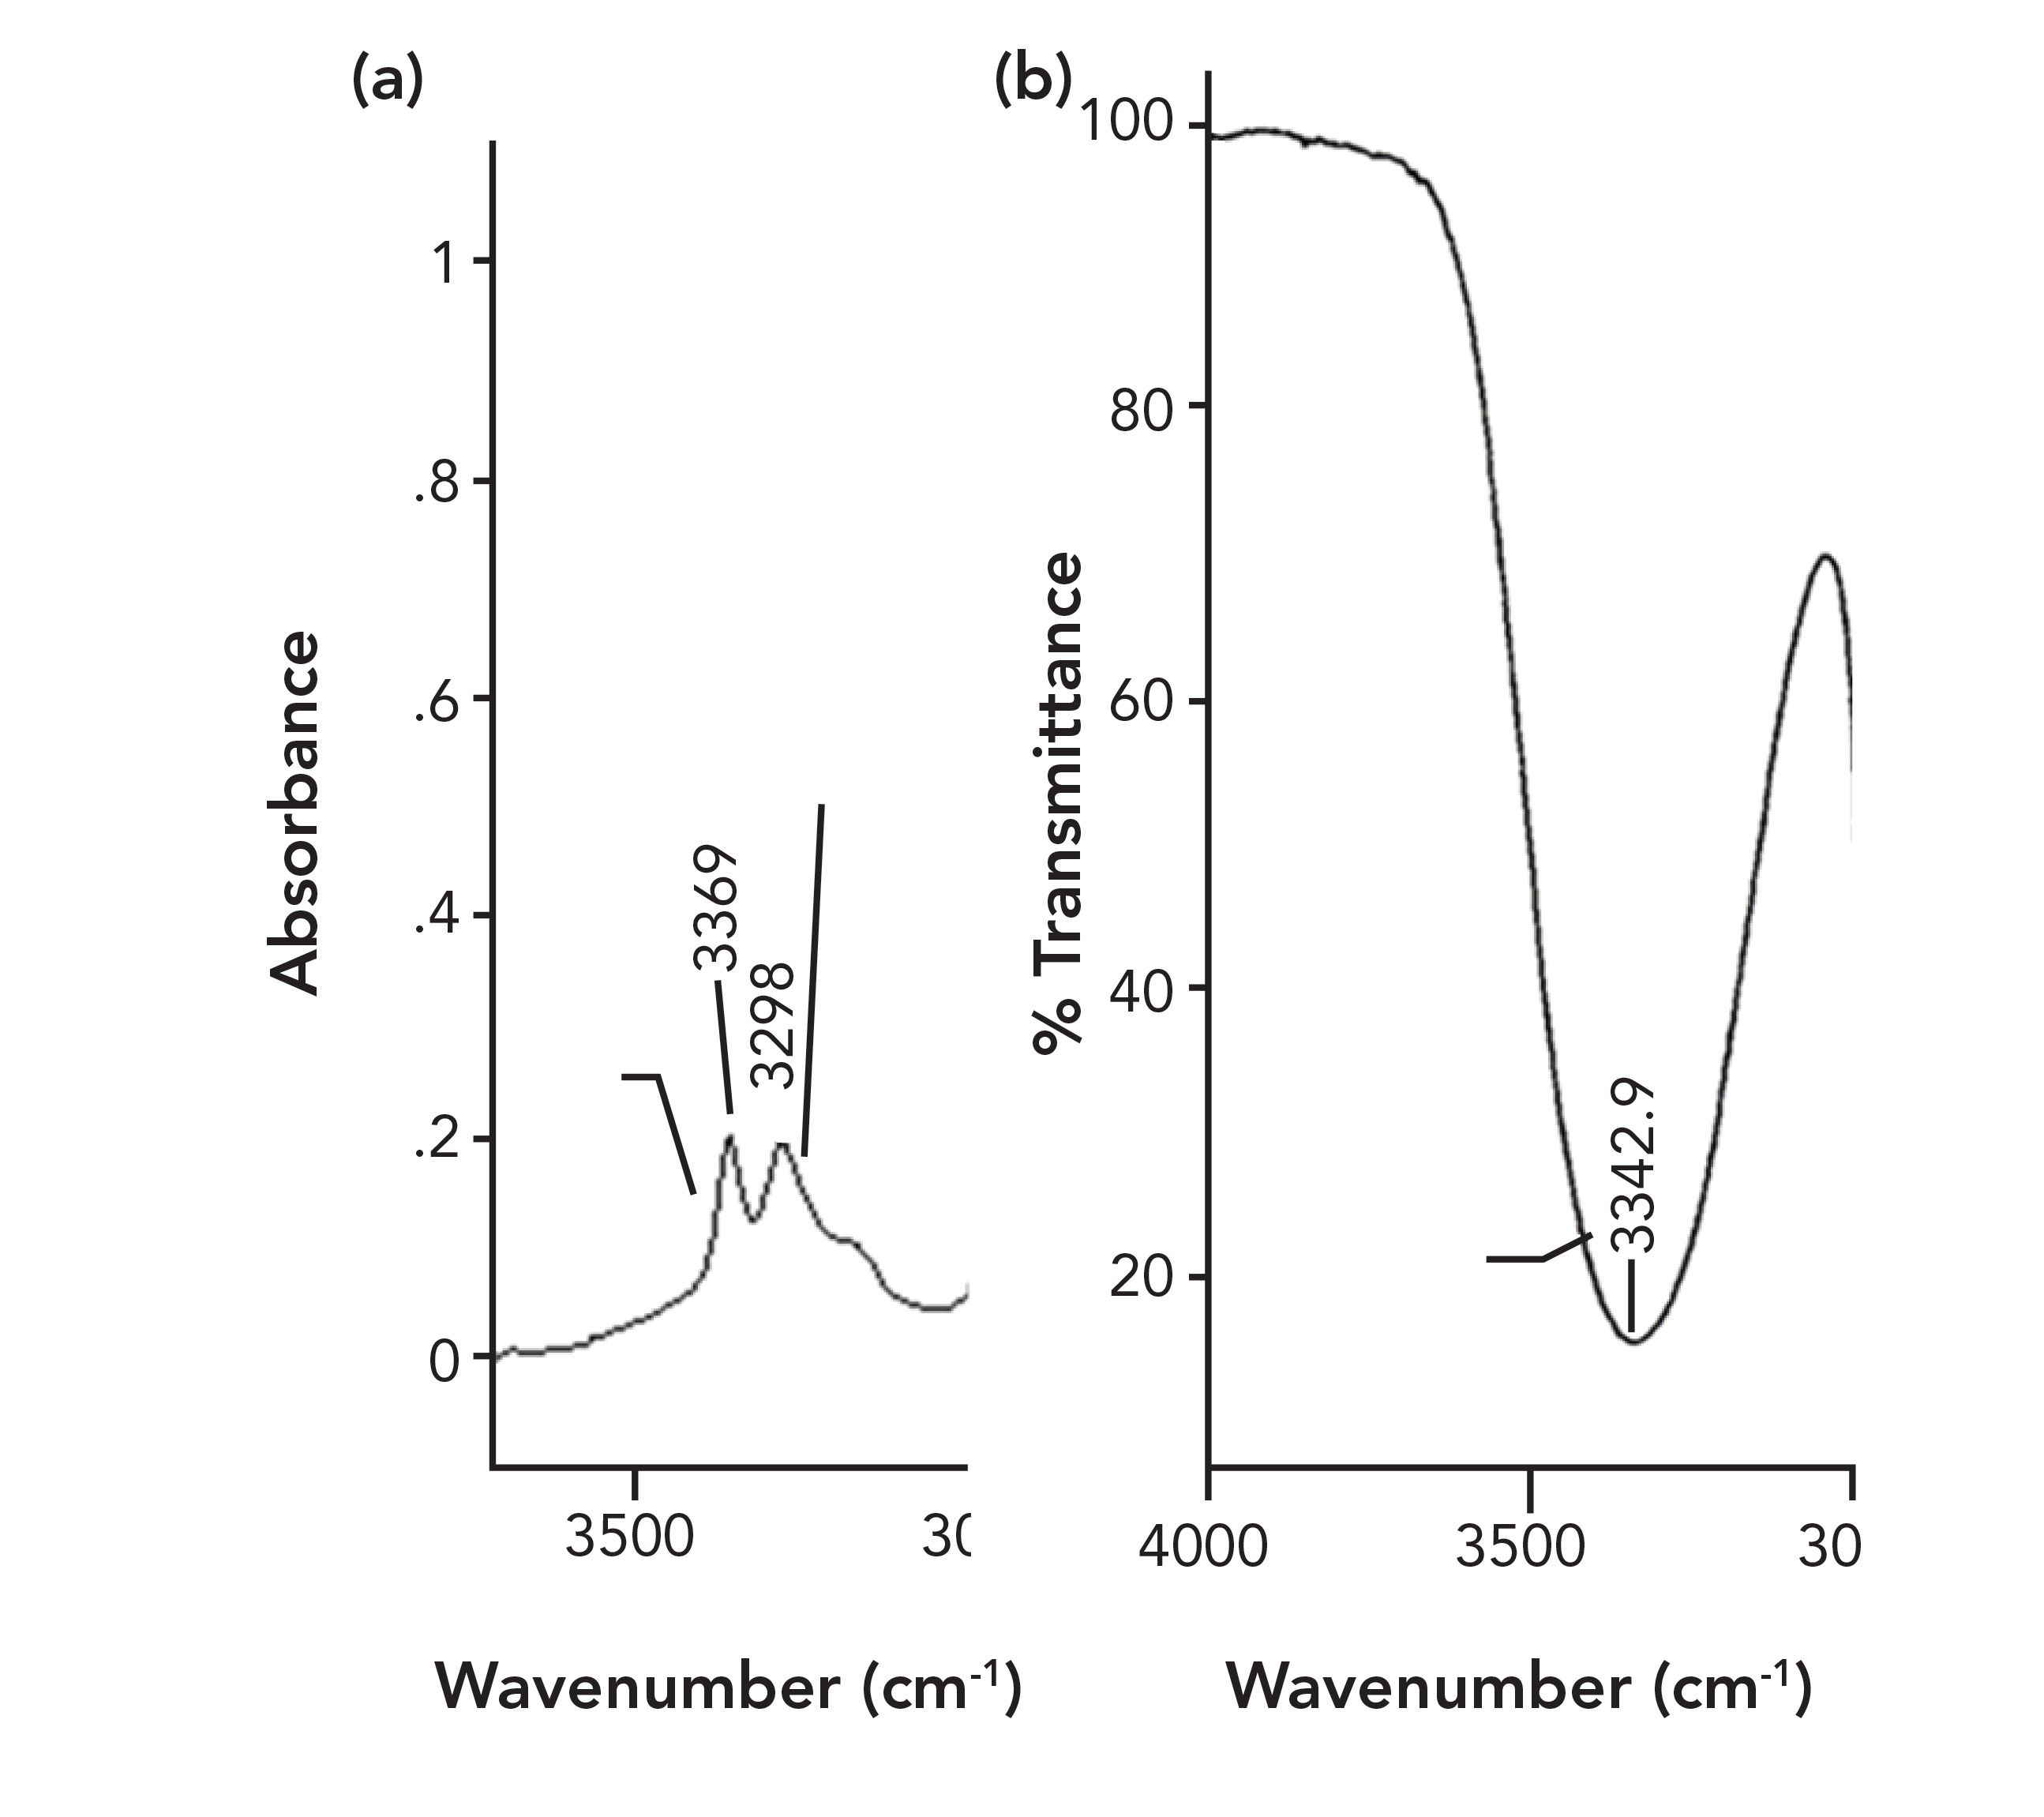
The spectrum on the left in Figure 7 shows the N-H stretching peaks of a primary amine and on the right is the O-H stretching peak of an alcohol. Note these peaks all appear around 3300. The FWHM of the N-H stretching peaks is about 70 cm-1, whereas the FWHM of the O-H stretch is about 500 cm-1. Even though these two functional groups have peaks in similar places, the difference in their peak widths can be used to distinguish them from the other.
The difference in peak width seen here exists because the polarity of an N-H bond is lower than that of an O-H bond; as a result, N-H hydrogen bonds are weaker than those of O-H bonds, meaning that amines have weaker intermolecular interactions than alcohols.
Conclusions
The pieces of information available to us in an infrared spectrum include peak positions, heights, and widths. All these pieces of information can be used to distinguish functional groups. We covered peak positions in the last column. Here, we saw that Beer’s law determines peak size, and that the absorptivity depends upon the change in dipole moment with respect to bond length during a vibration. We also saw that peak widths are determined by the strengths of intermolecular interactions. We now know why integrating peak position, height, and width information to interpret spectra is important.
References
(1) B.C. Smith, Spectroscopy 30(1), 16–23 (2015).
(2) B.C. Smith, Spectroscopy 35(11), 23–27 (2020).
(3) B.C. Smith, Quantitative Spectroscopy: Theory and Practice (Academic Press, Boston, Massachusetts, 2002).
(4) L. Pauling, The Nature of the Chemical Bond (Cornell University Press, Ithaca, New York, 1938).
(5) B.C. Smith, Fundamentals of Fourier Transform Infrared Spectroscopy (CRC Press, Boca Raton, Florida, 3rd Ed., 2011).
(6) J.M. Hollas, Modern Spectroscopy (John Wiley and Sons, New York, New York, 3rd Ed., 1996).
Brian C. Smith

Brian C. Smith, PhD, is the founder and CEO of Big Sur Scientific, a maker of portable mid-infrared cannabis analyzers. He has over 30 years experience as an industrial infrared spectroscopist, has published numerous peer-reviewed papers, and has written three books on spectroscopy. As a trainer, he has helped thousands of people around the world improve their infrared analyses. In addition to writing for Spectroscopy, Dr. Smith writes a regular column for its sister publication Cannabis Science and Technology and sits on its editorial board. He earned his PhD in physical chemistry from Dartmouth College. He can be reached at: SpectroscopyEdit@ MMHGroup.com.

AI Shakes Up Spectroscopy as New Tools Reveal the Secret Life of Molecules
April 14th 2025A leading-edge review led by researchers at Oak Ridge National Laboratory and MIT explores how artificial intelligence is revolutionizing the study of molecular vibrations and phonon dynamics. From infrared and Raman spectroscopy to neutron and X-ray scattering, AI is transforming how scientists interpret vibrational spectra and predict material behaviors.
Real-Time Battery Health Tracking Using Fiber-Optic Sensors
April 9th 2025A new study by researchers from Palo Alto Research Center (PARC, a Xerox Company) and LG Chem Power presents a novel method for real-time battery monitoring using embedded fiber-optic sensors. This approach enhances state-of-charge (SOC) and state-of-health (SOH) estimations, potentially improving the efficiency and lifespan of lithium-ion batteries in electric vehicles (xEVs).
New Study Provides Insights into Chiral Smectic Phases
March 31st 2025Researchers from the Institute of Nuclear Physics Polish Academy of Sciences have unveiled new insights into the molecular arrangement of the 7HH6 compound’s smectic phases using X-ray diffraction (XRD) and infrared (IR) spectroscopy.