The Infrared Spectra of Polymers IV: Rubbers
In our ongoing survey of the infrared (IR) spectra of polymers, we now turn our attention to rubbers. Many of these materials have C=C bonds, giving us the opportunity to review how to use IR spectroscopy to distinguish between the six types of alkenes. We also examine the spectra of rubbery materials in detail, such as synthetic rubber, natural rubber, and trans-butadiene rubber.
The term elastomer is generally used to refer to polymers that will stretch and then snap back into position (1). For our purposes here, the term rubber refers to a family of elastomeric materials that contain C=C bonds in the polymer backbone. Natural rubber was, and still is, obtained by removing the bark from rubber trees, collecting the sap, and processing it (2). Ancient Mesoamericans used natural rubber to make the balls that were used in the Mesoamerican ballgame (3), which had elements of soccer, basketball, and racquetball in it.
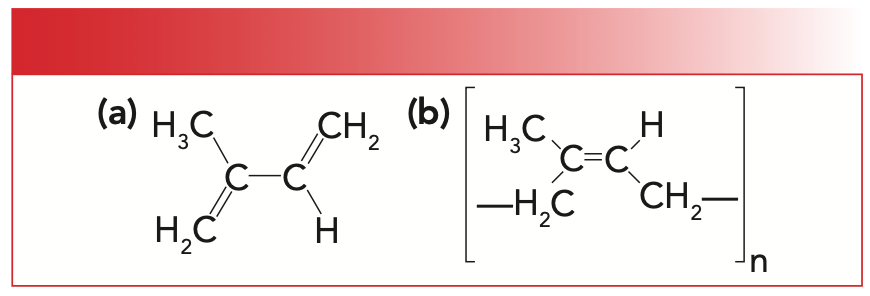
Natural rubber is a polymer of the molecule isoprene whose structure is seen to the left in Figure 1. The structure of natural rubber or polyisoprene is seen to the right in Figure 1.
FIGURE 1: (a) The molecular structure of isoprene. (b) The molecular structure of natural rubber, or polyisoprene.
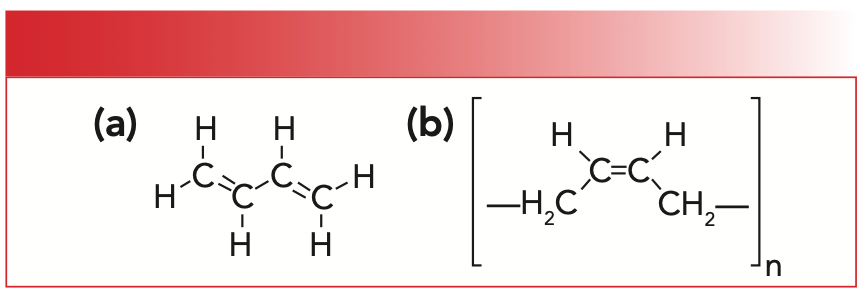
Because the price of natural rubber at times has been high because of the scarcity of its raw material, chemists devised a way to make many different synthetic rubbers. For our purposes, synthetic rubber will mean poly-cis-1,4-butadiene, which is made from a butadiene monomer. The structures of this monomer and its corresponding polymer are shown in Figure 2.
FIGURE 2: (a) The molecular structure of 1,3,-butadiene. (b) The molecular structure of synthetic rubber or poly-cis-1,4-butadiene.
The unique property of rubber that makes it useful is that it is “springy,” meaning that it returns to its original shape after being compressed or stretched. This “springy” characteristic is illustrated by pulling on a rubber band, letting it go, and watching it spring back to shape. Much research in the 20th century went into trying to explain why rubbers spring back to their original shape. Long story short, as my professor of polymer physics explained, rubber is an “entropy spring” (4). Recall from thermodynamics that the tendency of most natural processes in the universe is to move toward higher entropy. Rubbery polymers are amorphous at room temperature, thus maximizing their entropy. When the polymer chains are stretched, they align with each other, decreasing the entropy. The desire of the material to resume a state of maximum entropy is what causes it to snap back to its original dimensions.
The Infrared Spectra of Alkenes
As I have mentioned in previous columns in this series, the infrared (IR) spectra of polymers are not unique; the spectrum of a functional group generally looks the same whether it is contained in a polymer or in a small molecule. Thus, our study of polymer spectra is an excellent opportunity to review functional group spectra from previous columns.
The polymers we examine here are restricted to those rubbers that have C=C bonds in their backbones, which means that these rubbers are alkenes, whose structures and spectra have been discussed previously (5).
The number and position of the substituents around the C=C bond of an alkene lead to six different substitution patterns, which are illustrated in Figure 3. The “R-” group in the illustration is a non-hydrogen substituent, typically carbon.
FIGURE 3: Six substitution patterns for alkenes. The “R-” group is a non-hydrogen substituent, typically carbon.
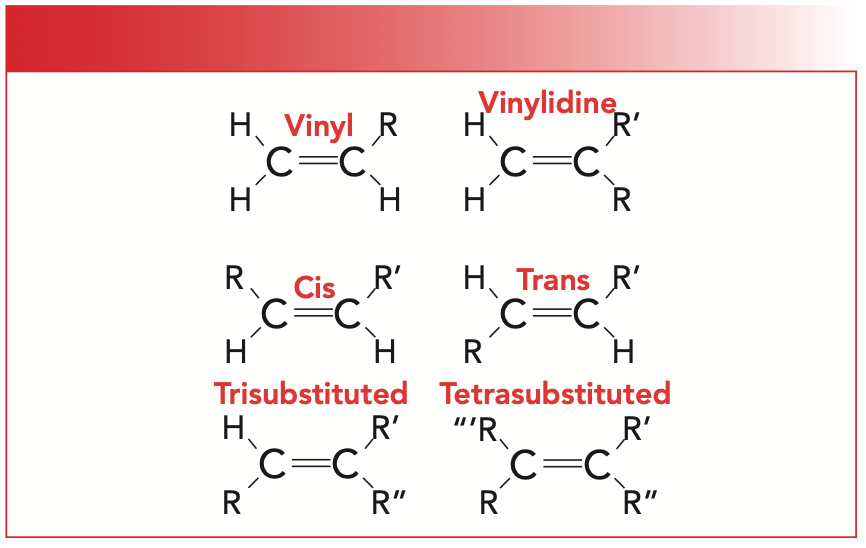
For our purposes, we will focus on cis-, trans-, and tri-substituted molecules. Note that for cis- and trans-isomers, there are two hydrogens and two R-groups attached to the C=C. However, for cis-molecules, the R-groups are on the same side of the double bond, whereas for trans-molecules, they are diagonally across from each other. The way I remember this is that the prefix trans is derived from the Latin for across, which is also the root of the word transportation, which means to carry something across from one place to another.
Alkenes are unsaturated because the C=C bond can react with hydrogen, resulting in more of them being added to the molecule. Recall that for unsaturated molecules, their C-H stretches typically fall between 3100 and 3000 cm-1 (5), which is true for alkenes as well.
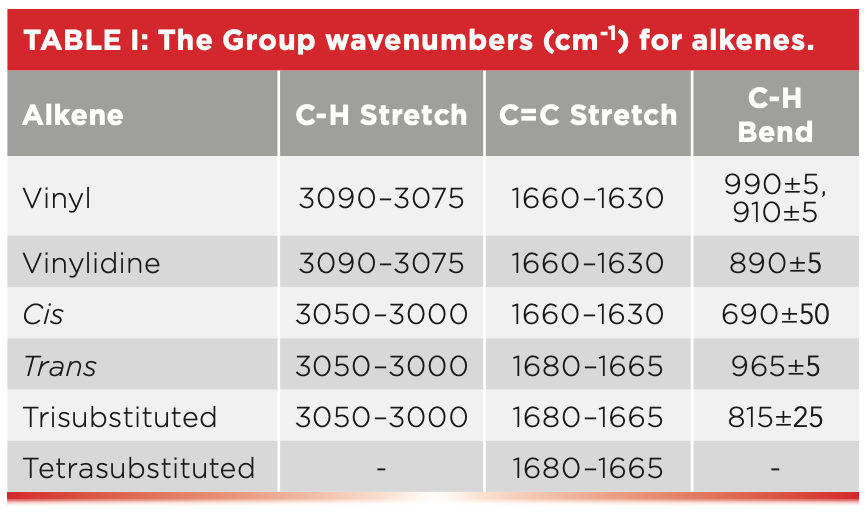
Another important group wavenumber for alkenes is the C=C stretch. This C=C stretch typically falls from 1680 to 1630 cm-1 and is somewhat sensitive to the substitution pattern (5). As seen in Table I, cis-C=C stretches fall from 1660 to 1630 cm-1, whereas for trans- and tri-substituted alkenes these peaks appear in the 1680–1665 cm-1 range.
However, the best way to determine alkene substitution patterns is the number and position of the C-H wagging peaks, denoted as “C-H Bend” in Table I. Recall that the term wag is shorthand for an out-of-plane bending vibration (6), so named because it looks like the wagging tail of a dog. Note that for cis-molecules, the C-H wagging peak falls at 690±50, for trans-molecules at 965±5, and for tri-substituted alkenes at 815±25. The C-H wagging peak for trans-alkenes is particularly notable for its intensity, sharpness, and the narrow range it falls in.
The Infrared (IR) Spectra of Rubbers
The IR spectrum of synthetic rubber is seen in Figure 4. Note that this structure contains cis-functional groups, which means that like substituents are on the same side; that is, the two CH2 substituents are on one side of the double bond while the two hydrogens are on the other side.
FIGURE 4: The infrared spectrum of synthetic rubber, or poly-cis-1,4-butadiene which contains cis-alkene functional groups.
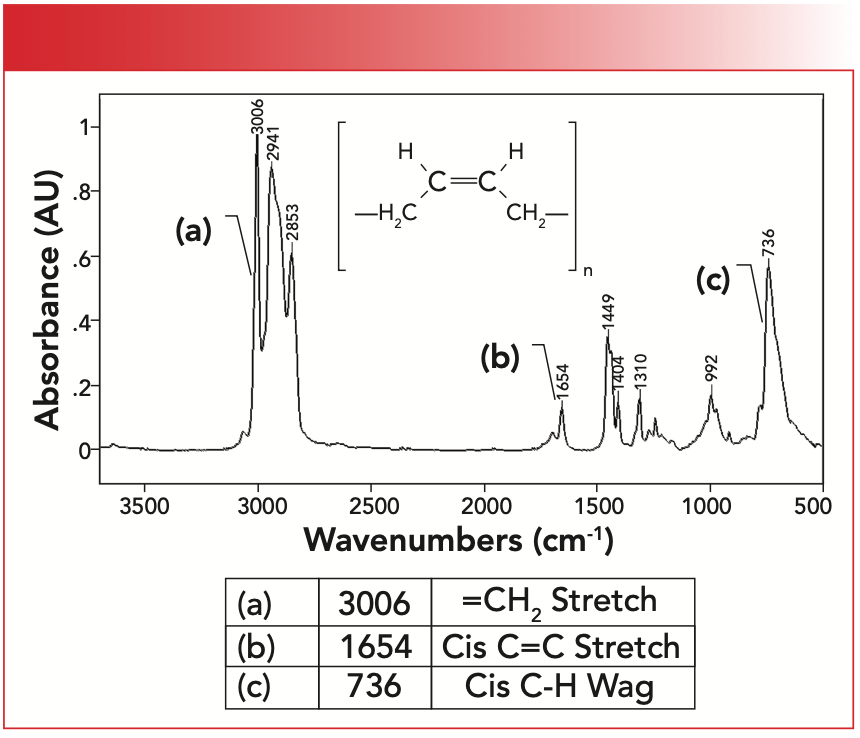
The unsaturated C-H stretching peak for this material labeled A falls at 3006 cm-1, above 3000 cm-1 as expected for an unsaturated functional group. The C=C stretching peak labeled B is at 1654 cm-1, and is in the range consistent with cis-molecules. The C-H wagging peak is at 736 cm-1. The position of this peak is a little troubling because we have also seen that CH2 rocking peaks fall at 720±10 (6). However, methylene rocking peaks tend to be smaller and narrower than cis-alkene C-H wags, hence these peaks should not be confused.
The IR spectrum of a synthetic co-polymer, trans-butadiene acrylonitrile rubber, is seen in Figure 5. This polymer is made from butadiene and acrylonitrile monomers. As seen from its name, this material contains mostly trans- double bonds. Note this rubber contains methylene groups but no methyls; therefore it has only two C-H stretching peaks between 3000 and 2850 cm-1 as we have previously discussed (6).
FIGURE 5: The IR spectrum of trans-butadiene acrylonitrile rubber.
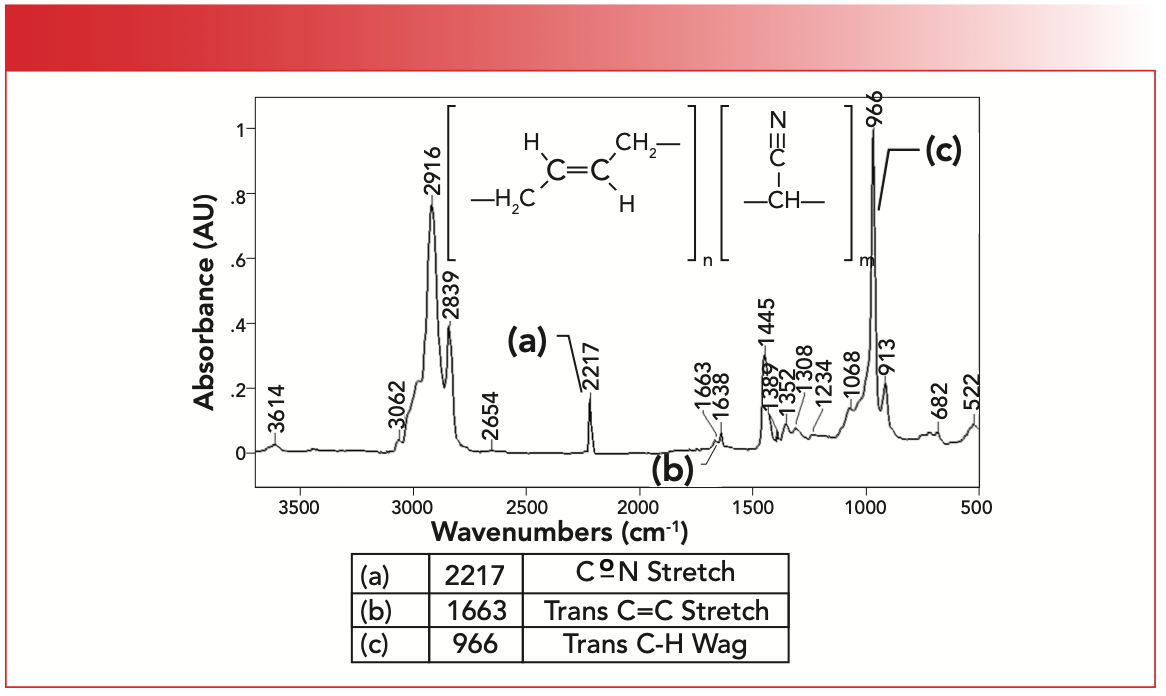
The unsaturated C-H stretch for the C=C bonds is seen at 3062 cm-1, whereas the alkene double bond stretch is labeled B and appears at 1663 cm-1. What stands out in this spectrum is the intense, sharp trans-C-H wagging peak labeled C at 966 cm-1. Note that this is the biggest peak in the spectrum. The acrylonitrile portion of the polymer gives rise to a CoN stretching peak labeled A at 2217 cm-1. We studied nitriles and their spectra in a previous column (7). Trans-butadiene rubber contains methylene groups only, so only two C-H stretching peaks between 3000 and 2850 cm-1 are present, as expected (6).
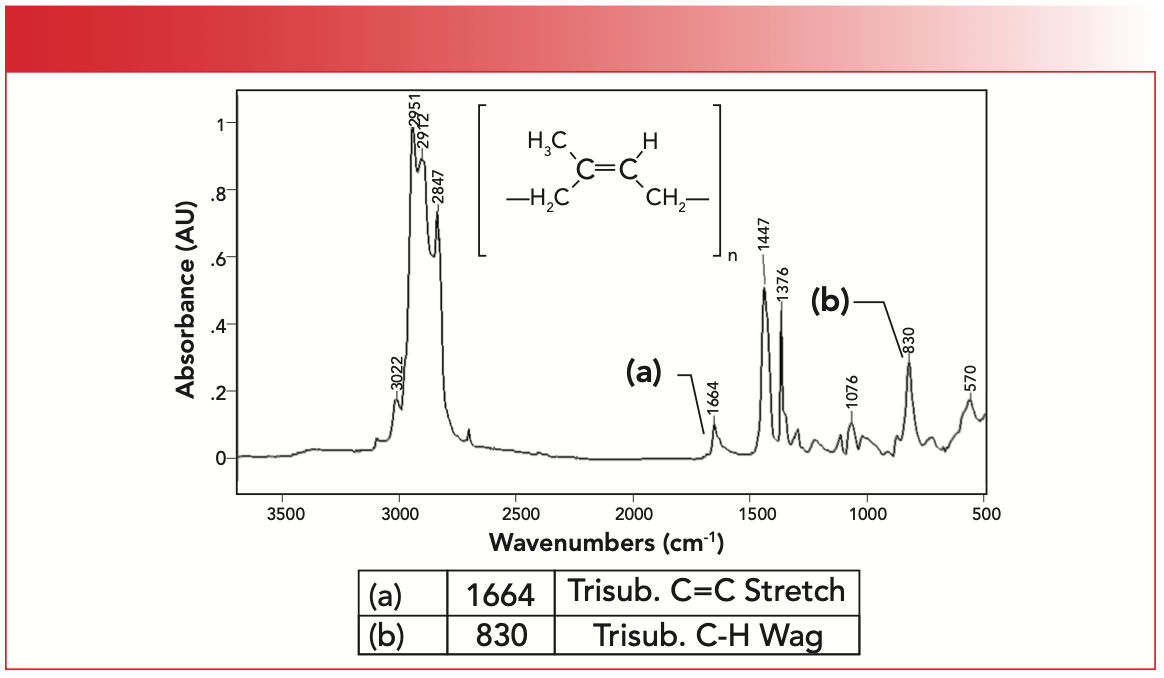
Lastly, the IR spectrum of natural rubber is seen in Figure 6. Note that natural rubber contains a tri-substituted C=C bond with two CH2 substituents and one CH3 substituent. It contains both methyl and methylene groups, hence the three peaks between 2840 and 3000 cm-1 as expected (6). The unsaturated C-H stretch of natural rubber is at 3022 cm-1, the C=C stretch labeled A is at 1664 cm-1, and the C-H wag labeled B is seen at 830 cm-1, all of which are consistent with presence of a tri-substituted C=C bond.
FIGURE 6: The IR spectrum of polyisoprene or natural rubber.
Conclusions
Rubbers are useful materials because they spring back to shape after being compressed or stretched because they are entropy springs. Many rubbery polymers contain C=C bonds in their backbones, which means they are alkenes. Thus, rubbers exhibit the unsaturated C-H stretching, C=C stretching, and C-H wagging peaks typical of alkenes. We reviewed the spectra of cis-, trans-, and tri-substituted alkenes, and then examined the spectra of natural and synthetic rubbers.
References
(1) Elastomer - Wikipedia
(2) Natural rubber - Wikipedia
(3) Mesoamerican ballgame - Wikipedia
(4) F. Bovey and F. Winslow, Macromolecules: An Introduction to Polymer Science (Academic Press, New York, NY, 1979).
(5) B.C. Smith, Spectroscopy 31(11), 28–34 (2016).
(6) B.C. Smith, Spectroscopy 30(7), 26–31, 48 (2015).
(7) B.C. Smith, Spectroscopy 34(7), 18–21, 44 (2019).
Brian C. Smith, PhD, is the founder and CEO of Big Sur Scientific, a maker of portable mid-infrared cannabis analyzers. He has over 30 years experience as an industrial infrared spectroscopist, has published numerous peer-reviewed papers, and has written three books on spectroscopy. As a trainer, he has helped thousands of people around the world improve their infrared analyses. In addition to writing for Spectroscopy, Dr. Smith writes a regular column for its sister publication Cannabis Science and Technology and sits on its editorial board. He earned his PhD in physical chemistry from Dartmouth College. He can be reached at: SpectroscopyEdit@MMHGroup.com ●


AI Shakes Up Spectroscopy as New Tools Reveal the Secret Life of Molecules
April 14th 2025A leading-edge review led by researchers at Oak Ridge National Laboratory and MIT explores how artificial intelligence is revolutionizing the study of molecular vibrations and phonon dynamics. From infrared and Raman spectroscopy to neutron and X-ray scattering, AI is transforming how scientists interpret vibrational spectra and predict material behaviors.
Real-Time Battery Health Tracking Using Fiber-Optic Sensors
April 9th 2025A new study by researchers from Palo Alto Research Center (PARC, a Xerox Company) and LG Chem Power presents a novel method for real-time battery monitoring using embedded fiber-optic sensors. This approach enhances state-of-charge (SOC) and state-of-health (SOH) estimations, potentially improving the efficiency and lifespan of lithium-ion batteries in electric vehicles (xEVs).
New Study Provides Insights into Chiral Smectic Phases
March 31st 2025Researchers from the Institute of Nuclear Physics Polish Academy of Sciences have unveiled new insights into the molecular arrangement of the 7HH6 compound’s smectic phases using X-ray diffraction (XRD) and infrared (IR) spectroscopy.