TOF-MS: A Viable Solution for Crude Oil Extract Analysis
Special Issues
Crude oil is a generic term for the unrefined flammable liquid that is mined from the ground. It is an extremely varied and very complex medium that can contain many thousands of organic compounds, whose contents and concentrations vary enormously from one sample to another. This article discusses how recent advances in time-of-flight-mass spectrometry coupled with comprehensive two-dimensional gas chromatography is helping the petrochemical industry to characterize crude oils more fully and so provide solutions to common problems experienced during drilling, extraction, and refining.
Crude oils are some of the most complex mixtures routinely analyzed by gas chromatography (GC). They contain significant amounts of organic compounds, ranging from light hydrocarbons to complex biomolecules derived from the remains of ancient marine organisms and the bacteria that feed on them.
The compounds of most interest to the petroleum industry are relatively volatile (with boiling points generally below 400 °C) and nonpolar, leading to separations predominantly being performed by GC with a nonpolar column. Unsurprisingly, the resulting chromatograms are complex and usually characterized by a matrix of unresolved material that appears as a significant background "hump" beneath the partially resolved nonpolar compound peaks (Figure 1). A suitable background subtraction and library search algorithm can identify the nonpolar compound peaks, but for those lost in the matrix, there is little hope for a positive identification.
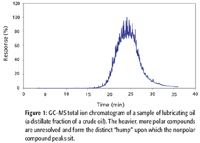
Figure 1
The inability of simple GC separations to cope with this level of complexity has led to a system of classification based upon the presence of discrete biomarker compounds. However, such an incomplete characterization limits understanding of the oil sample's geochemistry and provides no insight into issues that might arise during extraction, transport, or refining. This problem is becoming more acute as the more easily extracted "light" crude oils become depleted and oil companies move to reservoirs containing "heavier" crudes, bituminous shales, and tar sands, which contain higher proportions of involatile, polar compounds that can complicate the analysis (1).
Two-Dimensional Gas Chromatography
Two-dimensional chromatography (GC×GC) is an important technique for the petrochemical industry due to its ability to separate very complex mixtures (2,3). The usual configuration is a conventional nonpolar column connected to a short length of a polar column with a GC×GC modulator in between. The modulator collects time slices of effluent from the first column (typically 5-s wide) and reinjects them onto the short polar column. The result is a separation that combines both polar and nonpolar elements. In the case of crude oil analysis, GC×GC can start to tease apart the complexity present in the matrix and identify the major components present there. With two levels of separation, GC×GC has the resolution required to isolate many of the compounds of interest in complex samples.
Figure 2 shows a relief representation of a GC×GC separation of the same lubricating oil sample shown in Figure 1. The silhouette outline on the top left is a representation of how the sample would look on a conventional, single-dimensional GC separation. The colored portion in the figure represents the GC×GC separation with the nonpolar aspect being from bottom to top and the polar aspect being from right to left. This separation allows us to visualize compound peaks invisible in a conventional GC separation.
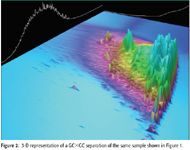
Figure 2
Mass Spectrometry Detectors for GC×GC
GC×GC peak widths in this example analysis are typically 50–200 ms wide, which presents a problem for traditional GC–mass spectrometry (MS) systems. The maximum scan rate of a quadrupole mass detector will be in the order of 10,000 amu/s. A system set to scan from 50 to 550 m/z would imply a maximum of 20 scans/s. When an interscan delay is taken into account, it is rarely possible to acquire more than 10 scans/s, implying a very poor definition of even the 200-ms wide peaks. To monitor such narrow peaks effectively, a much faster mass detector is required, and time-of-flight (TOF)-MS is currently the only viable technology.
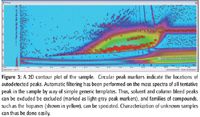
Figure 3
TOF-MS
TOF-mass spectrometers differ from traditional scanning MS instruments in that TOF technology does not use a mass filter for the analysis. TOF technology does not scan and does not use a filter and therefore, no ions are discarded. Instead, the user defines the start- and end-mass range limits and there is no penalty for extending the mass range to 1000 amu or higher. As such, all the ions that are formed are also acquired, which is ideal when analyzing complex samples with tiny concentrations of compounds of interest. However, traditional TOF instrumentation has not been able to produce classic spectra that are identified easily in published spectral libraries. This shortcoming has forced analysts to create custom libraries, which can be a time-consuming and expensive process (4,5).
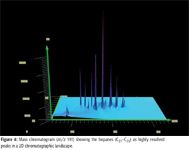
Figure 4
A significant advantage of coupling TOF-MS with GC×GC is the extended mass range, as TOF enables the improved identification of compounds in complex samples when compared with traditional MS. Recent advances in TOF instrumentation have offered further benefits when combined with GC×GC, as newly developed instruments offer the ability to produce classical spectra, which can be identified in commercial or reference libraries.
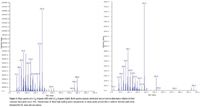
Figure 5
The study described in this article examines the use of a benchtop TOF mass spectrometer that offers full spectral information at levels previously only obtained with single ion monitoring (SIM) on quadrupole mass spectrometers.
Experimental
A crude oil sample was analyzed using GC×GC coupled with a TOF mass spectrometer to determine the level of classical spectral information generated by the instrumentation.
GC Conditions: A model 7890A gas chromatograph (Agilent Technologies, Santa Clara, California) was configured with a thermal loop modulator (Zoex ZX1, Zoex Corp., Houston, Texas). This system was used for the comprehensive GC×GC separation. Conditions are listed in Table I.
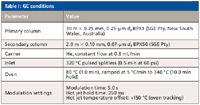
Table I: GC conditions
MS Conditions: A TOF mass spectrometer (BenchTOF-dx, ALMSCO, Llantrisant, UK) was used for data acquisition. Table II shows the conditions used.

Table II: MS conditions
Results and Discussion
Spectra obtained in this experiment included accurate representations of high boiling point hopanes (pentacyclic triterpanes) up to C35, which are highly diagnostic marker compounds in petrochemical applications.
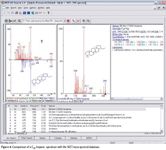
Figure 6
Confident identification was achieved using a commercial (NIST) mass spectral library. The high sampling frequency of the TOF enables the spectral quality and sensitivity to be realized in this GC×GC application and, equally, any high-speed GC analysis. This capability would benefit laboratories without the time, budget, or ability to develop custom spectral libraries or laboratories possessing proprietary spectral libraries previously developed on quadrupole systems.
Conclusion
This new generation of TOF-MS instrumentation is capable of producing classical spectra that are comparable to commercial spectral libraries. This fundamental capability opens the door to harnessing the performance of a TOF for advanced chromatographic techniques such fast GC and comprehensive GC×GC techniques, while retaining the use of spectral libraries proprietary to petrochemical laboratories
The power of such capability is illustrated here in the separation and identification of hopanes in a single analysis. Hopanes are used as markers for characterization of oil and the ability to analyze them in a single run with minimal sample preparation is an obvious advantage. Similarly, screening of other analytes in crude oil, particularly those not normally separated by conventional GC–MS, becomes possible. Such constituents are thought to contribute to a process of "solidification" of oil in transmission pipes, while others might have relevance to the environmental impact of oil, a factor that will gain further attention with the introduction of programs such as European REACH (Registration Evaluation Authorisation and Restriction of Chemicals), with its focus on the identification of chemicals in order to assess their toxicological impact.
Nick Bukowski is with ALMSCO International, Llantrisant, UK.
References
(1) V. Simanzhenkov and R. Idem, Crude Oil Chemistry (CRC Press, Boca Raton, Florida, 2003).
(2) C. von Mühlen, C.A. Zini, E.B. Caramão, and P.J. Marriott, J. Chromatogr., A 1105 (1–2), 39–50 (2006).
(3) C.M. Reddya, R.K. Nelsona, S.P. Sylvaa, L. Xub, E.A. Peacocka, B. Raghuramanc, and O.C. Mullinsc, J. Chromatogr., A 1148(1), 100–107 (2007).
(4) H. Budzikiewicz and R.D. Grigsby, Mass Spec. Rev. 25, 146–157 (2006).
(5) R.M. Teeter, Mass Spec. Rev. 4, 123–143 (1995).
High-Speed Laser MS for Precise, Prep-Free Environmental Particle Tracking
April 21st 2025Scientists at Oak Ridge National Laboratory have demonstrated that a fast, laser-based mass spectrometry method—LA-ICP-TOF-MS—can accurately detect and identify airborne environmental particles, including toxic metal particles like ruthenium, without the need for complex sample preparation. The work offers a breakthrough in rapid, high-resolution analysis of environmental pollutants.
The Fundamental Role of Advanced Hyphenated Techniques in Lithium-Ion Battery Research
December 4th 2024Spectroscopy spoke with Uwe Karst, a full professor at the University of Münster in the Institute of Inorganic and Analytical Chemistry, to discuss his research on hyphenated analytical techniques in battery research.
Mass Spectrometry for Forensic Analysis: An Interview with Glen Jackson
November 27th 2024As part of “The Future of Forensic Analysis” content series, Spectroscopy sat down with Glen P. Jackson of West Virginia University to talk about the historical development of mass spectrometry in forensic analysis.
Detecting Cancer Biomarkers in Canines: An Interview with Landulfo Silveira Jr.
November 5th 2024Spectroscopy sat down with Landulfo Silveira Jr. of Universidade Anhembi Morumbi-UAM and Center for Innovation, Technology and Education-CITÉ (São Paulo, Brazil) to talk about his team’s latest research using Raman spectroscopy to detect biomarkers of cancer in canine sera.