Trends in X-Ray Techniques
Several leading scientists discuss their work to advance XRF and XRD techniques.
In advance of the Denver X-Ray Conference, we asked leading scientists who will be speaking at the conference about current trends and advances in X-ray fluorescence and X-ray diffraction. Here, these investigators discuss their work to advance these techniques and the sample preparation for such analyses, in areas such as photonics for telecommunications, steel structures, metals in pharmaceuticals, and imaging.
Simplifying Metal Analyses in Pharmaceutical Labs with XRF
Sharla Wood
Metal catalysts may be found at multiple points along the synthetic route of a drug product, including starting materials, intermediates, excipients, and in the synthesis of the active pharmaceutical ingredient (API). Although the procedures in the International Conference on Harmonisation (ICH)-Q3D Elemental Impurities and United States Pharmacopeia (USP) chapters <232> Elemental Impurities - Limits and <233> Elemental Impurities (1–3) govern elemental impurities in drug products, analyses of metal concentrations in starting materials, intermediates, in-process materials, and during process optimization of API synthesis are also beneficial. Since the primary goal of providing life-saving drugs to patients more quickly is often the driving force behind many decisions in the pharmaceutical development process, alternatives to traditional metal analysis methods that can provide more timely results with less required skill are desirable.
Traditionally, metal analysis in pharmaceuticals is conducted using flame- and plasma-based techniques, including flame and graphite furnace atomic absorption spectroscopy, inductively coupled plasma–mass spectrometry (ICP-MS), and inductively coupled plasma–optical emission spectroscopy (ICP-OES). These techniques offer sensitivity, selectivity, and precision; however, they often require lengthy sample preparation and trained analysts, regardless of the stage of development. Time is an important consideration during the pharmaceutical development process, and often a quick estimate of metal concentration is all that is necessary when deciding the next step in the optimization of a synthetic process. A wish list for an alternative technique includes fast and simple method development, the potential for open access and sample flexibility (including phase and sample size), while still maintaining the required sensitivity for screening of metal content and for trending data. X-ray fluorescence (XRF) provides an alternative approach to determine elemental content. Although portable XRF may not afford the same level of sensitivity as ICP-MS or ICP-OES, it is relatively inexpensive, is easy for an untrained individual to use, requires little-to-no sample preparation, and is nondestructive.
A portable XRF system was provided for use in process chemistry laboratories to enable rapid screening of metal catalyst content to isolate samples of high metal concentrations and determine trends in metal concentrations during metal catalyst removal processes (4). Through the use of XRF, synthetic chemists were able to generate data in their laboratory within minutes to aid in the design of future experiments. Sample quantity is often limited during the development process; the nondestructive behavior of XRF afforded the recovery of samples after analysis for use in subsequent experiments. Moreover, the volume of samples submitted for ICP analysis was greatly reduced, saving both instrument and personnel time, reducing consumable and reagent costs, and decreasing the potential for instrument contamination by samples with high metal concentrations. Since the deployment of this XRF system, more than 900 samples were analyzed by this XRF screening method, saving approximately two months of development time.
Portable XRF spectroscopy has proven useful in the screening of effective metal catalyst scavengers during the pharmaceutical development process and for metal analysis at in-process control steps during the synthesis of a pharmaceutical product, results from which have been used in critical decisions. This technique has also shown to be invaluable in foreign matter investigations, metal analysis of excipients and vendor-sourced materials, as well as materials that are not easily solubilized, and in the analysis of in-process control samples during the synthetic process of APIs.
References
- International Conference on Harmonization, ICH Q3D, Guideline for Elemental Impurities, (ICH, Geneva, Switzerland, 2014, http://www.ich.org/fileadmin/Public_Web_Site/ICH_Products/Guidelines/Quality/Q3D/Q3D_Step_4.pdf).
- General Chapter <232> “Elemental Impurities - Limits” in United States Pharmacopeia 39-National Formulary 34 (United States Pharmacopeial Convention, Rockville, Maryland, http://www.usp.org/sites/default/files/usp_pdf/EN/USPNF/key-issues/c232-usp-39.pdf).
- General Chapter <233> Elemental Impurities - Procedures” in second supplement to United States Pharmacopeia 38-National Formulary 33 (United States Pharmacopeial Convention, Rockville, Maryland, http://www.usp.org/sites/default/files/usp_pdf/EN/USPNF/key-issues/c233.pdf).
- N. Lewen et al., Org. Process Res. Dev. 19(12), 2039–2044 (2015).
Sharla Wood is a Research Investigator II at Bristol-Myers Squibb in Global Product Development and Supply - Chemical and Synthetic Development in New Brunswick, New Jersey.
Analysis of Beverages by Total Reflection X-ray Fluorescence
Martina Schmeling
Total reflection X-ray fluorescence spectrometry (TXRF) is a well established and versatile multielement trace analytical method (1). Its ease of use and low detection limits make it an ideal tool for routine analysis of samples ranging from liquids and solids to biological tissues. The project presented in this short article was inspired by undergraduate research experience and showcases TXRF as an undergraduate teaching and research tool. When exposing undergraduate students to research one has to take into account the lack of laboratory experience of the student, in addition the project should spark and retain the interest of the student, and also maintain a high research standard. With this in mind, the subject of study were common beverages. Beverages such as juices are recommended as a means of delivering essential nutrients and trace elements to children and adults alike. Many of them are fortified and most are processed to remove unwanted residues and pulp or are reconstituted from concentrate. We purchased three common fruit juices-apple juice, cranberry juice, orange juice-and one bottle of lemonade for this study and compared their metal content to water obtained from a drinking fountain at the university. All fruit juices were pulp free and none of the beverages were from concentrate. Table I lists the name, origin, and daily values of the beverages stated on the label.

Two sample preparation methods were compared with each other to examine the difference in trace metal content between the liquid part of the juice and the solid–liquid mixture that includes plant fibers. For the liquid-only element content, a 5-mL aliquot of the purchased beverages was centrifuged at 9000 rpm for 10 min and 1 mL of the supernatant was analyzed. For the solid–liquid mixture, a 1-mL aliquot of the beverages was diluted with the same amount of ultrapure water after shaking the bottle vigorously and then analyzed. Drinking fountain water was analyzed directly. For all samples gallium was used as the internal standard.
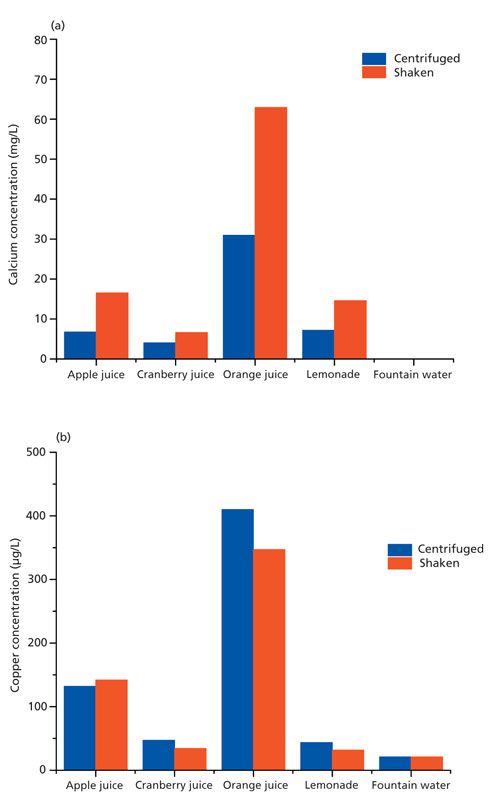
It was found that each purchased beverage contained a suite of common metals, with potassium and calcium having the highest concentrations and manganese, iron, copper, zinc, rubidium, and strontium present as traces. The concentrations of all detected metals varied not only between beverages, but also between the methods of preparation substantially. Drinking fountain water contained much lower concentrations of potassium and calcium, but comparable concentrations for the other metals were detected. This is not surprising because the plant tissue is enriched with potassium and calcium.
Figure 1 shows the concentrations of calcium (Figure 1a) and copper (Figure 1b) for all samples. Please note that the calcium concentrations are expressed in units of milligrams per liter and the copper concentrations in micrograms per liter. The fountain water concentration of calcium was a factor of 1000 smaller than for the other beverages. When calculated for the 340-mL bottle content and compared to daily intake values, the freshly pressed apple and orange juices delivered more calcium and copper. In fact, the copper amount delivered by one 340-mL bottle of orange juice is about a quarter of the daily recommended value for children and 10% for adults. (2). The juice that contributed substantially to daily intake values was 100% orange juice and only when the solids or pulp were included in the drink. All other beverages had only marginal daily amounts of the metals detectable by TXRF.
Figure 1: (a) Calcium and (b) copper concentrations in different beverages. The blue bars show the concentrations of the supernatant after centrifugation and the red bars the concentrations of the shaken beverage.
References
- R. Klockenkämper and A. von Bohlen, Total Reflection X-ray Fluorescence Analysis and Related Methods, 2nd Edition (Wiley and Sons, Hoboken, New Jersey, 2015).
- Institute of Medicine, Dietary Reference Intakes for Vitamin A, Vitamin K, Arsenic, Boron, Chromium, Copper, Iodine, Iron, Manganese, Molybdenum, Nickel, Silicon, Vanadium, and Zinc (The National Academies Press, Washington, DC, 2001) https://doi.org/10.17226/10026.
Martina Schmeling is an Associate Professor and Graduate Program Director with the Department of Chemistry and Biochemistry at Loyola University Chicago in Chicago, Illinois.
In Situ XRD Studies of Microstructural Changes in Steel
M. Witte and I. Janssen
With in situ X-ray diffraction (XRD), microstructure changes in steel can be investigated at elevated temperatures. The method collects large amounts of data in a short time from a single sample, which reduces experimental effort and possible deviations caused by sample preparation. Such experiments can be used to study and optimize annealing treatments of advanced steel grades.
A Bruker D8 Discover X-ray diffractometer with a Vantec2000 area detector was equipped with a DHS1100 commercial heating stage from Anton Paar. With the large angular coverage of the area detector, fast measurements are possible with a temporal resolution of down to 3 s. The heating stage is enclosed by a graphite dome that can be filled with different annealing atmospheres. After preliminary testing of different atmospheres (air, vacuum of 10-2 mbar, helium, and nitrogen) a mixture of helium with 3% hydrogen was chosen because it offers high thermal conductivity and the hydrogen content prevents surface oxidation but does not damage the oxide heating plate. The maximum temperature of the heating stage is 1100 °C and the maximal heating rate is 400 °C/min.
In the following section, two examples of in situ XRD measurements of steel are presented.
Recrystallization and Phase Transformation
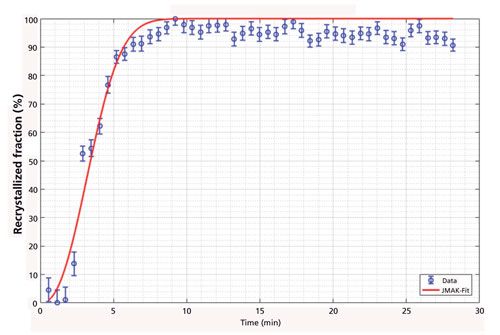
Recrystallization and recovery are softening processes that are driven by the reduction of dislocation density of deformed materials. A reduction in dislocation density can be directly determined with in situ XRD by the reduction of X-ray peak widths (1). In the current case, a cold-rolled dual-phase steel was heated to temperatures between 700 °C and 800 °C with a heating rate of 200 °C/min. To derive a recrystallized fraction, the change of the {110}- and {200}-peak widths was normalized. The trend of this recrystallized fraction with annealing time could be fitted with the Johnson-Mehl-Avrami-Kolmogorov (JMAK) function with a high degree of confidence (Figure 1). Hence, the thermodynamic parameters that describe the recrystallization kinetic of this steel could be derived from only three samples within a few hours.
Figure 1: Recrystallized fraction of a dual-phase steel annealed at 700 °C. The fractions are derived from the width of the {110} Bragg reflex measured with in situ XRD.
If the same dual-phase steel was heated to higher temperatures, phase transformation sets in. Unfortunately, a decarburization of the sample surface occurred to a larger extent than the X-ray penetration depth. Because the reduction of carbon content increases the transformation temperature considerably, no reliable results of transformation kinetics could be gained. Most likely the decarburization was caused by residual moisture in the annealing atmosphere. In the future, additional gas cleaning filters will be installed to prevent this decarburization effect.
Transformation Textures and Grain Size
To investigate changes of the crystallographic texture caused by the transformation from the low-temperature α-Fe phase (bcc) into the high-temperature γ-Fe phase (fcc), a sample of a bainitic steel was repeatedly heated up to 1000 °C and cooled down to room temperature. As the heating stage is small and flexible enough to allow rotations and tilts of the sample stage, it was possible to measure the complete texture of the sample. For this, three incomplete pole figures were measured at 1000 °C and at room temperature within 20 min. In accordance with other studies (2), a weakening of texture by subsequent phase transformations was observed. Thus, with oscillations around the phase transformation temperature a virtually texture-free microstructure can be obtained. As crystallographic texture is the main cause of plastic anisotropy, such annealing treatments could be used for increasing the isotropy of steels.
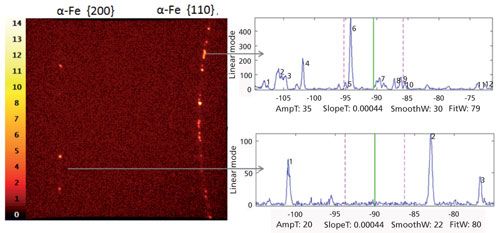
Furthermore, the grain size of the same bainitic steel could also be measured in the high-temperature phase. The aim of this investigation was to determine if the prior γ-Fe grain size can be measured by in situ XRD. For coarse-grained materials the Bragg reflexes recorded by an area detector are not smooth cones anymore, but are spotty. Every spot along the Bragg cone originates from a single grain, and from the number of these spots within a certain angular range, the size of the grains can be calculated (Figure 2) (3). For this calculation the interaction volume of the X-ray beam with the sample has to be known or, as in our case, a calibration with a known standard can be applied. Because the penetration depth of the X-ray was approximately 10 µm and thus smaller than the mean grain size, a two-dimensional (2D) approach was derived. In addition to the mean grain size, the grain size distribution can also be determined because the intensity of each spot along the Bragg cone corresponds to the respective size of a certain grain. From a reconstruction of the prior γ-Fe grain structure from electron backscatter diffraction data (EBSD) data, the prior γ-Fe grain size of the investigated bainitic steel was determined to be larger than 500 µm, while after the reverse transformation into the high temperature γ-phase a grain size of only ~25 µm was determined by in situ XRD. From this result, it follows that the prior γ-Fe grain size is not restored after a reverse transformation into γ-Fe because the change of crystal structure that occurs is diffusive and not displacive (like γ-Fe → martensite or bainite).
Figure 2: Example of a 2D X-ray detector image of coarse-grained steel. On the right-hand side the result of the automatic spot detection for the {110} and {200} reflexes is given.
In conclusion, in situ XRD measurements are a versatile tool to observe and understand microstructural changes in steel and optimize annealing treatments.
References
- G. Williamson and W. Hall, Acta Metall. 1, 22–31 (1953).
- G. Brückner and G. Gottstein, ISIJ Int. 41, 468–477 (2001).
- B.B He, Two-Dimensional X-ray Diffraction (John Wiley & Sons, Hoboken, New Jersey, 2009).
M. Witte is with Salzgitter Mannesmann Forschung GmbH in Salzgitter, Germany. I. Janssen is with the Department of Crystallography at Georg-August University Göttingen in Göttingen, Germany.
High-Resolution X-ray Emission Spectroscopy Without a Synchrotron
Kathryn McIntosh, George J. Havrilla, Mark Croce, Rachel Huber, David Podlesak, Michael Rabin, Fernando Vila, Matthew Carpenter, and Robin Cantor
Transition-edge sensor (TES) microcalorimeter detectors are capable of high-resolution X-ray emission spectroscopy (XES) that rivals X-ray absorption near edge structure (XANES) spectroscopic probes found only within the confines of synchrotrons. Commercial microcalorimeters offer a spectral resolution of around 5–7 eV, which is comparable to that provided by wavelength dispersive X-ray fluorescence (WDXRF) instruments yet provides the full spectra of the material of interest, not merely a single element, thereby surpassing WDXRF capabilities.
The bonding of carbon is predicated on the sp2–sp3 orbitals. The peak position of the carbon Kα peak, as well as the peak shape, provides information about the bonding of the carbon atoms. In a paper we are presenting at the 2017 Denver X-ray Conference (1), we report the measurement of the carbon Kα peak around 282 eV for several materials of interest, including amorphous carbon, nanodiamond, and graphite, since all three have different carbon forms and sp2–sp3 bonding ratios. In addition, a soot specimen from a contained detonation of explosive material was measured to determine the carbon species formed from the detonation. A high-resolution microcalorimeter mounted on a scanning electron microscope was used to measure the carbon peak for these different materials. The powder samples were pressed into indium foil which was then placed onto a stub. The microcalorimeter detector has a resolution of around 5 eV and 16 individual pixels each collecting a full spectrum. The individual spectra from each pixel were summed to obtain increased counting statistics for more accurate peak position measurements.
In examining the collected spectra for the materials mentioned, it was noted that the peaks are all downshifted from the expected 282 eV position. Secondly, each of the peaks has a distinct position and differences in shape indicating differences in the sp2–sp3 ratio for each material. A Gaussian fit to the peaks provides the peak positions. Using the amorphous carbon as the carbon reference point, the nanodiamond shows the largest shift toward higher energy relative to amorphous carbon. The graphite shows a small negative shift toward lower energy relative to amorphous carbon. The soot sample appears to be the most similar to the amorphous carbon, but does exhibit a small positive shift indicating potential nanodiamond character.
Preliminary theoretical simulations of the XES of these materials using the transition potential approximation in density functional theory indicate similar trends in both the shape and position of the peaks, and support the experimental measurements. We used simple molecular models for the systems of interest that are representative of the different local environments found around the excited centers. The theoretical results predict a clear relation between the shift relative to the graphite peak and the local out-of-plane distortion around the absorbing center, a quantity that is closely related to its sp2–sp3 character.
X-ray photoelectron spectroscopy provides the sp2–sp3 hybridizations through bombardment of the sample surface with X-rays that cause the subsequent release of electrons with the characteristic bonding energy of carbon: sp2 at 284 eV and sp3 at 285 eV. Graphite samples show purely sp2 character, and nanodiamond shows a mixture of sp2–sp3 (26–39%). The soot sample is a majority 67% sp2 with 16% sp3 character. Raman spectroscopy provides further information as to the sp2 allotropes and surface functionalization.
The microcalorimeter detector offers new X-ray measurement capabilities not found with conventional synchrotrons in that full spectra are measured compared with limited XANES scan ranges from synchrotron measurements. In addition, these measurements can be done within your laboratory.
References
- K. McIntosh, G. Havrilla, M. Croce, R. Huber, D. Podlesak, M. Rabin, F. Vila, M. Carpenter, and R. Cantor, “Study of Carbon Bonding with XES Using a TES Microcalorimeter Detector,” to be presented at the 2017 Denver X-Ray Conference, Big Sky, Montana.
Kathryn McIntosh, George J. Havrilla, Mark Croce, Rachel Huber, David Podlesak, and Michael Rabin are with Los Alamos National Laboratory in Los Alamos, New Mexico. Fernando Vila is with the University of Washington, Seattle, Washington. Matthew Carpenter and Robin Cantor are with Star Cryoelectronics in Santa Fe, New Mexico.
Making X-ray Fluorescence Movies in the Laboratory Using CCD and CMOS Cameras
Kenji Sakurai and Wenyang Zhao
For many years, viewing elements as they move in chemical systems has been a dream for scientists. Because chemical reactions are coupled with the transportation and redistribution of elements, such a capability would be an excellent tool for elucidating many unknown phenomena in pure sciences as well as in medical and industrial applications. X-ray fluorescence (XRF) is a powerful nondestructive technique for determination of chemical composition. So far, however, capturing moving images with XRF, particularly in the laboratory, has been extremely challenging. Although we have reported the creation of some XRF movies using highly brilliant synchrotron sources (1,2), it is extremely important to enable similar experiments in ordinary laboratories, schools, industries, and hospitals. This year, at the Denver X-ray Conference, we will report our latest progress toward this goal (3,4).
Roughly speaking, in XRF, one can choose either a wavelength-dispersive X-ray spectrometer, which uses an analyzing crystal, or an energy-dispersive spectrometer equipped with a semiconductor detector such as a silicon drift detector. In XRF still-imaging, one typically uses an energy-dispersive spectrometer to obtain XRF spectra efficiently, while scanning the sample position with a small X-ray beam (created by using a focusing device such as mono- or polycapillary optics). The measurement time to obtain each individual image is quite long, and large pixel numbers are essential to provide enough information. In this situation, movie XRF imaging looks difficult. How can one collect many such XRF images as a function of time?
The key is to change the XRF imaging strategy. We propose a new approach, which we call projection-type XRF imaging, in contrast to scanning-type imaging. In this approach, instead of making xy scans with a micro X-ray beam, we use a rather large beam to illuminate the whole sample area. All XRF data are collected by an energy-dispersive two-dimensional (2D) detector. To project an XRF image onto the 2D detector plane, we have two options: parallel optics based on a collimator plate, or a simple pinhole camera. One of the remaining problems was how to make a 2D X-ray detector that has a large number of tiny pixels with sufficient energy resolution in the X-ray wavelength region.
There has been great progress in X-ray detectors. In the present research, we are using cooled charge-coupled-device (CCD) and complementary-metal-oxide-semiconductor (CMOS) cameras, which are designed for visible light applications. It is possible that other advanced 2D X-ray detectors could be used for XRF imaging, but we believe that the use of commercially available cooled CCD and CMOS cameras would be extremely convenient for many users, because they are not very expensive and are easy to obtain. One needs to remove the optical lenses as well as any covers, and affix an X-ray window there instead. The inside of the camera should be evacuated or at least replaced by dried gas because of the necessity of cooling.
Then the most likely next question is how to obtain X-ray energy information, which is absolutely necessary for XRF. In XRF instruments, as in other semiconductor detectors, X-ray photons create a large number of charges in a CCD or CMOS camera. Because the amount of charge corresponds to the energy of the X-rays, one can obtain information on impinged X-ray energy. This means that the intensity corresponds to the X-ray energy, if the image is read sufficiently quickly to avoid counting overlapped events. Such quick reading is often called single-photon counting. However, there are still some technical challenges. X-ray photons might not arrive at the center of the single pixel; for example, they may hit the corner of the pixel, in which case the created charges are eventually split into several pixels. Such events become more apparent when the pixel is small, particularly in the case of CCD and CMOS cameras made for visible light cameras. To deal with this problem of charge-sharing events, we are proposing a clever and fast filtering scheme.
At the 2017 Denver X-ray Conference, we will present our latest scientific XRF movies. For this work, we used a 1.5-kW X-ray tube. The typical energy resolution of our system is around 150 eV@MnKα (depending on the cooling temperature). The spatial resolution is adjustable; we typically set it at 20–50 µm, depending on the XRF intensity of the sample. The time resolution for the movie is still not fast like a synchrotron experiment; it is on the order of a minute.
In our presentation, we will provide successful examples that visualize the real-time diffusion of elements such as calcium and iron in some chemical systems, from the beginning of the reaction to the end. One can understand how diffusion proceeds and how it depends on the element and matrix in real time. We hope this work will help to clarify the mechanism of chemical functions and reactions on a specific time scale. This novel XRF movie technique has the potential to open a new era of chemical science.
References
- K.Sakurai and H. Eba, Anal. Chem. 75, 355–359 (2003). http://dx.doi.org/10.1021/ac025793h.
- K.Sakurai and M.Mizusawa, AIP Conference Proceedings 705 (Synchrotron Radiation Instrumentation 2003, San Francisco), pp. 889–892 (2004). http://doi.org/10.1063/1.1757938.
- W. Zhao and K. Sakurai, Sci. Rep. 7, 45472 (2017). http://dx.doi.org/10.1038/srep45472.
- W. Zhao and K. Sakurai, Rev. Sci. Instrum. 88, 063703 (2017). http://dx.doi.org/10.1063/1.4985149.
Kenji Sakurai, PhD, is the managing researcher at the Research Center for Advanced Measurement and Characterization at the National Institute for Materials Science in Ibaraki, Japan. Wenyang Zhao is a graduate student at the University of Tsukuba in Tsukuba, Japan.
High-Resolution X-ray Asymmetrical Reciprocal Space Mapping: A Technique for Structural Characterization of Semiconductor Superlattices
Andrian Kuchuk
Semiconductor superlattices (SLs), due to their unique electronic and transport properties, are nowadays commonly used for innovative optoelectronic devices and for high-frequency power electronics. Basically, SLs consist of a periodic arrangement of two semiconductor materials with different energy band gaps, with the SL period (TSL) much larger than the semiconductor lattice constants. Because of the quantum size effects, the miniband structure of the SL depends not only on the semiconductors band gap, but also on the geometrical design of the SL. The properties of such quantum structures can be tuned in a wide range by changing the SL period, thicknesses, and strain state of quantum well (QW)–barrier layers. High-resolution X-ray diffraction (HR-XRD) is the main tool used to determine the superstructure parameters mentioned above. Commonly (1–4), the reciprocal space map (RSM) of an asymmetrical reflection and the simulation of the measured ω/2θ X-ray diffraction profile (XDP) of a symmetrical reflection are used to evaluate the strain state and thicknesses of QW–barrier layers, respectively.
A novel approach has been proposed for structural characterization of semiconductor SLs using X-ray reciprocal space mapping of an asymmetrical reflection (5). The X-ray diffraction pattern of a periodic structure is characterized by a series of satellite peaks lying parallel to the modulation direction. In the reciprocal space, the distance between the satellite peaks corresponds to the reciprocal modulation period which is inversely proportional to TSL. The positions of SL peaks depend both on the strain state and on the thickness ratio of QW–barrier layers. The new method relies on the determination of the satellite peak positions in reciprocal space and directly provides the superstructure parameters of the coherently grown SL. The considered method can be applied to any (strained or relaxed) SLs heteroepitaxially grown on the substrate.
Using the example of a GaN–AlN SL (5), it is demonstrated that the superstructure parameters obtained from the proposed method agree very well with the parameters revealed by the currently preferred approach that is based on the measurements and simulation of ω/2θ XDP of symmetrical reflections. Furthermore, by performing a simulation of the reciprocal lattice point broadening for an asymmetrical reflection (Figure 1), we additionally determined the density of threading dislocations (TDs) in GaN–AlN SL. The comparison of the density of TDs in the substrate and SL allows for analyzing the relaxation mechanism and developing a technique to improve the structural quality of the SL.
Figure 1: (a) Calculated and (b) measured 1
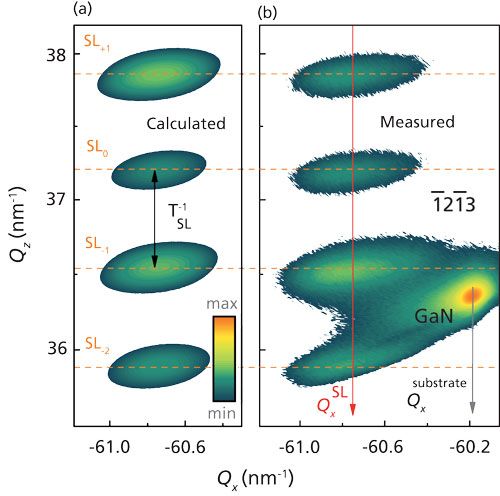
213 RSMs for 20 periods GaN–AlN SLs with the following superstructure parameters: TSL = 9.46 nm; tGaN/tAlN = 4.38/5.08 nm; εx (GaN–AlN)= -3.05 x 10⁻³/1.58 x 10-3; NTD = 3.32 x 108 cm-2. The intensity is plotted in logarithmic scale.
A simple method based on laboratory X-ray diffraction for nondestructive diagnostic purposes would be useful for design and precise growth of semiconductor superlattice-based devices. This new approach is not limited solely for III-nitrides; it can also be applied to a variety of materials. This method would be useful to the broad community of crystal growth, design, and epitaxy as a reliable growth calibration technique that does not waste valuable growth time or resources.
References
- F. Schubert et al., J. Appl. Phys. 115, 83511 (2014).
- A.V Kuchuk et al., Nanotechnology25, 245602 (2014).
- M. Beeler et al., Appl. Phys. Lett. 105, 131106 (2014).
- M. Tchernycheva et al., Phys. Rev. B73, 125347 (2006).
- H.V. Stanchu et al., CrystEngComm19, 2977 (2017).
Andrian Kuchuk, PhD, is the manager of the X-ray diffraction and Nanofabrication Laboratory at the Institute for Nanoscience and Engineering, at the University of Arkansas in Fayetteville, Arkansas.

AI Shakes Up Spectroscopy as New Tools Reveal the Secret Life of Molecules
April 14th 2025A leading-edge review led by researchers at Oak Ridge National Laboratory and MIT explores how artificial intelligence is revolutionizing the study of molecular vibrations and phonon dynamics. From infrared and Raman spectroscopy to neutron and X-ray scattering, AI is transforming how scientists interpret vibrational spectra and predict material behaviors.
Trends in Infrared Spectroscopic Imaging
September 13th 2013An interview with Rohit Bhargava, winner of the 2013 Craver Award. This interview is part of the 2013 podcast series presented in collaboration with the Federation of Analytical Chemistry and Spectroscopy Societies (FACSS), in connection with SciX 2013, the federation?s North American conference.
Advancing Corrosion Resistance in Additively Manufactured Titanium Alloys Through Heat Treatment
April 7th 2025Researchers have demonstrated that heat treatment significantly enhances the corrosion resistance of additively manufactured TC4 titanium alloy by transforming its microstructure, offering valuable insights for aerospace applications.