An IR Spectral Interpretation Potpourri: Carbohydrates and Alkynes
Spectroscopy
Two unrelated discussions are presented: carbohydrates and alkynes.
We finish our examination of the infrared (IR) spectroscopy of the C-O bond with a discussion of carbohydrates. These important biological molecules contain both alcohol and ether linkages, making their C-O stretching regions particularly rich and challenging to interpret. To round out this potpourri I’ve added alkynes, a type of unsaturated functional group for which there wasn’t room in earlier columns.
According to Webster’s Collegiate Dictionary (1), a potpourri is “a mixture, especially of unrelated objects, subjects etc.” One of the challenges of writing multiple column installments for a magazine is making the topics fit into the space allotted in each issue. More than once in the past there has been a topic that was too short to stand by itself as an installment, but too long to combine with any related topics. Hence the need for the occasional catch-all column like this one, where these orphaned topics can find a home. The reason that this installment is a potpourri is that the topics included here are unrelated to each other. There will be more potpourri columns in the future.
This is also the 14th installment of this workshop, and in the last two and a half years we have covered a lot of territory. The topics covered in potpourri installments will be new to you but are related to things we have discussed before. Therefore, you will learn something new from these columns while exercising some of what you have already learned, hopefully aiding in your learning process.
Carbohydrates
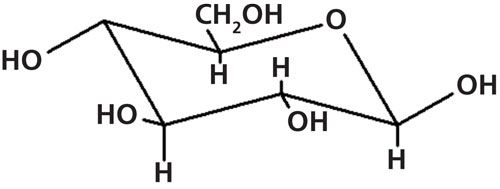
Carbohydrates are an important class of biological compounds including sugars and cellulose. The term was originally coined because their molecular formulas suggested they were “hydrates of carbon” (2), although we now know this is not true. Structurally speaking, carbohydrates contain saturated rings with ether linkages in them, and multiple alcohol groups as shown in Figure 1.
Figure 1: The chemical structure of glucose.
So far in these columns most of the compounds whose spectra have been examined have been synthetic compounds of industrial importance, but of course biochemicals are important too because they allow life on planet earth to exist! In many of the infrared (IR) spectral interpretation training courses I have taught, one of the most frequent questions has been, “Can IR tell the difference between synthetic and natural materials?” The short answer is no. Many of the most important classes of biochemicals, including proteins, fats, carbohydrates, and nucleic acids, are structurally similar to organic compounds and contain the same functional groups as synthetic chemicals. The spectrum of any functional group will be the same regardless of whether it was made in a living cell or a test tube. For example, the spectrum of a methyl group will be pretty much the same whether it is part of an alkane or a protein. Thus, IR spectroscopy is not a good “natural versus synthetic” discriminator. However, since biochemicals do contain organic functional groups, we can determine their structure by IR spectroscopy the same way we do for synthetic materials.
Mono- and Disaccharides
The chemical structure of an important and well known carbohydrate, glucose, is shown in Figure 1.
Glucose is the product of photosynthesis, and is the molecule many animals burn for energy. Note that it is a cyclic six-membered ring with the shape of a distorted hexagon. Glucose is an example of a monosaccharide, meaning it contains one cyclic sugar unit. Five of the vertices of this saturated ring represents a carbon atom, and the ring also contains an oxygen atom attached to two saturated carbons giving a saturated ether linkage. Additionally, there are also five -OH groups, four of which are secondary alcohols and one of which is a primary alcohol. We have studied the spectra of all these functional groups before (3–5). The plethora of hydroxyl groups means that carbohydrates engage extensively in hydrogen bonding and that there will be strong, broad O-H stretches. The seven separate saturated C-O bonds means there will be a lot of C-O stretching peaks between 1200 and 1000 cm-1 (going forward assume all peak positions are in cm-1 even if not noted). The IR spectrum of glucose is shown in Figure 2.
Figure 2: The IR spectrum of glucose, a monosaccharide.
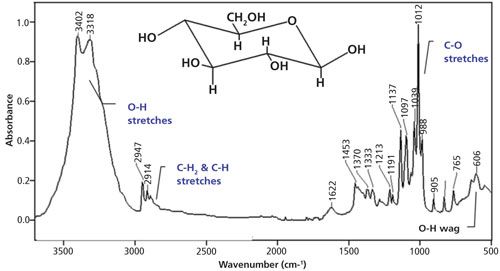
There is a broad, strong O-H stretching envelope in Figure 2 with two peaks at 3402 and 3318. This is the first time we have seen an O-H stretching peak like this. It means there are two chemically distinct alcohol groups in the molecule with different bond strengths, force constants, and hence peak positions. My guess is that one of the peaks is from the secondary alcohols present, and the other from the primary alcohol present. There is also an O-H wagging peak at 606.
There is a peak at 1622 from adsorbed water, although the peak is small and water’s contribution to the -OH stretching peak intensity would also be small. It is no surprise that glucose and many other carbohydrates absorb water from the atmosphere since they contain a lot of -OH groups, are highly polar, and hence are hygroscopic.
Four of the carbons in the glucose ring are structurally similar-each being attached to two other carbons, one oxygen, and one hydrogen, with the oxygens each being part of a secondary alcohol. We will call the situation where there is only one hydrogen attached to a carbon a lone hydrogen. The lone hydrogens in glucose are all saturated and hence will have C-H stretches below 3000 (2). However, these peaks will not be as intense as typical C-H stretches since there is only one bond contributing to the peak intensity instead of two or three as is the case for methylene and methyl groups. Saturated lone C-H groups tend to have their stretching peaks around 2900 (7). The oddball fifth carbon in the glucose ring has a primary alcohol group hanging off it that contains a CH2 group. It is these C-H and CH2 moieties that are responsible for the small C-H stretching peaks shown in Figure 2 around 2900.
Recall that saturated ethers have a C-O stretching peak from 1140 to 1070, secondary alcohols have one from 1150 to 1075, and in primary alcohols this peak appears between 1075 and 1000 (3–5), making for a potentially complex C-O stretching region. As can be seen in Figure 2 there are four peaks in this region. This C-O stretching peak region complexity is typical of carbohydrates, and makes it difficult to assign the C-O stretching peaks of these molecules exactly.
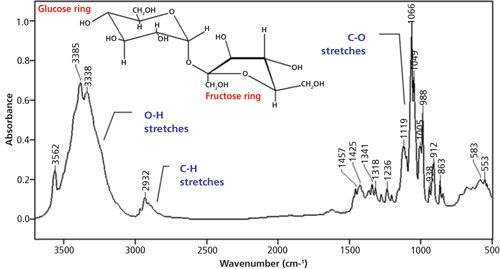
The IR spectrum of a disaccharide, sucrose, otherwise known as table sugar, is shown in Figure 3.
Sucrose is a disaccharide because it contains two sugar rings. It consists of a glucose ring attached via a saturated ether linkage to a five-membered fructose ring as noted in Figure 3. Fructose gets its name from the fact that it is a sugar found in fruit (2). Note in the spectrum that there are multiple O-H and C-O stretching peaks, even more so than in the spectrum of glucose. Many carbohydrates consist of multiple sugar rings connected by ether linkages. As these molecules get bigger there are many more types of O-H and C-O bonds, hence the increase in spectral complexity. Also note in the spectrum of sucrose that the C-H stretch and O-H wag peaks have turned into shapeless blobs thanks to spectral complexity and hydrogen bonding.
Figure 3: The IR spectrum of sucrose (table sugar), a disaccharide.
Polysaccharides
Polysaccharides are polymeric carbohydrates consisting of many sugar units strung together. Perhaps the most common polysaccharide is cellulose, whose IR spectrum is shown in Figure 4.
Figure 4: The IR spectrum of cellulose, a polysaccharide.
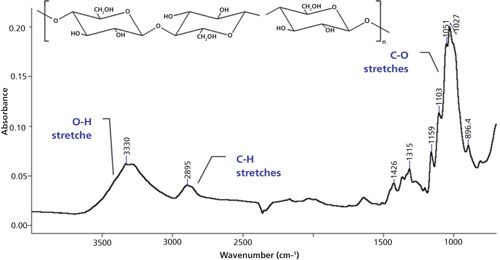
Cellulose is found in the cell walls of plants and is found in our every day lives as wood, paper, and cotton. In fact, the spectrum in Figure 4 is of a paper towel. The cellulose molecule is a series of glucose units stitched together by saturated ether linkages. There is so much hydrogen bonding in cellulose that the complex O-H stretching peak patterns we saw in glucose and fructose are gone, replaced by a broad blob. The C-H stretches are similarly blobby, and the C-O stretching region is best characterized as an envelope with any number of shoulder peaks on top of it.
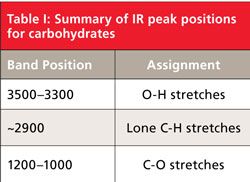
Notice then as we proceeded from mono- to di- to polysaccharides the spectra got more complex because of the many types of O-H and C-O bonds and eventually became so complex that the peaks overlapped enough to form blobs. Hydrogen bonding also helped increase spectral band broadening. The spectra of carbohydrates then are characterized by multiple O-H stretches and multiple C-O stretches. This information is summarized in Table I.
Alkynes
In past columns (10,11) we discussed unsaturated carbons and looked at the spectra of two families of unsaturated hydrocarbons, substituted benzene rings and alkenes. I left out one last family from the discussion, alkynes. Alkynes contain the C≡C structural unit, properly called a carbon-carbon triple bond. These bonds are unsaturated because they can be hydrogenated to form saturated compounds just like aromatic rings and alkenes (2). The two varieties of alkynes, monosubstituted and disubstituted, are shown in Figure 5. The “R-” symbols in Figure 5 represent nonhydrogen substituent atoms.
Figure 5: Left: the structure of a monosubstituted alkyne. Right: the structure of a disubstituted alkyne.

A monosubstituted alkyne has one hydrogen and one R-group attached, and a disubstituted alkyne has no hydrogens and two R-groups attached. The simplest alkyne with the chemical formula C2H2, or H-C≡C-H, is called acetylene. Sometimes alkynes are named as acetylene derivatives. We can distinguish the two types of alkynes from each other using IR spectroscopy. The IR spectrum of a monosubstituted alkyne, 3,3-dimethyl-1-butyne (or tert-butyl acetylene) is shown in Figure 6, and its relevant peak assignments are shown in Table II.
Figure 6: The IR spectrum of 3,3-dimethyl-1-butyne (or tert-butyl acetylene), a monosubstituted alkyne.
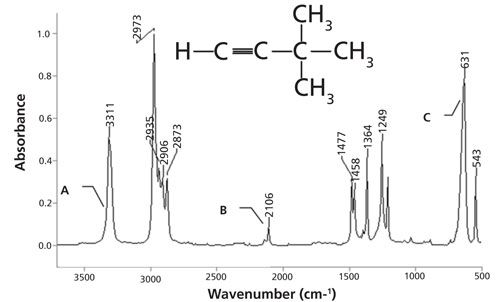

As we read the spectrum from left to right the first thing we encounter is an intense, relatively sharp peak labeled A at 3311. We have seen in the past (3,4) that O-H stretches fall in this same region. However, recall that these peaks are widened by hydrogen bonding. There is no hydrogen bonding in alkynes, hence the peak at 3311 is narrow and cannot be from an O-H bond. It is in fact the C-H stretch of the hydrogen attached directly to the C≡C group, and this peak generally falls from 3350 to 3250 for monosubstituted alkynes. This is far and away the highest wavenumber C-H stretch we have seen yet and may ever see. Its unique position and sharpness set it apart and make it a great monosubstituted alkyne group wavenumber. The H-C≡C group also has a C-H wag, shown as a big peak labeled C at 631 in Figure 6. This is also an excellent group wavenumber because of its intensity, sharpness, and low peak position. This peak can be found generally from 700 to 600 for monosubstituted alkynes. O-H wags also show up in this region (3,4), but again the sharpness of this peak means it is not from an OH group. The spectra of monosubstituted alkynes then have two sharp, intense peaks at high and low wavenumber, in a sense bookending the spectrum.
The C≡C linkage in monosubstituted alkynes has a stretching peak between 2140 and 2100, which is shown in Figure 6 labeled B at 2106. This is a very unusual peak position, which should make this peak a useful group wavenumber. However, like the C=C stretch of alkenes (11) this peak has variable intensity and hence limited utility because it may be intense, weak, or nonexistent depending on the molecule. Recall that one of the things that determines peak intensity is the change in dipole moment with respect to bond length (dµ/dx) for a vibration (8). For a monosubstituted alkyne with a polar substituent dµ/dx will be large and the C≡C stretching peak will be large. For a monosubstituted alkyne with a nonpolar substituent like tert-butyl acetylene, dµ/dx will be small and hence the peak intensity will be small as seen in Figure 6. For a symmetrically substituted alkyne such as acetylene (H-C≡C-H) dµ/dx for the triple bond stretch is zero and there is no IR peak due to C≡C stretching. The unreliable appearance of this peak makes it a poor group wavenumber. Again, the best peaks to identify a monosubstituted alkyne are the H-C≡C stretch and wag.
A disubstituted alkyne has two non-hydrogen substituents attached, such as dimethyl acetylene, CH3-C≡C-CH3. Since there are no hydrogens attached to the triple bond, disubstituted alkynes do not have a H-C≡C stretching or bending vibration. Disubstituted alkynes do have a C≡C stretching peak that falls between 2260 and 2190, and this peak can be used to distinguish disubstituted from monosubstituted alkynes. However, just like for monosubstituted alkynes, the C≡C stretch is also an unreliable group wavenumber for the same reasons. For a symmetrically substituted disubstituted alkyne like dimethyl acetylene there are no H-C≡C peaks, and since dµ/dx for the C≡C stretch is zero there is no triple bond stretching peak. Symmetrically substituted alkynes then are one of the rare organic functional groups that have no useful IR group wavenumbers, and their presence in a sample must be detected by means other than IR spectroscopy.
CLICK IMAGE TO ENLARGE
Conclusion
In this first IR spectral interpretation potpourri we have looked at the spectra of two dissimilar molecules, carbohydrates and alkynes. Carbohydrates contain many different types of O-H and C-O bonds, and hence have complex O-H stretching and C-O stretching regions from 3500 to 3300 and 1200 to 1000, respectively.
Alkynes contain C≡C bonds and come in mono- and disubstituted forms. Mono-substituted alkynes contain a unique H-C≡C group with a sharp, intense high wavenumber C-H stretch, and a sharp, intense, low wavenumber C-H wag. C≡C stretching peaks appear uniquely around 2200 but suffer from variable intensity, making them a questionable group wavenumber. This is the only diagnostic peak that disubstituted alkynes possess, sometimes making them difficult to detect.
References
- Webster’s Collegiate Dictionary (G.C. Merriam, Cambridge, Massachusetts, 1946).
- A. Streitwieser and C. Heathcock, Introduction to Organic Chemistry (Macmillan, New York, 1976).
- B.C. Smith, Spectroscopy 32(1), 14–21 (2017).
- B.C. Smith, Spectroscopy32(4), 19–23 (2017).
- B.C. Smith, Spectroscopy32(5), 22–26 (2017).
- B.C. Smith, Spectroscopy 30(4), 18–23 (2015).
- B.C. Smith, Infrared Spectral Interpretation: A Systematic Approach (CRC Press, Boca Raton, Florida, 1999).
- B.C. Smith, Spectroscopy30(9), 40–45 (2015).
- Beilstein Electronic Organic Chemical Database, contents as of 6/2017.
- B.C. Smith, Spectroscopy31(3), 34–37 (2016).
- B.C. Smith, Spectroscopy31(11), 28–34 (2016).

Brian C. Smith, PhD, is the West Coast Business Development Manager for CAMO Software, a company that sells chemometric, multivariate analysis, and process control software. Before joining CAMO, Dr. Smith ran his own FT-IR training and consulting business for more than 20 years. Dr. Smith has written three books on infrared spectroscopy: Fundamentals of FTIR and Infrared Spectral Interpretation, both published by CRC Press, and Quantitative Spectroscopy: Theory and Practice published by Academic Press. He can be reached at: SpectroscopyEdit@UBM.com

AI Shakes Up Spectroscopy as New Tools Reveal the Secret Life of Molecules
April 14th 2025A leading-edge review led by researchers at Oak Ridge National Laboratory and MIT explores how artificial intelligence is revolutionizing the study of molecular vibrations and phonon dynamics. From infrared and Raman spectroscopy to neutron and X-ray scattering, AI is transforming how scientists interpret vibrational spectra and predict material behaviors.
Real-Time Battery Health Tracking Using Fiber-Optic Sensors
April 9th 2025A new study by researchers from Palo Alto Research Center (PARC, a Xerox Company) and LG Chem Power presents a novel method for real-time battery monitoring using embedded fiber-optic sensors. This approach enhances state-of-charge (SOC) and state-of-health (SOH) estimations, potentially improving the efficiency and lifespan of lithium-ion batteries in electric vehicles (xEVs).
New Study Provides Insights into Chiral Smectic Phases
March 31st 2025Researchers from the Institute of Nuclear Physics Polish Academy of Sciences have unveiled new insights into the molecular arrangement of the 7HH6 compound’s smectic phases using X-ray diffraction (XRD) and infrared (IR) spectroscopy.