Trends in X-ray Techniques
Spectroscopy
Several leading scientists discuss their work to advance various X-ray techniques.
In advance of the 2018 Denver X-ray Conference, we asked leading scientists who will be speaking at the conference about current trends and advances in X-ray fluorescence and X-ray diffraction. Here, these investigators discuss their work to advance these techniques, in areas such as new measurement of X-ray fundamental parameters, the analysis of ancient ceramics, elemental analysis in pharmaceutical R&D, imaging, the analysis of geological materials, soil mineralogy, and more.
New Measurements of X-ray Fundamental Parameters
Y. Ménesguen, M.-C. Lépy, and B. Beckhoff
X-ray applications based on fluorescence analysis for quantification with or without reference specimens require an accurate knowledge of fundamental atomic data to provide reliable results associated with low associated uncertainties. For example, mass attenuation coefficients are basic parameters characterizing the interaction of the X-rays with matter. Users of attenuation coefficients can find these collected in databases made accessible through the internet on websites such as the National Institute of Standards and Technology (NIST), which provides the compilation made by Berger and colleagues, under the name XCOM (1). Certain measurements and calculations carried out by Chantler are also made available by NIST under the name FFAST (2). The database from the Center for X-Ray Optics (CXRO) is also available for free and is based on Henke's compilation (3). Another accessible database called EPDL97 (4) was assembled by Cullen for the International Atomic Energy Agency (IAEA).
Although very practical for the user, some of these tables are based on rather old measurements or on theoretical calculations where measurements were missing. However, the associated uncertainties are often rather quite large, especially for low photon energies, that is, below 1 keV. Indeed, the smaller the photon energy, the more difficult the measurement of mass attenuation coefficients with reliable uncertainties becomes. The estimated uncertainties of existing values below 1 keV are a few percent for all elements and certainly above 25% for photon energies below 500 eV (5). Recent measurements have also revealed significant differences of a few percent above certain K-edge absorption thresholds (6,7) for transition metals.
New measurements of mass attenuation coefficients carried out by the Laboratoire National Henri Becquerel (LNHB) took the advantage of using tunable monochromatic radiation at Soleil synchrotron, on the Metrologie beamline and using a specific procedure. Within the frame of different institutional and industrial metrology research projects, the LNHB and partners studied several elements from photon energies as low as 100 eV up to 35 keV, and special care was taken to ensure reliable uncertainties. We compare the new experimental values obtained with the EPDL97 library and other tables. Figures 1 and 2 were adapted with permission from reference 8 and show an example of results on nickel.
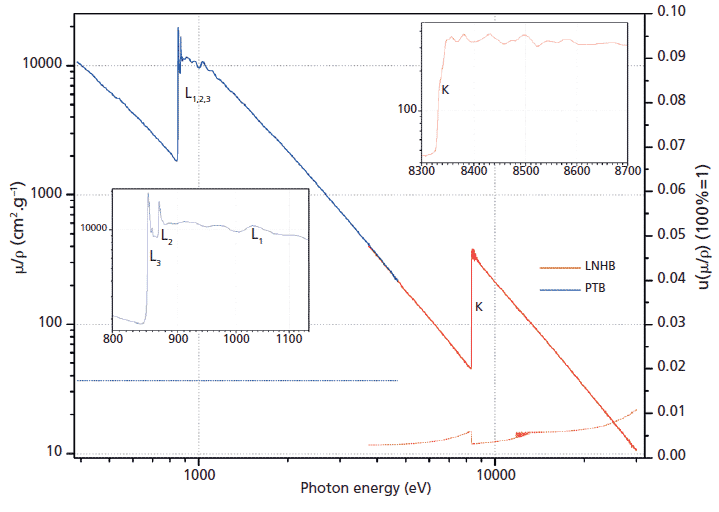
Figure 1: Mass attenuation coefficients of Ni measured with an energy resolution of 1 eV around the K-absorption edge (values on the left-hand vertical axis). The lower data points represent the relative standard uncertainties (right-hand vertical axis, where 0.10 means 10%). The inset graphs are details of the mass attenuation coefficients of Ni around the K- and L-absorption edges.
LNHB first used these values to perform fluorescence yields measurements experiments. Some K and L fluorescence yields were measured and found in good agreement with the most recent values and compilations. A useful outcome of these new mass attenuation coefficients values are the scattering factors and to complex optical indices. The optical indices are necessary to perform X-ray reflectivity calculation and reliable uncertainties would help to improve the trust in the fitted reflectivities or in the modeling.
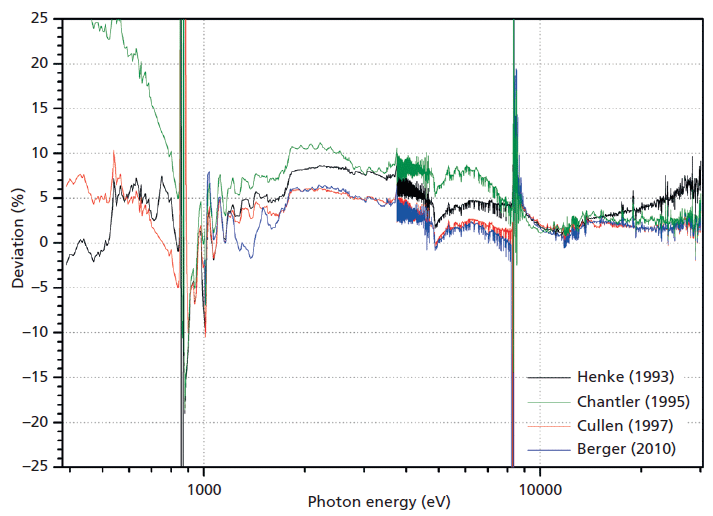
Figure 2: Comparison of experimental values with published databases. The relative deviation are plotted for the databases referenced therein.
References
(1) M. J. Berger, J. H. Hubbell, S. M. Seltzer, J. Chang, J. S. Coursey, R. Sukumar, and D. S. Zucker, "XCOM: Photon Cross Section Database (version 3.1)," National Institute of Standards and Technology Std., 2010, consultation date: 2017. Available: https://www.nist.gov/pml/xcom-photon-cross-sections-database.
(2) C.T. Chantler, J. Phys. Chem. Ref. Data 24, 71–643 (1995).
(3) B.L. Henke, E.M. Gullikson, and J.C. Davis, At. Data Nucl. Data Tables 54(2), 181–342 (1993).
(4) D.E. Cullen, J.H. Hubbell, and L. Kissel, "Epdl97: the Evaluated Photon Data Library, '97 Version," UCRL-50400, vol. 6, no. 5, 1997, consultation date: 2017. Available: https://wwwnds.iaea.org/epdl97/document/epdl97.pdf.
(5) M.O. Krause, C.W. Nestor, C.J. Sparks, and E. Ricci, Oak Ridge Natl. Lab. 5399, (1978) pp. 1–139.
(6) Y. Ménesguen, M. Gerlach, B. Pollakowski, R. Unterumsberger, M. Haschke, B. Beckhoff, and M.-C. Lépy, Metrologia 53, 7–17 (2016).
(7) Y. Ménesguen and M.-C. Lépy, Nucl. Instrum. Methods Phys. Res., Sect. B 268(16), 2477–2486 (2010).
(8) Y. Ménesguen, M.-C. Lépy, P. Hönicke, M. Müller, R. Unterumsberger, B. Beckhoff, J. Hoszowska, J.-Cl Dousse, W. Blachucki, Y. Ito, M. Yamashita and S. Fukushima, Metrologia 55, 56–66 (2018).
Y. Ménesguen and M.-C. Lépy are with the CEA, LIST, Laboratoire National Henri Becquerel (LNE-LNHB), Gif-sur-Yvette, France. B. Beckhoff is with Physikalisch-Technische Bundesanstalt in Berlin, Germany.
Using X-ray Fluorescence and Diffraction to Elucidate Source Materials and Firing Conditions of Pompeian Ceramics
Celestino Grifa, Mariano Mercurio, Chiara Germinario, David Bish, Alberto De Bonis, Vincenzo Morra, Piergiulio Cappelletti, Laetitia Cavassa, and Alessio Langella
Numerous archaeometric and analytical studies have been made of the ceramic materials unearthed in and around Pompeii, all of which represent invaluable sources of archaeological data, shedding light on ancient Roman habits, culture, and technology. A large amount of pottery has been discovered, and a team of archaeologists (1) unearthed an outstanding and unique example of a Roman ceramic workshop (Via dei Sepolcri, Figure 1), including the equipment and raw materials, along with unfired, fired, and overfired shaped vessels used on the day in A.D. 79 just before the eruption (2). These materials allow researchers to decipher both the source materials and firing processes used by the ancient artisans. Many sources have been proposed, including local marine, volcanic, and fluvial or lacustrine clays. Clarification of the sources of the clays would expand our understanding of trade routes and the mechanisms of transport and trade. The clay raw materials and the unfired vessels unearthed in the Via dei Sepolcri workshop in Pompeii represent an important opportunity for such clarification, and the occurrence of fired and unfired specimens allows us to clarify firing times and temperatures using existing knowledge of the thermal transformations of the raw materials.
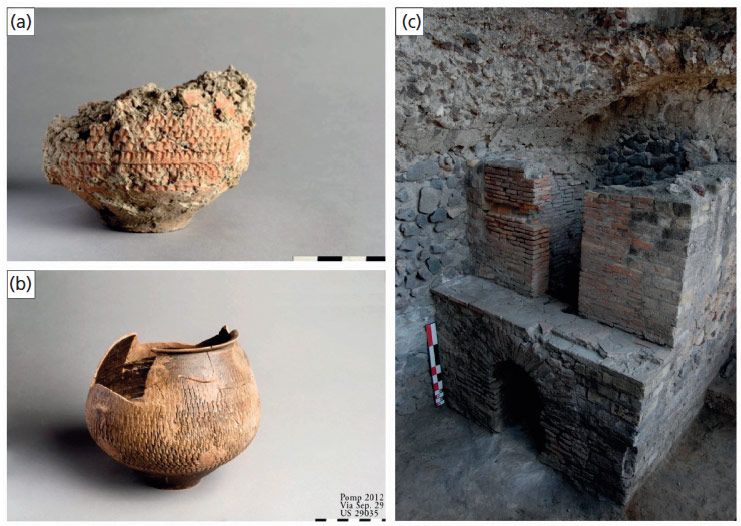
Figure 1: (a) Pompeian unfired pottery, (b) fired pottery, and (c) the kiln from the Via dei Sepolcri workshop.
We are using a two-pronged approach to analyze these materials using mineralogical (X-ray diffraction [XRD]) and geochemical (X-ray fluorescence [XRF] and inductively coupled plasma–mass spectroscopy [ICP-MS]) methods, including rare-earth element (REE) geochemistry, supplemented by optical and scanning electron microscopy (SEM) examinations. Figure 2 represents the results of Rietveld refinements, wherein observed XRD data were fit with a pattern simulated using the known crystal structures of the component phases (including 20% corundum internal standard). Broad clay mineral peaks were fit with Pearson VII profiles. The XRD data in Figure 2a represent the typical mineralogy of the unfired material; the presence of chlorite, smectite, kaolinite (with minor halloysitic material), and an illitic material, all hydrous phyllosilicates, indicates that the material is unfired, and the presence of calcite (CaCO3, primarily foraminifera, based on microscopic examination) is apparent. The "amorphous" component primarily represents the smectitic component, along with volcanic glass and any amorphous material associated with the biogenic component. The thermal behavior of these individual minerals is well understood, and XRD analysis of partially, normally, and overfired materials sheds considerable light on firing temperatures and times used almost 2000 years ago for pottery production.
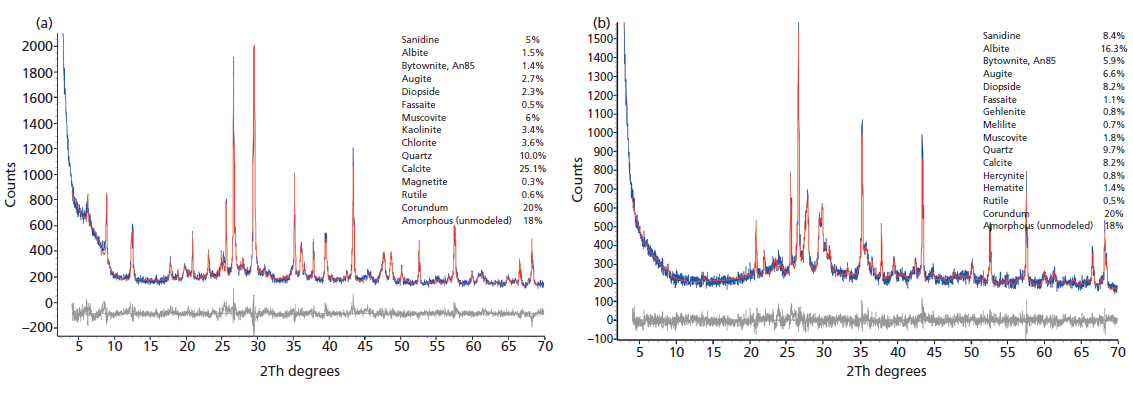
Figure 2: (a) Rietveld fit to XRD data (CuKα) for unfired pottery (PSP 2) from Via dei Sepolcri, showing diffraction peaks from phyllosilicates and the presence of a minor amorphous component. Corundum was added as an internal intensity standard. Observed data are blue and the calculated fit using the phases listed on the right is in red, with the difference in black. (b) Rietveld fit to XRD data (CuKα) for an obviously fired pottery sample from Via dei Sepolcri (PSP 17), showing the absence of diffraction peaks from phyllosilicates, the presence of high-temperature oxide and silicate products, and the presence of a large amorphous component. Corundum was added as an internal intensity standard. Observed data are blue and the calculated fit using the phases listed on the right is in red, with the difference in black.
The data in Figure 2a contrast with those of Figure 2b, showing a similar Rietveld fit using data for another sample from the same kiln; based on the absence of hydrous phyllosilicates and the presence of high-temperature products, this sample was obviously already fired. In general, the fired and overfired ceramics contained a large amount of amorphous material, from one-third to almost two-thirds of the ceramic product, and most clay minerals and calcite have been destroyed, consistent with firing temperatures of 850–950 °C. Significantly, the Pompeiian ceramics do not contain detectable gehlenite (Ca2Al[AlSiO7]), a member of the melilite group that is common in similar products fired between 850 °C and 1000 °C (that is, the "gehlenite problem") (3). Heimann suggests that its absence results from the narrow and small grain size distribution in the raw materials of higher-quality ceramics, whereas coarse, low-fired wares of similar mineralogy contain significant gehlenite. Moreover, gehlenite is metastable and may have undergone transformation to calcite plus smectite because of post-eruption phenomena (3). This hypothesis is consistent with the calcite XRD profiles; Rietveld refinements for fired samples reveal considerably broader peaks compared with the same peaks observed in XRD patterns of clay bodies and unfired samples. Calcite in unfired samples typically shows no crystallite size broadening but significant strain broadening, typical of biogenic material, whereas calcite in fired material shows a large amount of crystallite-size broadening (<100 nm) and approximately twice the strain broadening. These results for calcite may also be explained by partial but extensive decomposition of calcite during firing, which is also supported by some optical and SEM images. Estimated firing temperatures are likely too high to permit calcite persistence in many fired and overfired samples. The lack of gehlenite, the existence of calcite with very small crystallite size, and the occasional presence of analcime (possibly secondary) in fired and overfired materials argue for the existence of some post-eruption alteration since A.D. 79. Such alteration is also supported by optical and SEM imaging.
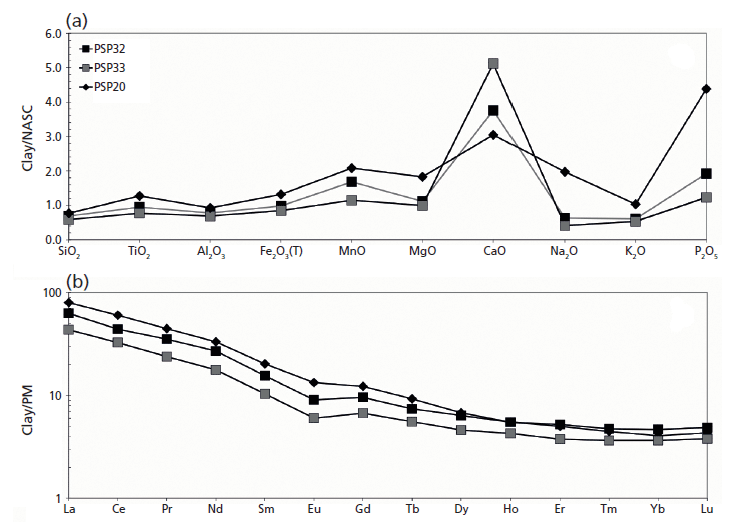
Figure 3: (a) Major oxides and (b) REE pattern of raw materials (PSP 32 and 33 clays and PSP 20 volcanic sand) recovered in the archaeological site of Via dei Sepolcri.
Geochemical data for the materials discovered in the workshop (Figure 3a) show that the initial clay body was a CaO-rich sediment (on average 13.0 wt.%) with 46.0, 14.0, and 6.0 wt.%, respectively, of SiO2, Al2O3, and Fe2O3 (Figure 3a). Interestingly, the sandy deposit used as a raw material (temper), despite its volcanic nature, is similar in composition to the clayey material, with the exception of a slightly lower CaO and a higher alkali concentration (4.0 wt.%). This similarity is also reflected in the REE data (Figure 3b), where the sandy volcanic deposit has only a slight REE enrichment with respect to the clay deposits and the pottery samples (Figure 4). The geochemical data clarify several important issues regarding the sources of the raw materials. No Ca-rich clayey deposits are known in the Bay of Naples region, where clay-rich materials commonly have an alluvial origin or derive from the weathering of pyroclastic deposits (3,4). Previous research (4,5) suggested outcrops in the Salerno province (for example, the Montecorvino Rovella outcrop), and these clay minerals appear geochemically similar to the materials used in the Via dei Sepolcri workshop.
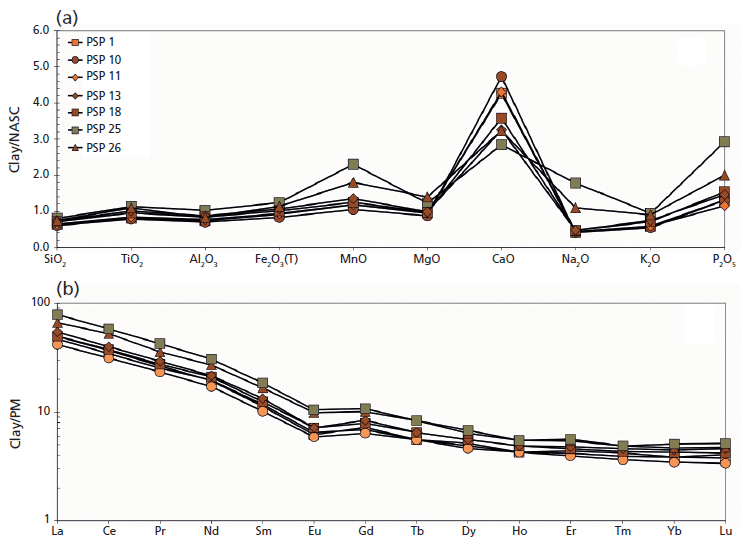
Figure 4: (a) Major oxides and (b) REE pattern of unfired (PSP 1, 10, 11), fired (PSP 13, 18, 26), and overfired vessels (PSP 25) from the Via dei Sepolcri workshop.
References
(1) L. Cavassa, B. Lemaire, G. Chapelin, A. Lacombe, J.-M. Piffeteau, and G. Stelo, "Pompéi. L'atelier de potier de la via dei Sepolcri," Chronique des activités archéologiques de l'école française de Rome 29, Online: http://cefr.revues.org/1139 (2014).
(2) C. Grifa, A. De Bonis, A. Langella, M. Mercurio, G. Soricelli, and V. Morra, J. Arch. Sci. 40, 810–826 (2013).
(3) R.B. Heimann, in The Oxford Handbook of Archaeological Ceramic Analysis, A.M.W. Hunt, Ed. (Oxford University Press, Oxford, UK, 2017), Chap. 19.
(4) A. De Bonis, C. Grifa, G. Cultrone, P. De Vita, A. Langella, and V. Morra, Geoarchaeology 28, 478–503 (2013).
(5) J.T. Peña and M. McCallum, American Journal of Archaeology 113, 165–201 (2009).
Celestino Grifa, Mariano Mercurio, Chiara Germinario, and Alessio Langella are with DST at the University of Sannio in Benevento, Italy. David Bish is with Earth and Atmosphere Sciences at Indiana University in Bloomington, Indiania. Vincenzo Morra and Piergiulio Cappelletti are with DISTAR at Federico II University in Naples, Italy. Alberto De Bonis is with the Institut für Klassische Archäologie Universität in Wien, Austria. Laetitia Cavassa is with the Centre Camille Jullian at Aix-Marseille Université in France.
Using Wavelength-Dispersive X-ray Fluorescence as a Walk-Up, High-Throughput Alternative to Inductively Coupled Plasma Spectrometry for Pharmaceutical Analyses
Tiffany M. Brucker, Eric J. Borsje, and Henrik T. Rasmussen
Heavy metal impurity levels are measured in pharmaceuticals because of the possible toxicological effects. The International Conference of Harmonization (ICH) lists permitted daily exposures (PDE) for each element, and materials must be within these specifications (1). Currently, inductively coupled plasma (ICP) spectrometry is the most commonly used technique to measure metals within the pharmaceutical industry, and is the recommended technique utilized in the recently updated United States Pharmacopeia (USP) chapter on elemental impurity procedures (2). However, ICP has several drawbacks, including but not limited to complex sample preparation procedures (using strong acids, for digestion of samples); the need for exact weights and dilution volumes; sample destruction; daily calibration; potential carry-over between samples; and the need for skilled operators.
Wavelength-dispersive X-ray fluorescence (WDXRF) is an alternative technique for elemental analysis used across numerous industries, yet limited literature exists for pharmaceutical applications (3–6). WDXRF is a surface technique in which an X-ray tube (typically rhodium) directs X-rays at a sample, causing electron excitation. Fluorescence emits from the sample. These X-rays direct to an analyzing crystal where they diffract off the crystal at a specific angle (2-theta). A detector positioned at a specific angle can measure the X-rays at the element's wavelength and transform the X-rays into electronic pulses. The electronic pulses are counted by a detector. Advantages of WDXRF include minimal sample preparation, nondestructive analysis, and the absence of daily calibration. Solid powder samples containing inorganic synthetic catalysts can be prepared by weighing into a vessel and scanning the material without dilutions. The technique is noncontact in nature so it is nondestructive. When developing analytical methods, standard curves are stored into the method, so a daily calibration is not needed. Calibration curves can be periodically checked using a glass fusion bead or another reference standard source containing the method elements. These sources can drift the calibration curves after scanning by applying a correction factor to the curve as the X-ray tube ages to ensure consistent results. The thickness of a sample must also be considered when developing WDXRF methods. Depending on the elements of interest and its matrix, there is a minimum thickness needed for the sample to absorb all X-rays and emit signal. If the sample is not at this minimum thickness, then the results will be inconsistent. Thus, as long as a method is developed where the sample preparation is above this minimum thickness (also known as the infinite thickness), then an exact weight is not needed. We evaluated the benefits and capabilities of WDXRF, comparing quantitative performance with ICP-optical emission spectrometry (OES) methods while additionally investigating the feasibility of creating a walk-up workflow with high-throughput capability.
WDXRF methods were developed for solid powder samples, using sample amounts of 45–55 mg. Appropriate standards were prepared by weighing 50 mg ±5 mg of cellulose into liquid sample cups with 10 mm sample windows, spiking with metal standards of known concentrations, and vacuum drying overnight. Samples were prepared by simply weighing 50 mg ±5 mg of material into the same cups. Figure 1 summarizes these steps including autosampler loading.
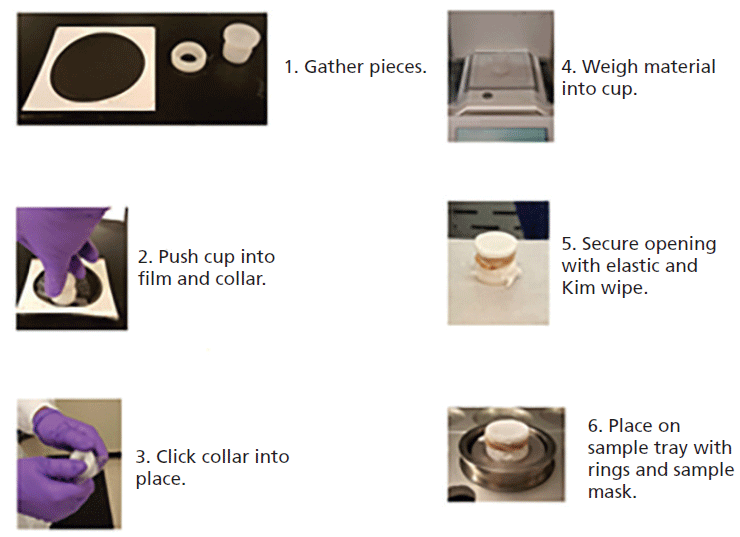
Figure 1: Sample preparation instructions for walk-up WDXRF users.
Linear curves were established for three common elements of interest: palladium, copper, and nickel. Correlation coefficients were r ≥0.9990 for all elements. Standards were run as samples to confirm standard curve results. Various available materials that were previously analyzed by ICP-OES methods were run for comparison. Sample results were separated into two categories: less than or equal to the estimated limit of quantitation (LOQ, 10 ppm), and greater than the estimated LOQ. Samples less than or equal to the LOQ were considered comparable to the original ICP-OES result if the ICP-OES result was also less than or equal to 10 ppm. Samples above the LOQ were considered comparable to ICP-OES results if they met the USP accuracy specification of 70–150% (2). More than 95% of samples tested met these criteria (n = 75 samples), the majority of samples available were below the estimated LOQ for each method. This results summary is shown in Figure 2. As more materials become available additional assessment will be conducted for comparison, particularly for copper and nickel.
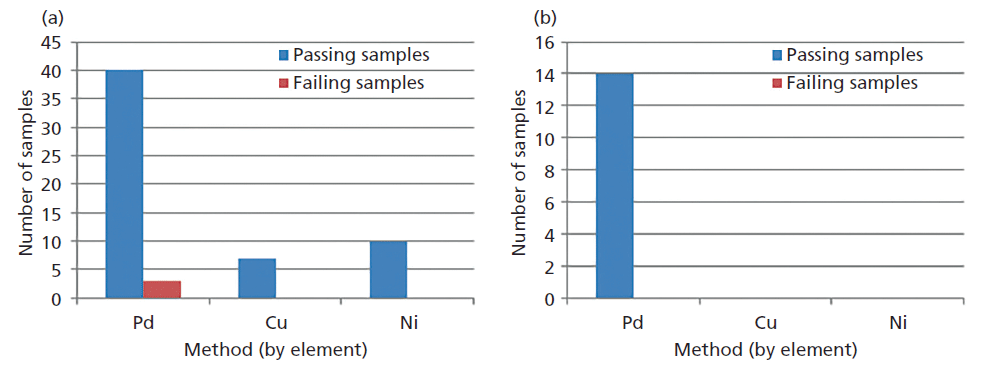
Figure 2: Results summary shown by the three methods created on WDXRF: (a) ≤ 10 ppm est. LOQ (61 samples), (b) >10 ppm est. LOQ (14 samples).
Additional options were considered with the instrument software and installation requirements to streamline the entire workflow. Optimizing all aspects of the workflow allowed the ability to train more than 20 users across three departments with a variety of skill levels and knowledge of the system. Furthermore, this workflow supports throughput of more than 100 samples per day when needed, in comparison to the average throughput of 60 samples a day using ICP-OES methods. Running a single sample for ICP-OES takes about 2 h from turning on the plasma to processing data. In as little as 10 min, a user can prepare their sample, run it, and upload their result file electronically using our XRF walk-up workflow. If the user needs to keep their sample or rerun it, they can.
Creating a simple and flexible high-throughput workflow for inorganic elemental impurity analysis expedites analysis of in-house materials. Investing in method development to ensure comparable results to in-house ICP methods gives additional confidence to data generated. WDXRF is an essential technique in any pharmaceutical analytical laboratory hoping to terminate the cumbersome pitfalls of ICP while satisfying the demands of synthetic route development timelines.
References
(1) International Conference on Harmonization, ICH Q3D Elemental Impurities Guidance for Industry, (ICH, Geneva, Switzerland, September 2015, https://www.fda.gov/downloads/drugs/guidances/ucm371025.pdf).
(2) General Chapter <233> "Elemental Impurities-Procedures" in second supplement to United States Pharmacopeia 38-National Formulary 33 (United States Pharmacopeia Convention, Rockville, Maryland, 2015,
).
(3) M. West, A. Ellis, P. Potts C. Streli, C. Vanhoof, D. Wegrzynek, and P. Wobrauschek, J. Anal. At. Spectrom. 24, 1289–1326 (2009).
(4) V. Balaram, TrAC, Trends Anal. Chem. 80, 83–95 (2016).
(5) L. Gonçalves, I. Costa, and J. Brito, Anal. Methods 3, 1468 (2011).
(6) E. Marguĺ, C. Fontàs, A. Buendía, M. Hidalgo, and I. Queralt, J. Anal. At. Spectrom. 24, 1253–1257 (2009).
Tiffany M. Brucker, Eric J. Borsje, and Henrik T. Rasmussen are with Vertex Pharmaceuticals in Boston, Massachusetts.
New XRD Data–Based Approaches to Soil Mineralogy
Stephen Hillier and Benjamin Butler
Soils are complex materials formed at the interface of the geosphere, the biosphere, and the atmosphere, and they perform many functions relating to biomass production, environmental interactions, and biodiversity. In addition to various forms of organic matter, living organisms, gases, water, and solutes, most soils consist largely of a mixture of primary minerals derived from the soils geological "parent materials," along with secondary minerals such as clay minerals and iron oxides, often formed by weathering. Additionally, the suite of minerals present in any given soil may be variously distributed amongst the sand, silt, and clay particle size fractions, while also varying widely in chemical composition, crystal structure, surface area, and solubility. Thus, it has long been recognized that soil minerals are intimately related, both directly and indirectly, to many of the physical, chemical, and biological properties of a soil, which in turn govern the functions it may perform. Given the complexity of soil, however, it has been notoriously challenging to systematize soil property–mineralogy relationships.
Conventional approaches for the assessment of soil mineralogy are primarily based on X-ray diffraction (XRD) measurements. With this approach the first stage of data analysis involves identification of the minerals present as indicated by the XRD patterns, and a subsequent stage then typically seeks to quantify the relative abundance of the different minerals identified in the soil. In recent years, the collection of archived digital XRD patterns from soil has increased, with datasets containing thousands of spatially referenced XRD measurements and associated soil properties becoming available (for example, those collected for the National Soil Inventory of Scotland [NSIS] and the Africa Soil Information Service [AfSIS]) (1,2). Since many soil properties are closely related to soil mineralogy, such datasets present unique opportunities to advance the understanding of the role of soil minerals in governing or influencing many soil properties, processes, and functions. The application of conventional mineralogical analysis to such large data sets, however, would be laborious and time consuming and is undoubtedly an obstacle to obtaining insight and further understanding of soil mineral–soil property relationships.
If instead the XRD patterns are treated simply as digital signatures, which encode information on both crystalline soil mineral (peaks) and amorphous (background) components, then computational data driven approaches such as data mining and cluster analysis, which are already frequently applied to similar datasets of soil spectra (3,4) may be applied. When XRD data are viewed like this, conventional expert analysis and interpretation involving the steps of mineral identification and quantification become somewhat redundant, at least in the early stages of processing large data sets.
Two recent examples of these approaches being applied to soil XRD datasets include the application of the machine learning algorithm "Cubist" to predict and interpret a range of Scottish soil properties (5), and an investigation into the pretreatment of AfSIS XRD data for accurate cluster analysis (6).
The application of Cubist to the NSIS XRD dataset illustrates how data of this kind can be used to predict several soil properties. Notably, total organic carbon could be predicted with greater accuracy than with an equivalent near-infrared (NIR) spectroscopy dataset, highlighting the value of information within the background signal of reproducible XRD patterns, a feature of the total pattern that is frequently ignored, and indeed it is often removed in conventional approaches to the analysis of XRD data. Cubist was also able to predict the concentration of aqua-regia extractable potassium (Kaqr, a common measure of potassium used for soil survey) in the soil dataset with notable accuracy. The variables selected by Cubist to predict Kaqr also indicate that this property is particularly sensitive to phyllosilicate K (Figure 1), even though the major reservoir of K in many soils would be the K-feldspar minerals, confirming previous analysis that phyllosilicates are the principle source of Kaqr (7). Data mining approaches, therefore, offer a powerful means of understanding mineral contributions to a wealth of important soil properties and their measured variations, with the future prospect for powerful predictive capability.
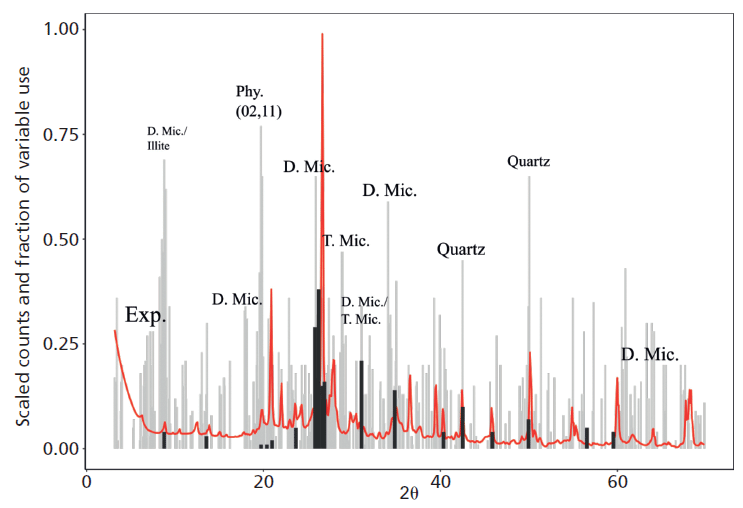
Figure 1: Variables selected for decision (black sticks) and regression (grey sticks) parameters by the Cubist machine learning algorithm for prediction of Kaqr in Scottish soils, plotted alongside a mean XRD pattern of the data. The variables selected for regression parameters are dominated by regions associated with phyllosilicate peaks (that is, Exp. = expandable phyllosilicate, D. Mic = dioctahedral mica, Phy. = generic (02,11) phyllosilicate, T. Mic = trioctehdral mica), suggesting these minerals are strongly associated with Kaqr.
Another data-based approach is cluster analysis and an investigation into the effects of pretreating soil XRD patterns (via alignment, binning, square root transformation, and scaling) before cluster analysis has recently shown this data pretreatment to be key in promoting the most appropriate classification of a soil XRD dataset into discrete groups. Correcting for the common experimental aberrations of sample displacement and variations in signal intensities via alignment and scaling, respectively, act to reduce sample independent variation. Additionally, it is shown that the disproportionally strong diffraction signal of quartz (an almost omnipresent mineral) in many soils, which can often mask or obscure the information from less strongly diffracting phases, can be rescaled using a square-root transformation. This transformation allows the signal from less strongly diffracting minerals to exert more influence when clustering based on principal component scores. When pretreatments were applied to a dataset of 12 African (AfSIS) soils each analyzed five times by five different personnel, their enhancing effects on the separation of groups into distinct clusters proved to be significant (p < 0.05), resulting in suitable clustering of the dataset (Figure 2). Understanding the importance of data pretreatment before clustering is a necessary prelude to its application to derive insight into soil mineral soil property relations in the full-scale data sets.
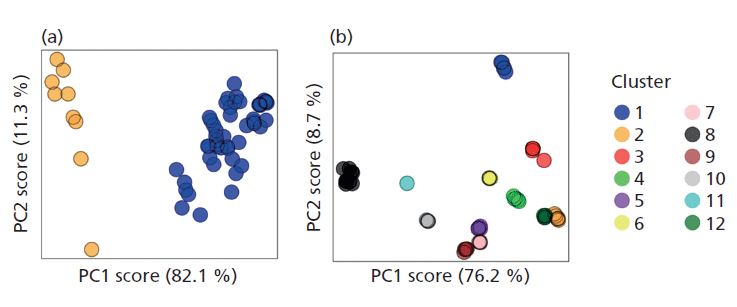
Figure 2: Pretreatment of soil X-ray diffraction data for cluster analysis. (a) Untreated data formed only two discrete clusters, based on maximization of the partition coefficient of the fuzzy-c-means algorithm. (b) In contrast, data pretreated via alignment, binning, square-root transformation of scaling formed 12 discrete clusters based on the same objective measure, and display significantly better grouping based on the F-statistic of a MANOVA. (Adapted with permission from reference 6.)
Together with other computationally intensive approaches such as high-throughput full pattern fitting quantitative mineralogical analysis in which soil mineral identification and subsequent quantification from XRD data are coupled, these departures from conventional methods of analyzing soil XRD data contribute to a vision of an emerging field of "digital soil mineralogy." This vision, so defined, ultimately seeks to apply new data focused approaches to the analysis of spatially referenced soil XRD data to understand the contributions of soil minerals to soil properties and soil functions, ultimately contributing to inform the sustainable soil use and management of the future.
Acknowledgments
This work was supported by a Macaulay Development Trust Fellowship. The support of the Scottish Government's Rural and Environment Science and Analytical Services Division (RESAS) is also gratefully acknowledged.
References
(1) http://soils.environment.gov.scot/maps/point-data/national-soil-inventory-of-scotland-nsis-1978-88/.
(2) http://africasoils.net/.
(3) R.A. Viscarra Rossel and T. Behrens, Geoderma. 158(1–2), 46–54 (2010).
(4) R.A. Viscarra Rossel et al., Earth-Science Rev. 155, 198–230 (2016).
(5) B.M. Butler, S.M. O'Rourke, and S. Hillier, Geoderma. 329, 43–53 (2018).
(6) B.M. Butler et al., Geoderma. submitted (2018).
(7) Y. Andrist-Rangel et al., Geoderma. 158(3–4), 303–14 (2010).
Stephen Hillier is with The James Hutton Institute in Aberdeen, United Kingdom, and the Department of Soil and Environment, at the Swedish University of Agricultural Sciences in Uppsala, Sweden.
Benjamin Butler is with The James Hutton Institute.
SI-Traceable Analysis of Nanomaterials by X-ray Spectrometry
Burkhard Beckhoff
The development of new materials and the assessment of nanomaterials requires the correlation of the materials' functionality or toxicity with their chemical and physical properties. To probe these properties reliably, analytical methods that are both sensitive and traceable at the nano- and microscales are required (1). The reliability of most analytical methods is based on the availability of reference materials or calibration samples, the spatial elemental composition of which has to be as similar as possible to the matrix of the specimens of interest. However, there is a drastic lack of reference materials, in particular at the nanoscale. This considerably affects the quantification reliability of most analytical methods, as reference materials are used to compensate for missing knowledge on instrumental or experimental parameters of the analytical technique. In many categories (such as film thickness, nano-objects or nanoparticles, depth profiling resolution) the number of existing nanoscaled reference materials (2) corresponds to the number of new nanomaterials introduced in the market each month.
The German National Metrology Institute Physikalisch-Technische Bundesanstalt (PTB) addresses this challenge of missing nanoscaled reference materials by means of a bottom-up, International System of Units (SI)-traceable X-ray analytical method, X-ray spectrometry (XRS), where all instrumental and experimental parameters are determined with known contributions to the uncertainty of the analytical results. This first principle–based approach in XRS does not require any reference materials, but a complete characterization of the analytical instruments' characteristics and, in addition, knowledge on the X-ray fundamental parameters related to the elements composing the sample. The characterization of instrumental and experimental parameters can be reliably performed using X-ray radiometry, thus metrology of X-ray radiation, allowing for the calibration of components of X-ray instruments by comparing them to primary source or detector standards (3). During the last decade, an international consortium of key players in academics, the industry, and metrology organized a continuously updated X-ray fundamental parameters roadmap (4). Current fundamental parameter-related research aims at improving the knowledge on fundamental parameter data by means of experimental and theoretical methods by novel instrumentation, specimens, and algorithms (5–7) allowing for a reduction in analytical uncertainties of XRS for both chemical traceability and SI traceability.
Synchrotron radiation–based X-ray spectrometric methods allow for the variation of the analytical sensitivity, discrimination capability, quantification reliability, and information depth needed to effectively reveal the spatial, elemental, and chemical specimen parameters of interest. SI-traceable XRS has been successfully applied as a reference measurement technique to determine surface contamination (8) on flat substrates, perform particle characterization with respect to elemental or species composition, and enable interfacial speciation (9) or elemental depth profiling (10) of nanolayered systems. For process-oriented applications or other analytical methods, calibration samples could be qualified with respect to layer composition and thickness in advanced materials (11), surface functionalization (12) or biomedical materials (13). Recent instrumental achievements provide access to liquids (14), liquid-solid interfaces and even the in-situ and operando elemental analysis and chemical speciation of nanoscaled battery materials (15). Furthermore, X-ray spectrometry under grazing incidence is capable of revealing analytical and dimensional information from layered systems (16) and particles deposited on surfaces (17).
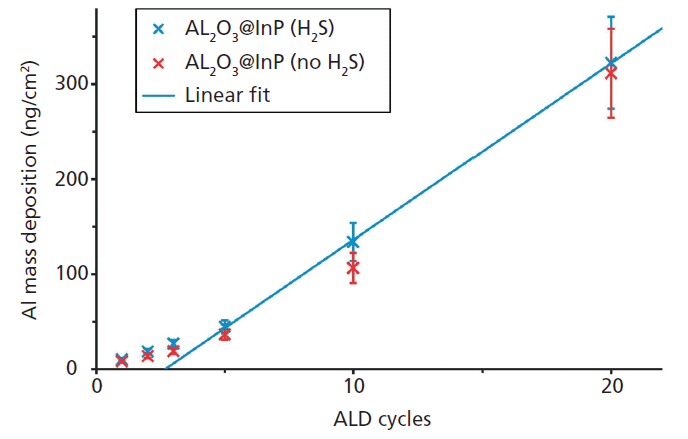
Figure 1: Al mass deposition of different ALD depositions on passivated and not-passivated InP substrates as revealed by reference-free TXRF analysis.
An example for the qualification of a set of high-k nanolayers as calibration samples for laboratory instruments are atomic layer depositions (ALD) of Al2O3 on different InP substrates from the very first to the 20th cycle (18). Figure 1 shows the corresponding absolute Al mass depositions as revealed by reference-free X-ray fluorescence analysis under grazing incidence conditions using monochromatized synchrotron radiation of high spectral purity. While the quantification is possible right from the first ALD cycle because of the sub-monolayer sensitivity of TXRF, one may note that the ALD growth on S passivated InP substrate becomes linear after the third ALD cycle. Figure 2 depicts the angular dependence of the Al, S (passivation), and P (substrate) K-fluorescence intensities as revealed by the X-ray standing wave (XSW) field of a reference-free GIXRF analysis of a 3-nm-thick Al2O3 deposition. The angular signal increases of Al and S fluorescence radiation are well separated, thus indicating that no relevant diffusion of S into the Al layer took place.
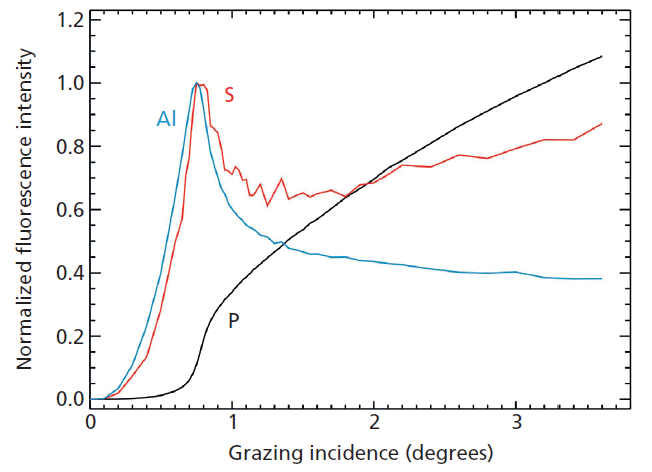
Figure 2: Angular dependence of the normalized K-fluorescence intensities of Al, S, and P for a 3-nm thick Al2O3 ALD deposition on a sulfur-passivated InP substrate as revealed by reference-free GIXRF analysis.
References
(1) "Proceedings of the 2017 E-MRS Spring Meeting Symposium S ALTECH 2017 – Analytical techniques for precise characterization of nanomaterials," Phys. Status Solidi C 14(12), 1720017 (2017).
(2) Nanoscaled Reference Materials, A worldwide survey of existing reference materials at the nanoscale in different categories by the German Federal Institute for Materials Research and Testing (BAM) in cooperation with ISO/TC 229 Nanotechnologies, see http://www.nano-refmat.bam.de/en/.
(3) B. Beckhoff, A. Gottwald, R. Klein, M. Krumrey, R. Müller, M. Richter, F. Scholze, R. Thornagel, and G. Ulm, Phys. Status Solidi B 246, 1415–1434 (2009).
(4) "Second Roadmap on Atomic Fundamental Parameters for X-ray Methodologies," International Initiative on X-ray Fundamental Parameters, www.exsa.hu/news/wp-content/uploads/IIFP_Roadmap_V2.pdf.
(5) P. Hönicke, M. Kolbe, M. Müller, M. Mantler, M. Krämer, and B. Beckhoff, Phys. Rev. Lett. 113, 163001 (2014).
(6) M. Guerra, J.M. Sampaio, T.I. Madeira, F. Parente, P. Indelicato, J.P. Marques, J.P. Santos, J. Hoszowska, J.-Cl. Dousse, L. Loperetti, F. Zeeshan, M. Müller, R. Unterumsberger, and B. Beckhoff, Phys. Rev. A 92, 022507 (2015).
(7) Y. Ménesguen, M. Gerlach, B. Pollakowski, R. Unterumsberger, M. Haschke, B. Beckhoff, and M.-C. Lépy, Metrologia 53, 7 (2016).
(8) B. Beckhoff, R. Fliegauf, M. Kolbe, M. Müller, J. Weser, and G. Ulm, Anal. Chem. 79, 7873–7882 (2007).
(9) B. Pollakowski, P. Hoffmann, M. Kosinova, O. Baake, V. Trunova, R. Unterumsberger, W. Ensinger, and B. Beckhoff, Anal. Chem. 85, 193 (2013).
(10) P. Hönicke, B. Beckhoff, M. Kolbe, D. Giubertoni, and J. van den Berg, Anal. Bioanal. Chem. 396, 2825–2832 (2010).
(11) C. Streeck, W. Unger, and B. Beckhoff, Spectroscopy Europe 30, 6–9 (2018).
(12) T. Fischer, P.M. Dietrich, C. Streeck, S. Ray, A. Nutsch, A. Shard, B. Beckhoff, W.E.S. Unger, and K. Rurack, Anal. Chem. 87, 2685 (2015).
(13) B. Pollakowski-Herrmann, A. Hornemann, A.M. Giovannozzi, F. Green, P. Gunning, C. Portesi, A. Rossi, C. Seim, R. Steven, B. Tyler, and B. Beckhoff, J. Pharmaceut. Biomed. Anal. 150, 308 (2018).
(14) K. Witte, C. Streeck, I. Mantouvalou, S.A. Suchkova, H. Lokstein, D. Grötzsch, W. Martyanov, J. Weser, B. Kanngie er, B. Beckhoff, and H. Stiel, J. Phys. Chem. B 120, 11619 (2016).
(16) M. Müller, S. Choudhury, K. Gruber, V.B. Cruz, B. Fuchsbichler, T. Jacob, St. Koller, M. Stamm, L. Ionov, and B. Beckhoff, Spectrochim. Acta B 94–95, 22 (2014).
(17) V. Soltwisch, P. Hönicke, Y. Kayser, J. Eilbracht, J. Probst, F. Scholze and B. Beckhoff, Nanoscale 10, 6177–6185 (2018).
(18) EURAMET EMPIR project AEROMET 2017-2020, http://www.aerometproject.com/.
(19) A. Delabie, S. Sioncke, J. Rip, S. Van Elshocht, G. Pourtois, M. Müller, B. Beckhoff, and K. Pierloot, J. Vac. Sci. Technol. A 30, 01A127 (2012.
Burkhard Beckhoff is head of the X-ray spectrometry group of the German National Metrology Institute Physikalisch-Technische Bundesanstalt (PTB) in Berlin, Germany.
AI-Powered SERS Spectroscopy Breakthrough Boosts Safety of Medicinal Food Products
April 16th 2025A new deep learning-enhanced spectroscopic platform—SERSome—developed by researchers in China and Finland, identifies medicinal and edible homologs (MEHs) with 98% accuracy. This innovation could revolutionize safety and quality control in the growing MEH market.
New Raman Spectroscopy Method Enhances Real-Time Monitoring Across Fermentation Processes
April 15th 2025Researchers at Delft University of Technology have developed a novel method using single compound spectra to enhance the transferability and accuracy of Raman spectroscopy models for real-time fermentation monitoring.