Tri-Range Applications of the Spectrum 3 Infrared Spectrometer
Glass Analysis
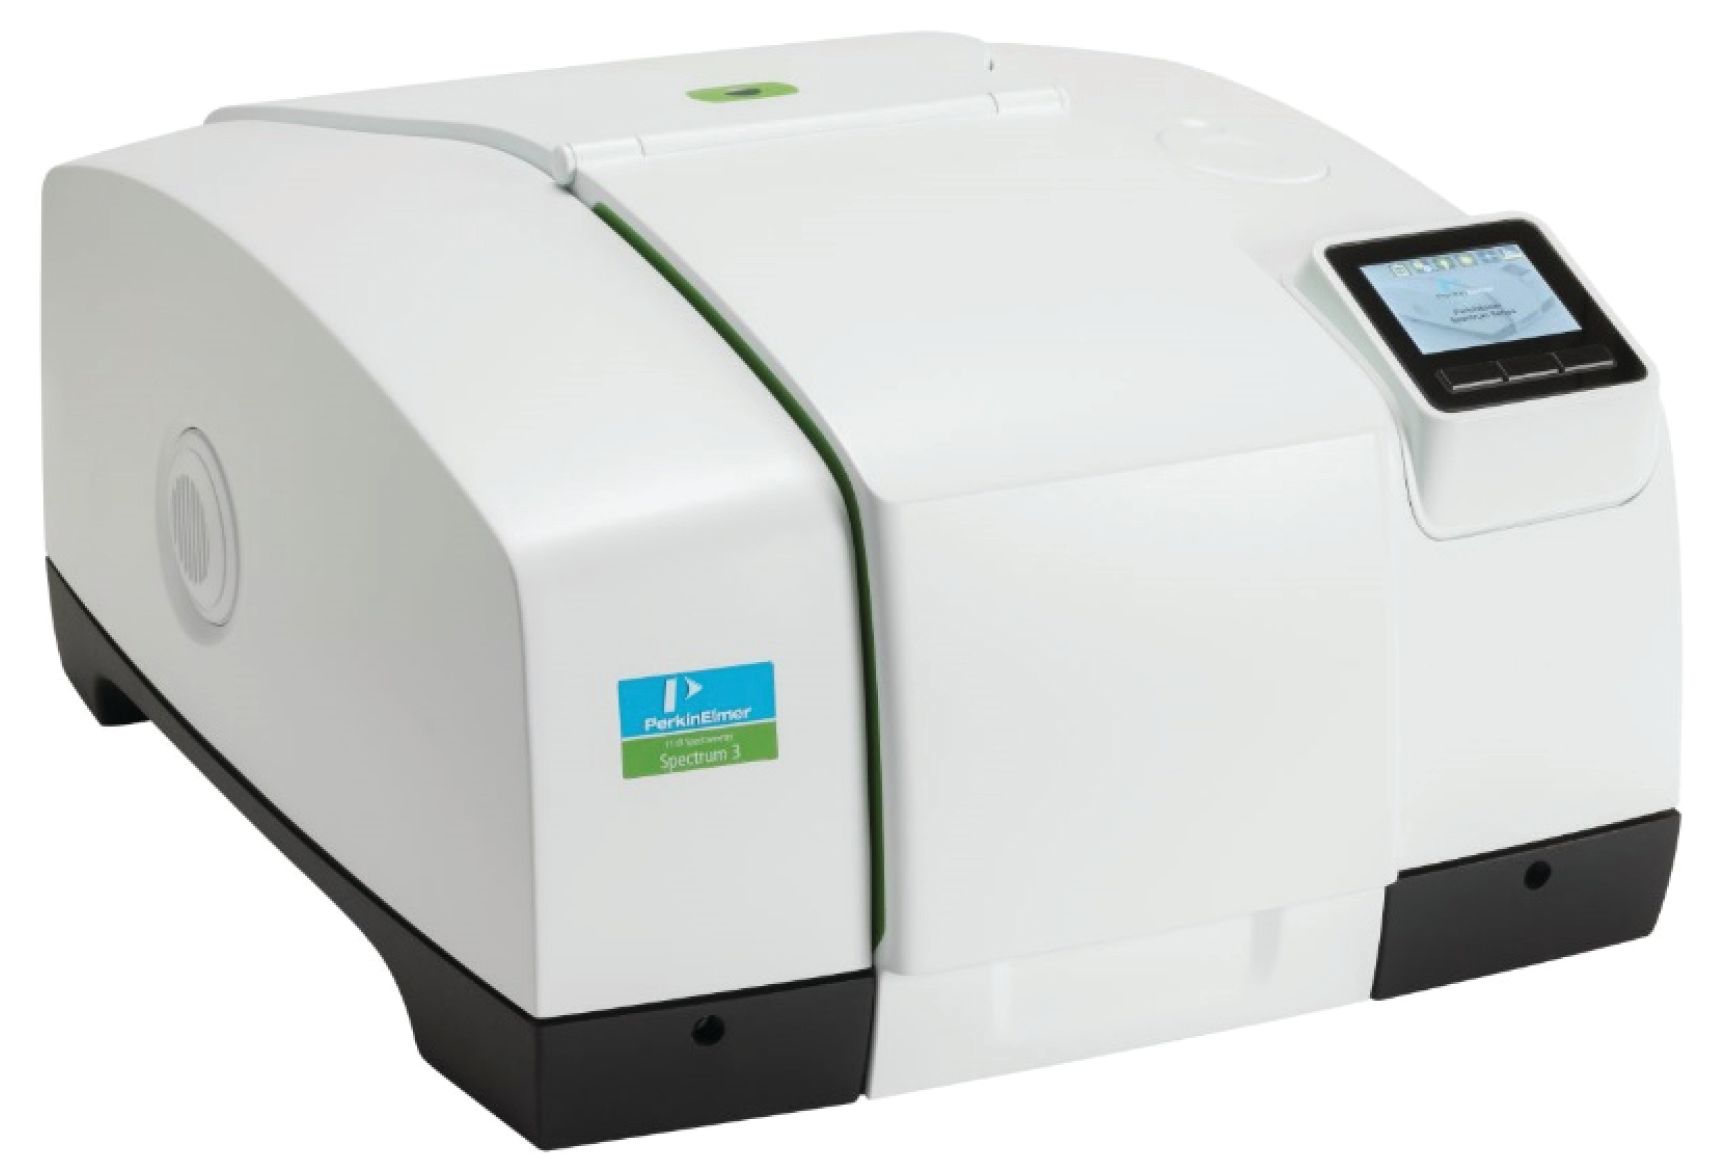
The standard procedure for the determination of the emissivity of glass involves single beam measurements of the glass sample, a reference mirror, and an empty background spectrum at 30 standard wavelengths. These wavelengths range from 5.5 μm to 50 μm (1818–200 cm-1). The selected wavelengths are specified by three international standards: EN 673 (1), EN 12898 (2), and ISO 10292 (3). The ability of the PerkinElmer Spectrum 3TM (Figure 1) to measure in multiple regions of the infrared spectrum gives the user the potential to not only determine the emissivity of glass, but investigate other properties demonstrated in the near-infrared region.
Figure 1: PerkinElmer Spectrum 3 FT-IR spectrometer.
Experimental
A 3 mm-thick sample of float glass was measured using the PerkinElmer Spectrum 3 FT-IR spectrometer with the OMT Specular Reflectance set. For each of the glass, reference mirror, and empty background, three measurements were made. The three spectral ranges used are shown in Table I.
The Spectrum 3 has the ability to scan the entire infrared range from near-infrared to far-infrared with automatic switching of optical components. The new “Merge” function in Spectrum 10™ may be used to combine spectra from different ranges to produce a single spectrum which covers the entire infrared region.
Results and Discussion
The merged spectra of the glass sample, the reference mirror, and the background spectrum are shown in Figure 2.
Figure 2: Tri-range spectra of glass (Red), a reference mirror (Blue) and no sample (Black).

The emissivity of glass is determined from the reflectance at room temperature using equation 1.
εn = 1 – Rn [1]
where εn is the emissivity at normal incidence, and Rn is the reflectance at normal incidence. The reflectance is calculated as an average of 30 spectral reflectance values measured at specified wavelengths between 5 and 50 μm (1818.8–200.0 cm-1).
First, both the glass and mirror measurements are corrected using the empty background spectrum. The reflectance is then determined at each wavelength by dividing the corrected glass value by the corrected mirror value. The overall reflectance is calculated by finding the mean of the reflectance at each of the 30 specified wavelengths. This may be carried out using the “equations” function of Spectrum 10 software or with an external data analysis application.
Using this calculation, the emissivity of the 3 mm float glass sample was found to be approximately 0.95, in agreement with the commonly accepted values for glass emissivity at room temperature (4).
In addition to emissivity calculations, the near-infrared region of the spectrum can also provide information regarding thermal transmittance. Glass designed specifically for absorbing heat will generally have a higher reflectance in the near-infrared region. For example, the standard 3 mm float glass shows low reflectance in the near-infrared region, and thus is not heat-absorbing glass.
Pharmaceutical Analysis
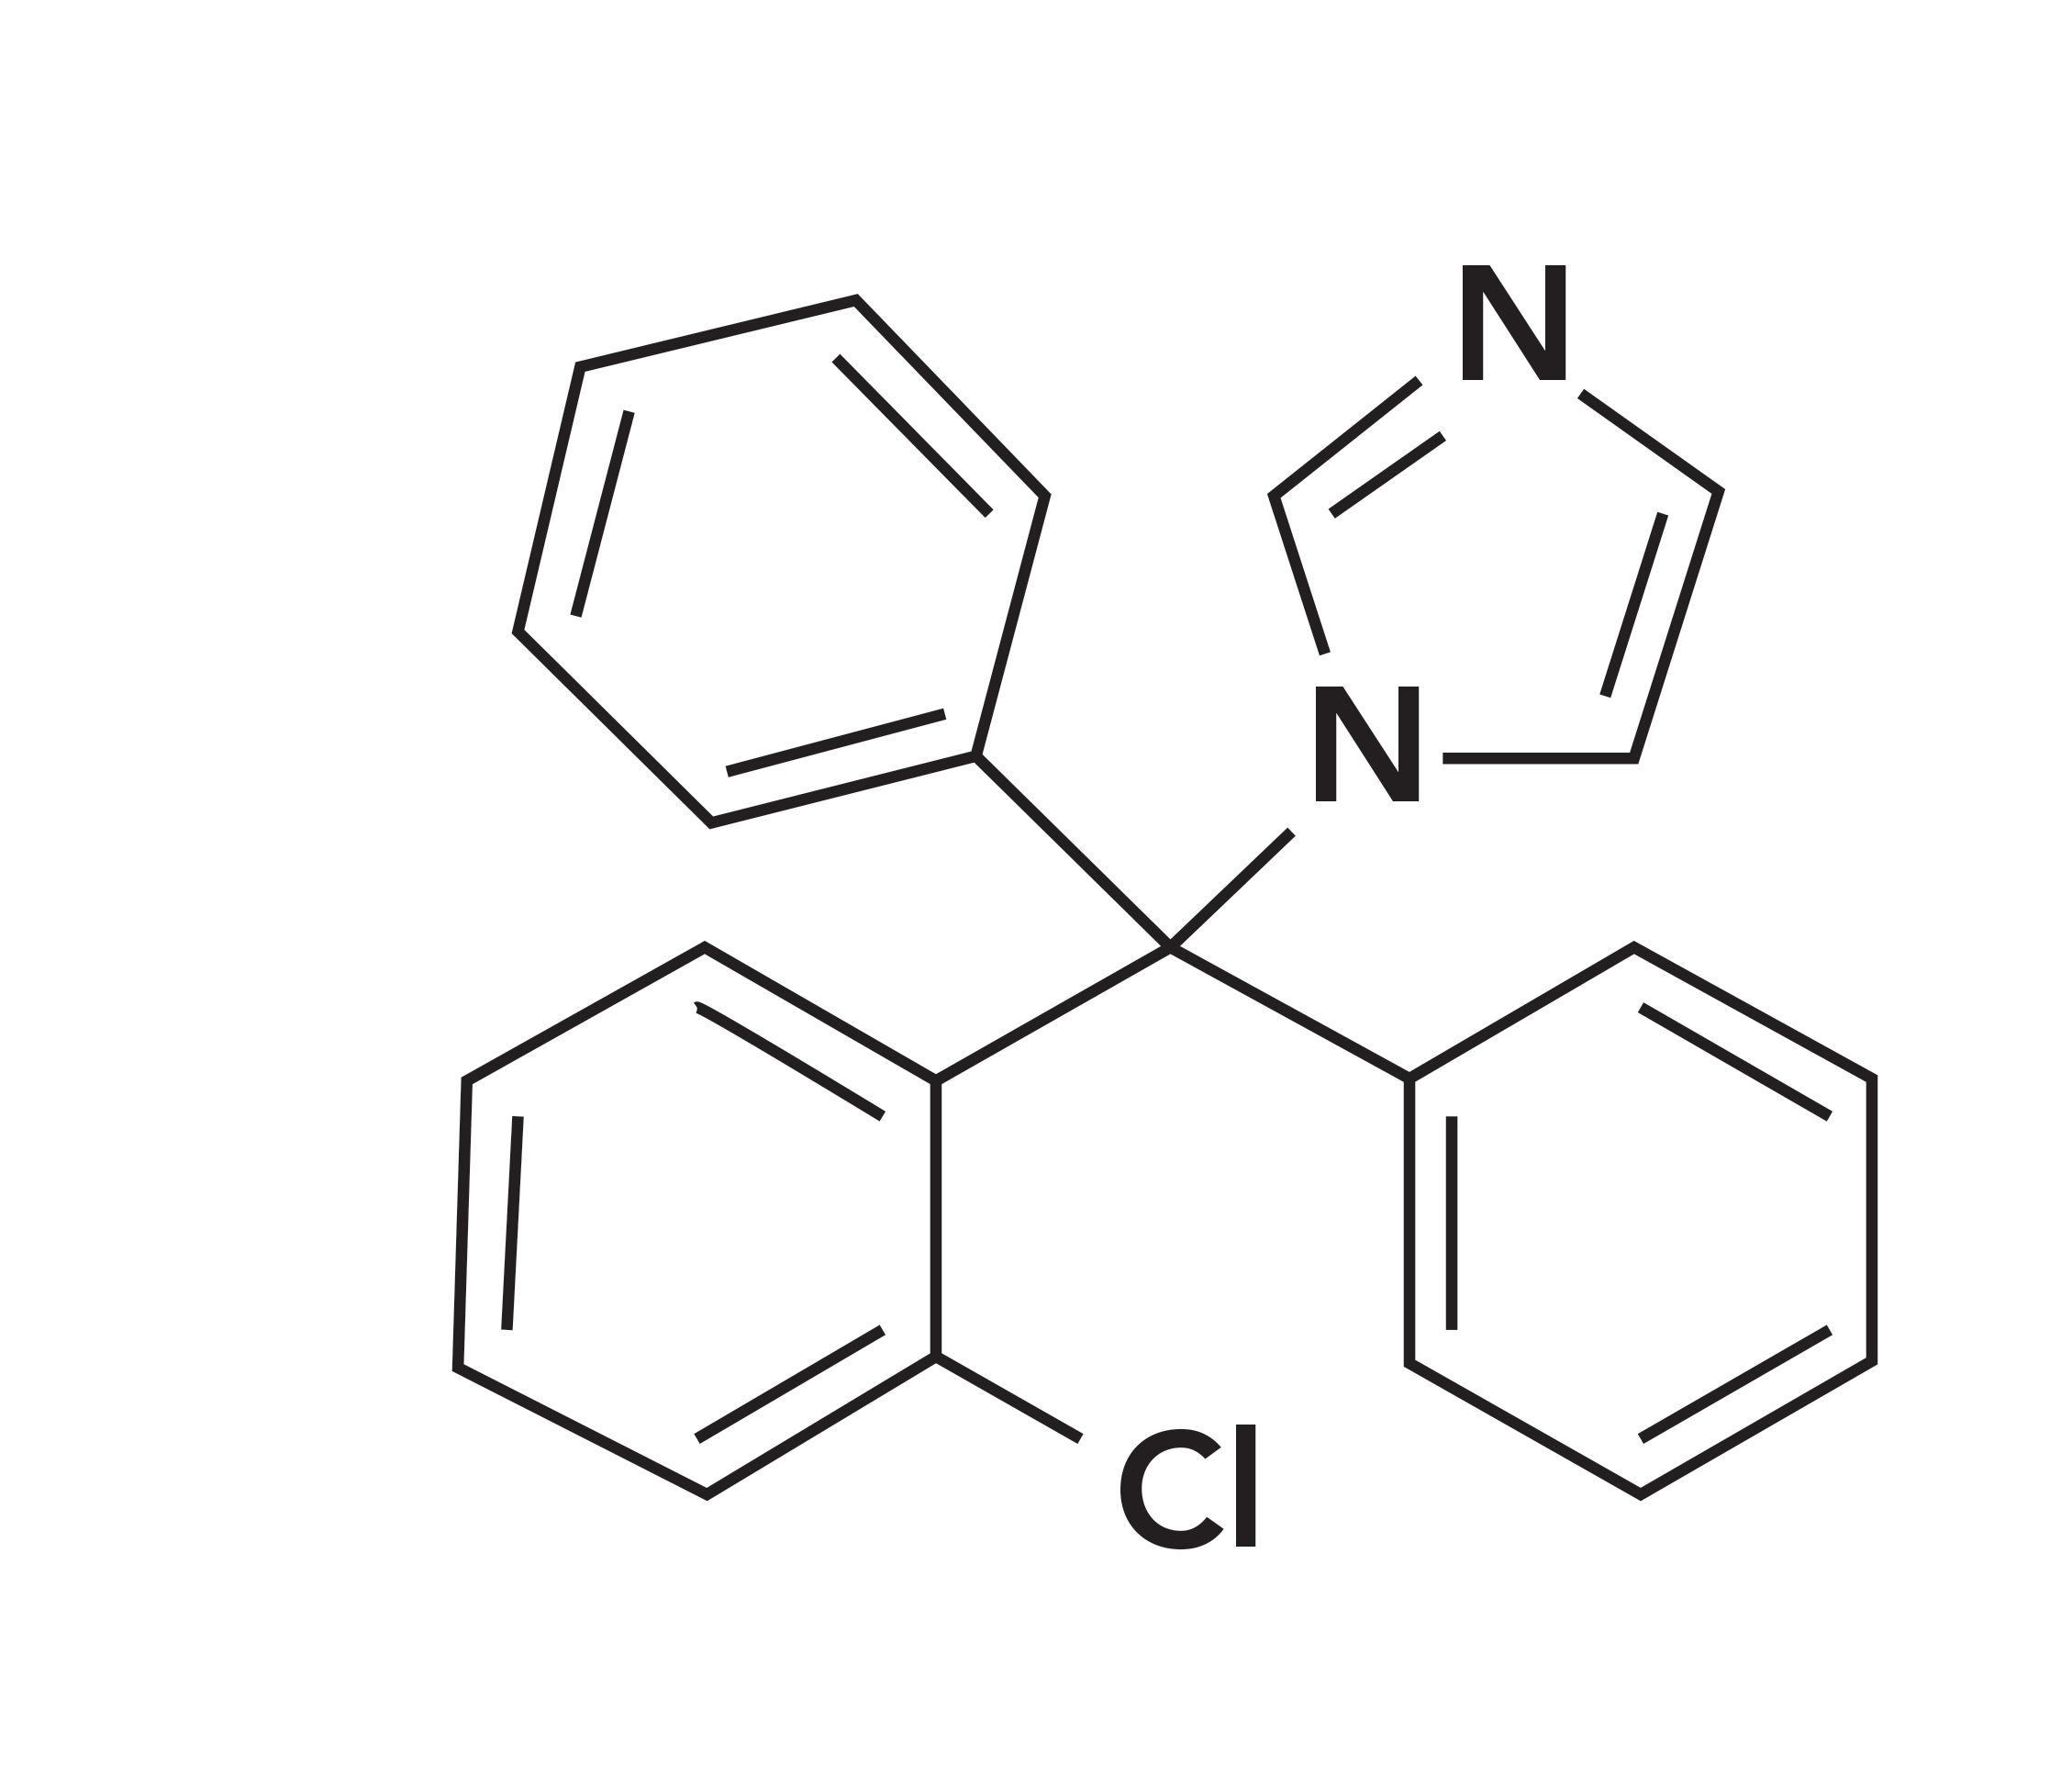
A pharmaceutical product which demonstrates strong spectral features in all three regions is clotrimazole, an anti-fungal medication, the chemical structure of which is shown in Figure 3.
Figure 3: Chemical structure of clotrimazole.
Experimental
A sample of clotrimazole was measured in all three regions of the infrared spectrum, using automatic switching of optical components. Measurements in the mid and far-infrared regions were carried out using an ATR accessory, while measurements in the near-infrared region were carried out using the NIRAII accessory.
Results and Discussion
The tri-range spectrum of clotrimazole is shown in Figure 4.
Figure 4: Tri-range spectrum of clotrimazole.
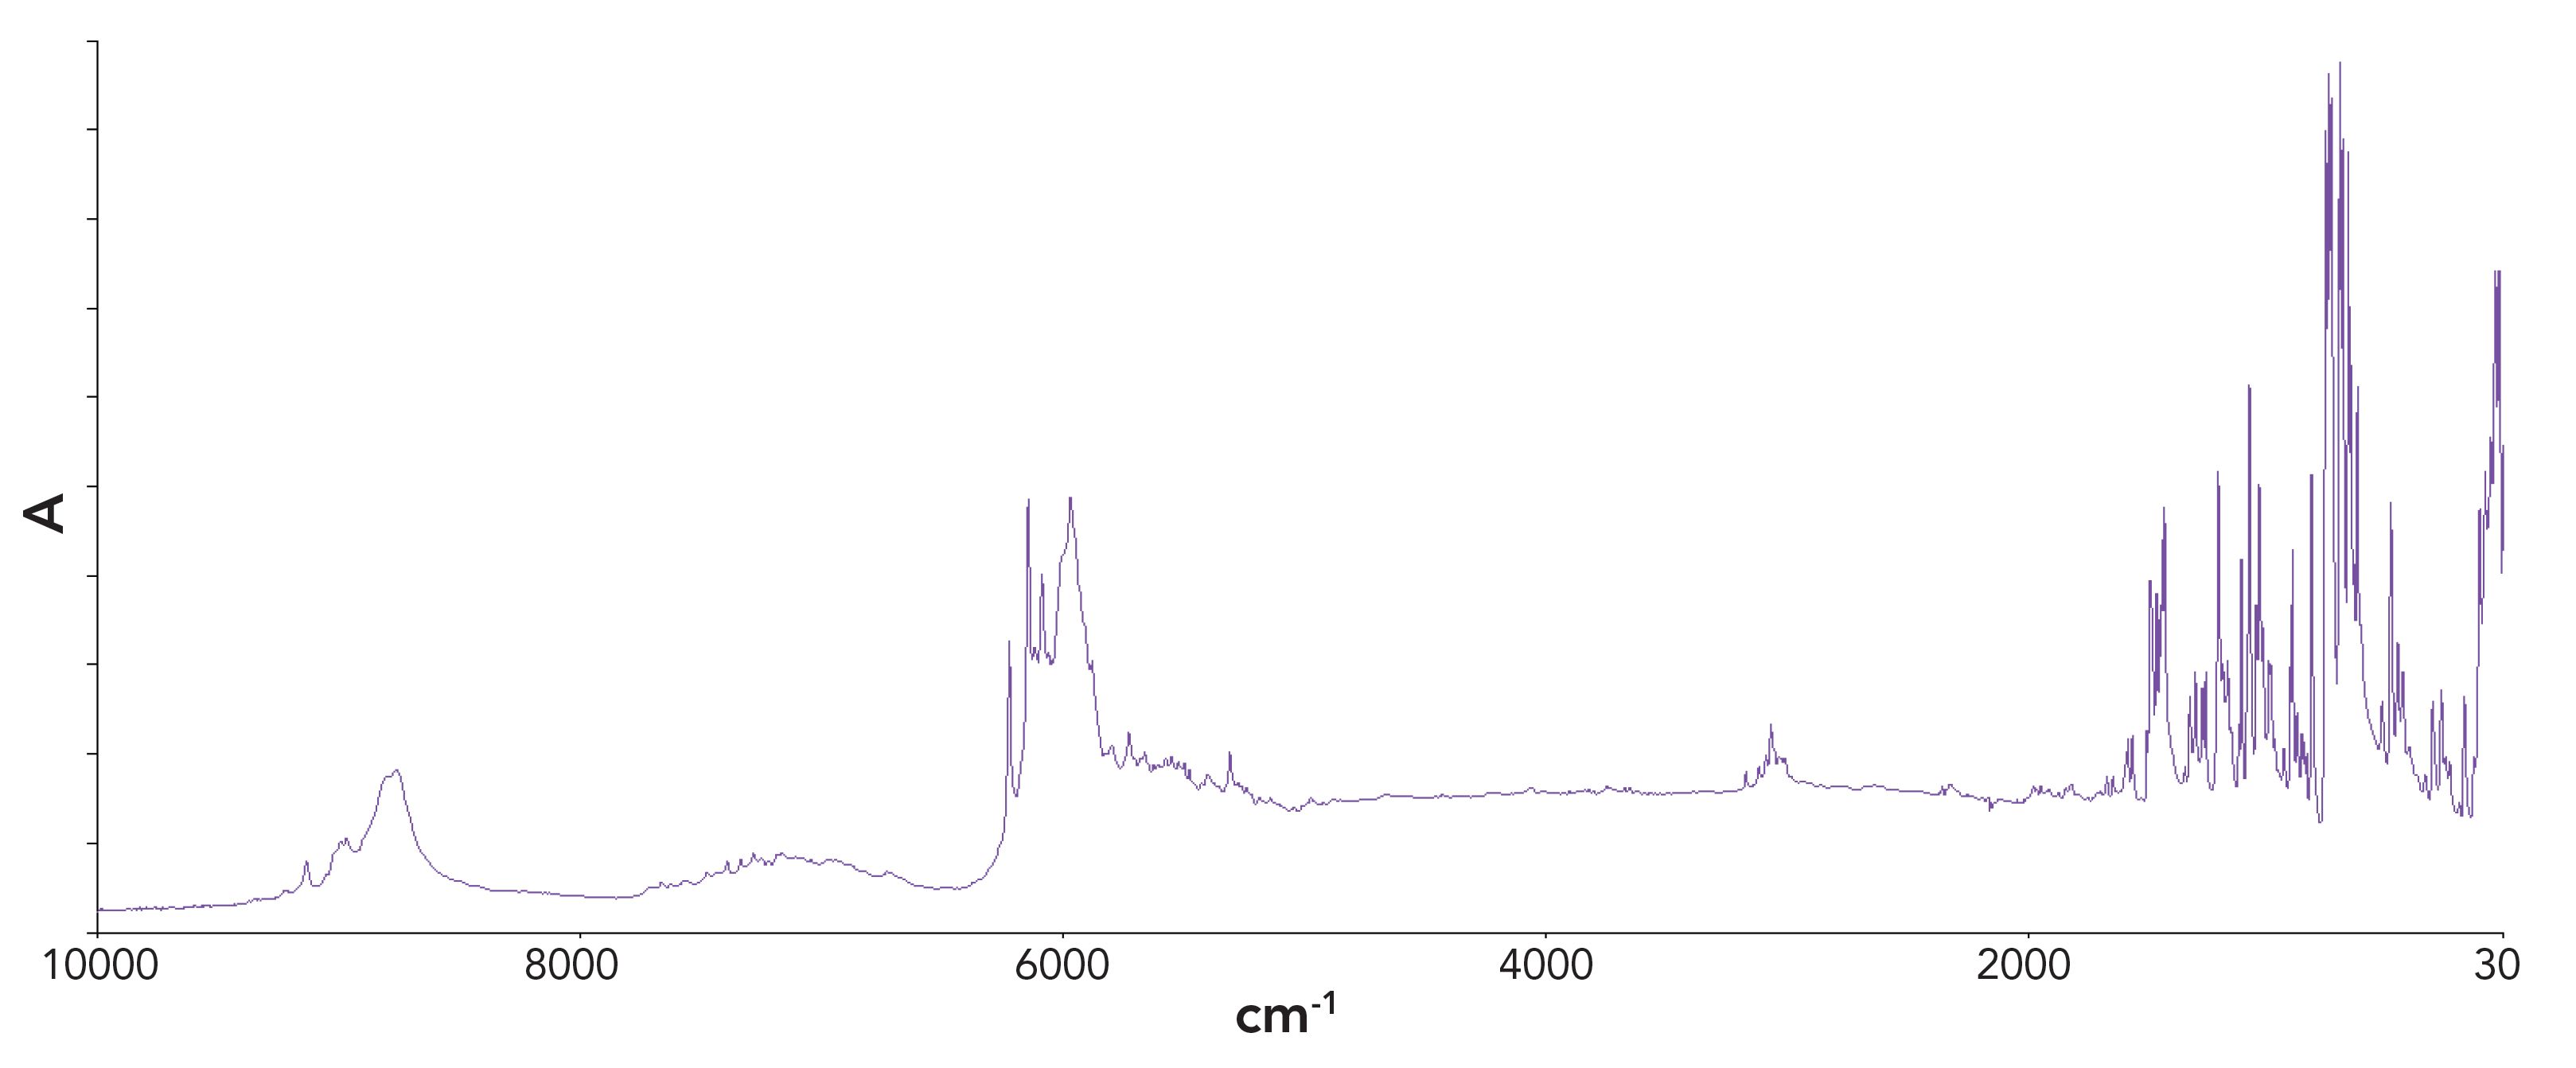
Having the ability to measure a pharmaceutical sample in all three ranges of the infrared region through Spectrum 3 allows analysts to simultaneously investigate multiple properties and obtain more significant information on the sample.
Industrial Antioxidant Analysis
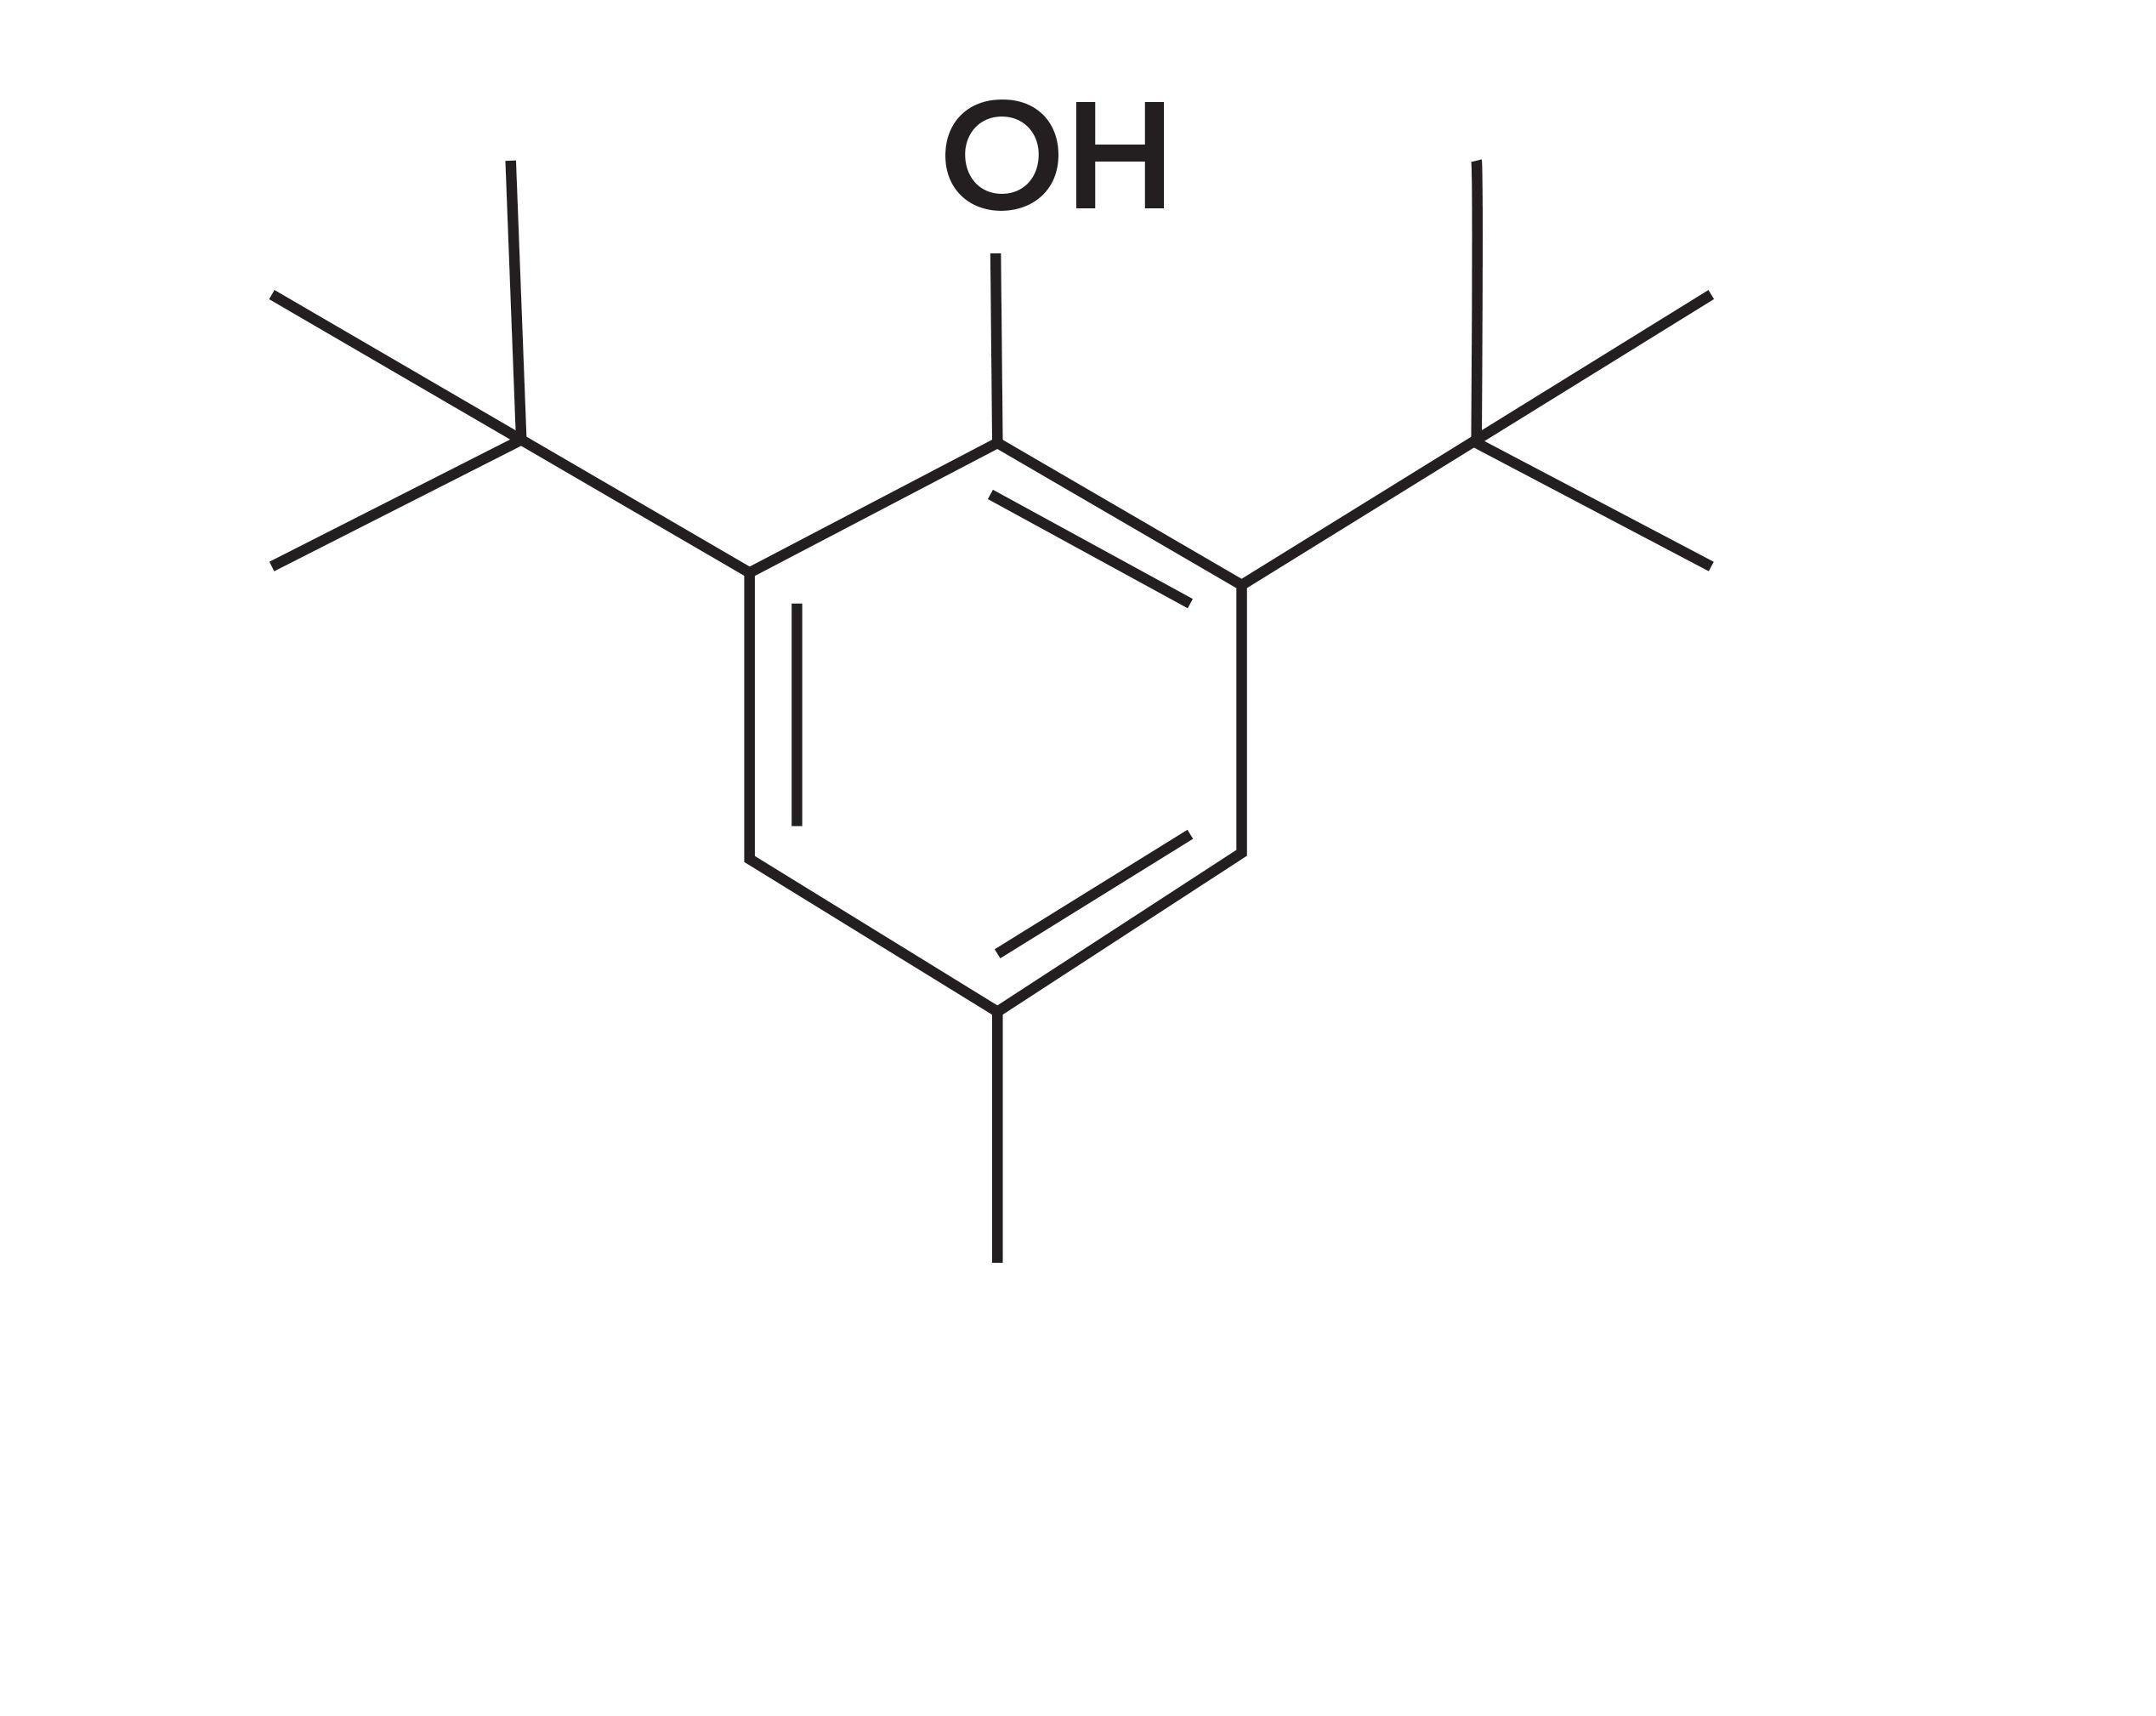
One example of a material used across a wide range of industries is butylated hydroxytoluene (BHT). This is used as an antioxidant in transformer oil, fuels, rubber, pharmaceuticals, and some food products. The chemical structure of BHT is shown in Figure 5.
Figure 5: Chemical structure of BHT.
Experimental
The PerkinElmer Spectrum was used to measure a sample of BHT in all three regions of the infrared spectrum. Measurements in the mid and far-infrared regions were carried out using an ATR accessory, while measurements in the near-infrared region were carried out using the NIRAII accessory.
Results
A tri-range spectrum of BHT is shown in Figure 6.
Figure 6: Tri-range spectrum of BHT.
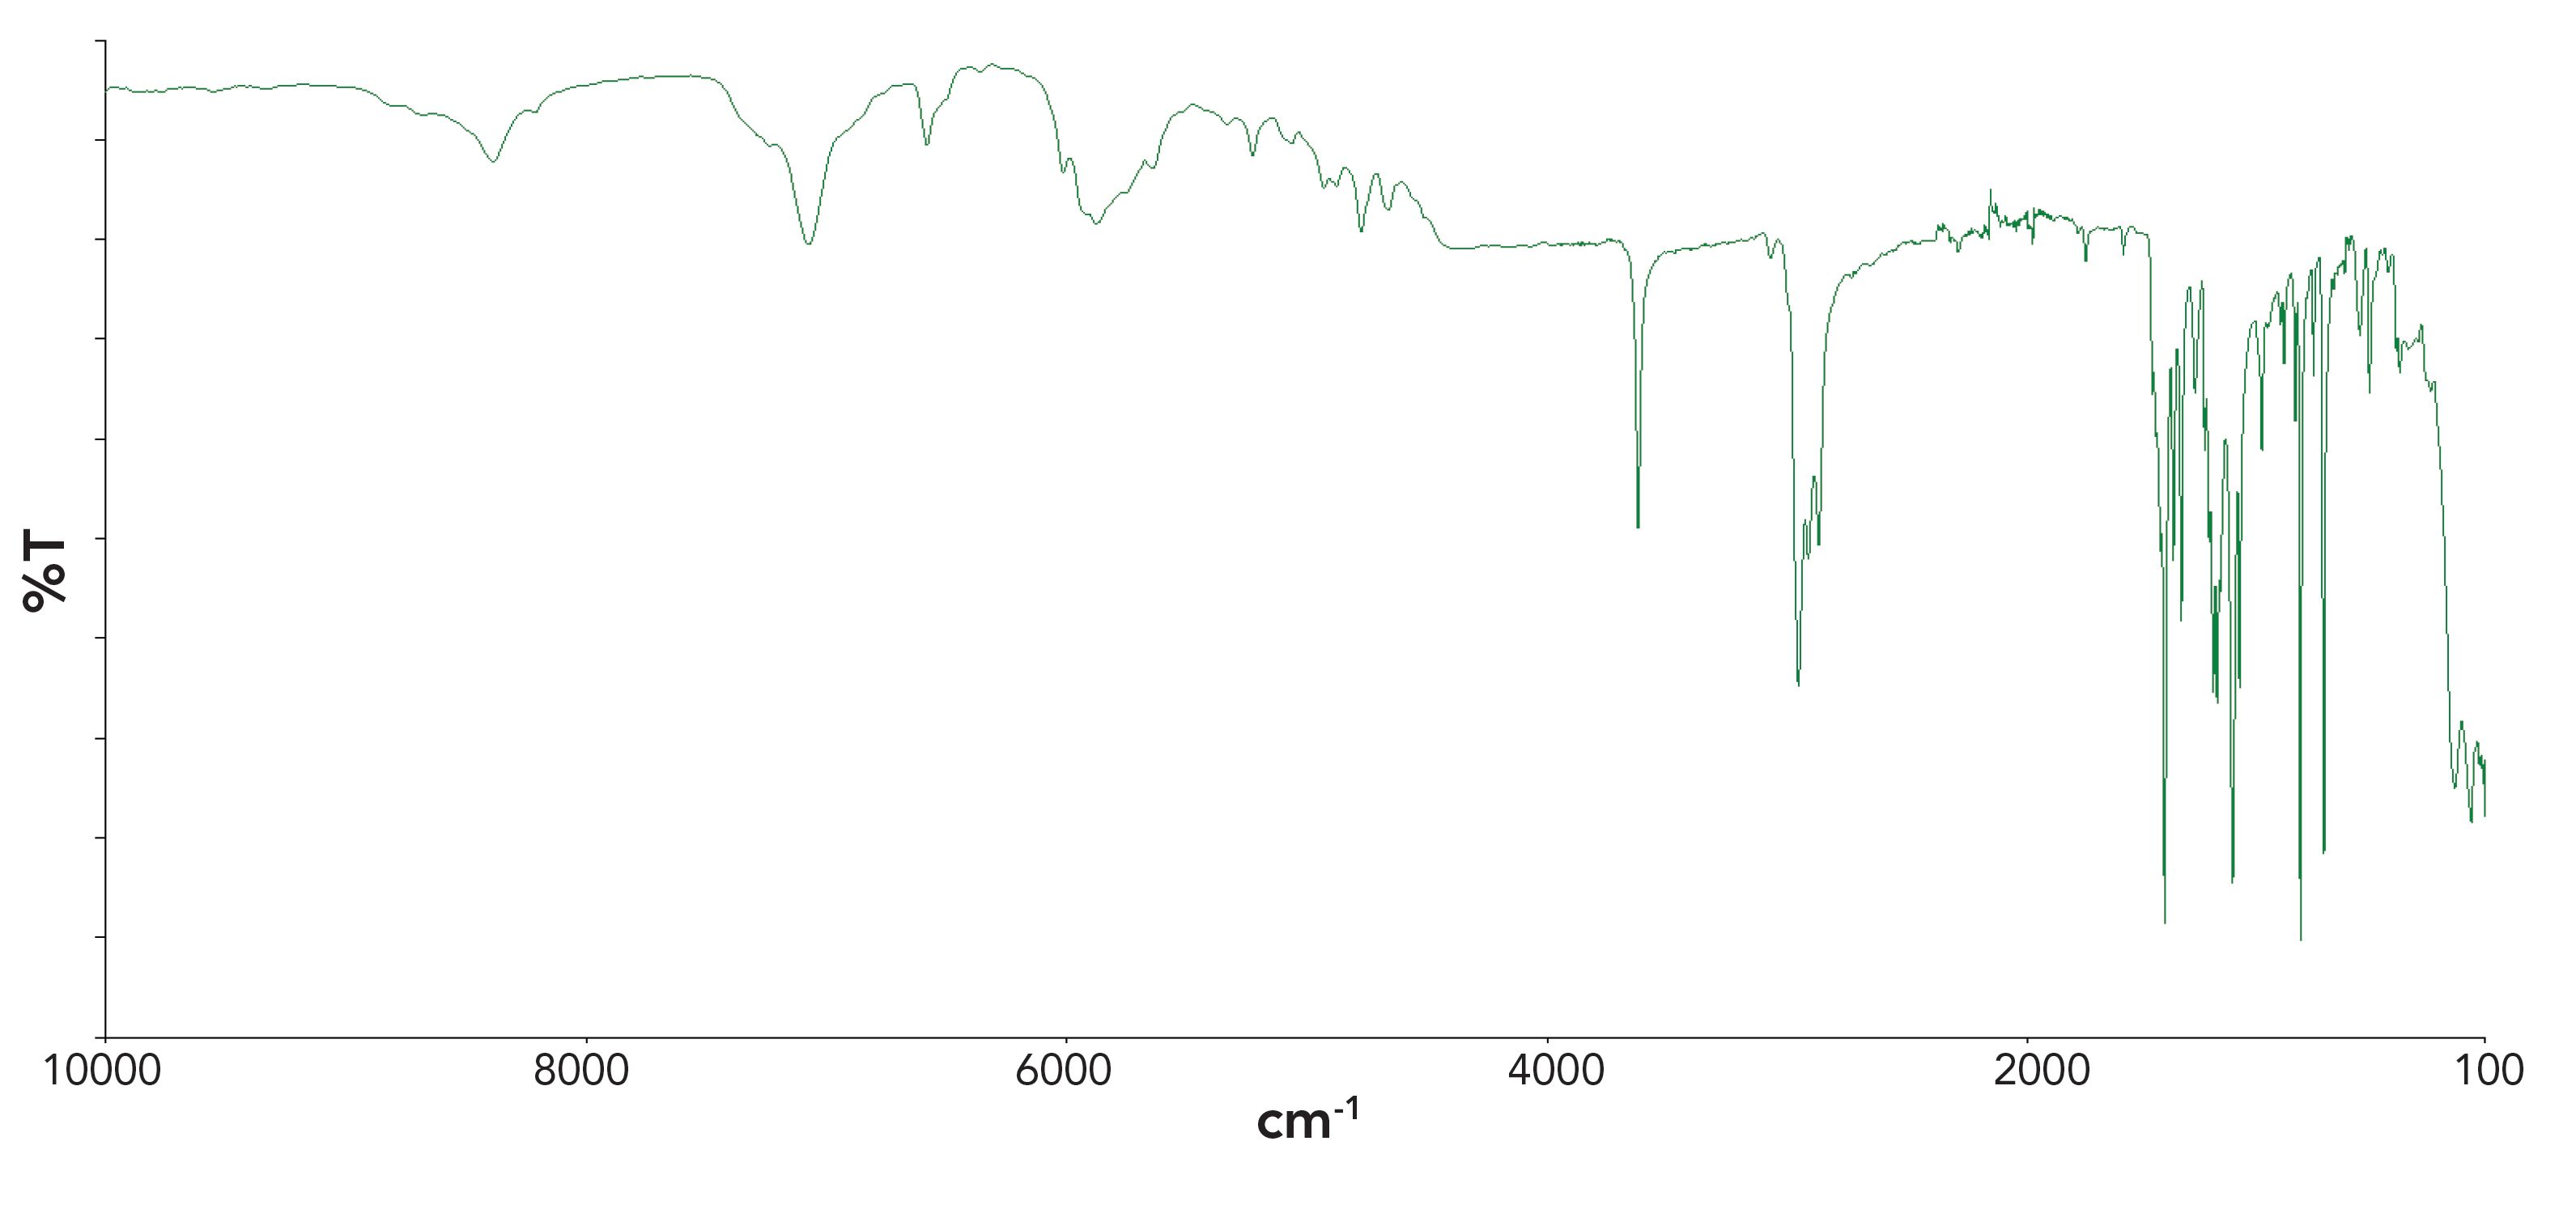
As with other materials, different areas of the infrared spectrum of BHT serve different purposes. For example, the sharp peak at around 3700 cm-1 has been used for quantitative determination of BHT in food samples such as edible oils (5).
One previously mentioned use of BHT is as an antioxidant in rubber and other polymers. Far-infrared provides an incredibly useful tool for measurement of polymers due to strong intermolecular vibrations and weak intramolecular vibrations falling in this range. This region has been used to successfully quantify BHT as an additive in polymer samples as lattice vibrations of some polymers fall between 50–100 cm-1 (6).
References
- European Standard 673:2011.
- European Standard 12898:2019.
- ISO Standard 10292 (1994).
- R. Gardon, J. Am. Ceram. Soc. 39, 278–87 (1956).
- W. Ammawath, Y.B. Che Man, R.B. Abdul Rahman, B.S. Baharin, J. Am. Oil Chem. Soc.. 83,187–191, (2006).
- T. Ogishima, C. Kuroda, N. Hirai, Y. Ohki, Polym. Test. 76,10–18 (2019).
PerkinElmer, Inc.
940 Winter Street, Waltham, MA 02451
Tel. (781) 663-6900
Website: www.perkinelmer.com
New Study Reveals Insights into Phenol’s Behavior in Ice
April 16th 2025A new study published in Spectrochimica Acta Part A by Dominik Heger and colleagues at Masaryk University reveals that phenol's photophysical properties change significantly when frozen, potentially enabling its breakdown by sunlight in icy environments.
Advanced Raman Spectroscopy Method Boosts Precision in Drug Component Detection
April 7th 2025Researchers in China have developed a rapid, non-destructive Raman spectroscopy method that accurately detects active components in complex drug formulations by combining advanced algorithms to eliminate noise and fluorescence interference.