Using Handheld Raman Spectroscopy Equipped with Orbital Raster Technology for Field Detection of Cocaine and its Impurities in Fingernails
Fingernails can accumulate drugs as a result of chronic exposure. This work employed Raman spectroscopy for detecting cocaine hydrochloride (HCl) and its impurities within fingernails, utilizing orbital raster scanning (ORS) technology, where the laser beam hits multiple positions within the sample. Doing so maintained sensitivity and ensured that more of each sample’s components were represented. Fingernails were spiked with powder and solution forms of cocaine HCl and its impurities, including benzocaine HCl, levamisole HCl, lidocaine HCl, and procaine HCl. The strong Raman scattering observed for these substances indicated a high drug accumulation in the fingernails. Key cocaine HCl bands were seen at 848, 874, and 898 cm-1 (C-C stretching-tropane ring), 1004 cm-1 (symmetric stretching-aromatic ring), 1278 cm-1 (C-N stretching), 1453 cm-1 (asymmetric CH3 deformation), and 1605 and 1712 cm-1 (C=C and C=O stretching). Principal components analysis (PCA) confirmed that 90% (nails spiked with drug powders) and 77.2% (nails spiked with drug solutions) were accounted for in the variance among the data. The findings showed that Raman spectroscopy identified the presence of cocaine HCl and its impurities within fingernails.
The pervasive use of illicit drugs in modern society is a phenomenon that has never occurred in the history of humanity (1). Approximately 275 million individuals have used illicit drugs in 2021, which is an increase of 22% from 2010. It is estimated that projected population growth for 2030 translates into a possible increase of 11% in the percentage of illicit drug users worldwide, with a far higher impact in low-income nations rather than high-income nations. Drug usage has resulted in numerous severe problems, especially addiction (2). Drug addiction has caused young individuals to drop out of school and has made it difficult for parents to care for their children. It undermines ambition, drags individuals into poverty and crime, and wrecks lives. Furthermore, the illicit drug trade hinders social and economic advancement, and it can cause serious danger to both global security and stability in some parts of the world. Within the illegal drug market, cocaine has been one of the most common substances with an estimated 2,000 metric tons produced per year (3). Cocaine is a stimulant that exerts its mechanism of action by producing a build-up of dopamine between synapses. Three main forms of cocaine are available: free base, “crack” rocks, and hydrochloride (HCl) powder (4,5).
Many investigating authorities across the world routinely seize cocaine and take judicial actions. Forensic scientists and law enforcement organizations require rapid, accurate, and adaptable techniques of drug detection to combat drugs addiction. Despite the existence of numerous detection techniques, including immunoassays (6), capillary electrophoresis (7), deoxyribonucleic acid (DNA) aptameric sensors (8), and nuclear magnetic resonance (NMR) spectroscopy (9), hyphenated methods are currently the industry standard for analyzing illicit drugs in fingernails and other matrices. Of the hyphenated techniques, gas chromatography–mass spectrometry (GC–MS) and liquid chromatography–MS (LC–MS) are often used in these analyses (10). Both GC–MS and LC–MS are destructive and time-consuming, involving the use of chemicals that can be harmful to both the operator and the environment despite their great sensitivity and molecular specificity. Hence, the use of vibrational techniques, such as Fourier transform infrared (FT-IR) (11) and Raman spectroscopy (12), is considered as a reliable alternative because these methods offer a portable, quick, non-destructive, and cost-effective solution for drug analysis. In particular, Raman spectroscopy is a versatile technique that is applied to analyze different types of forensic samples that cannot be determined by other spectroscopic methods, such as IR spectroscopy (13). Raman spectroscopy is used for both qualitative and quantitative purposes (14,15). Numerous drug classes, including amphetamines, date rape drugs like ketamine, and designer drugs, have been studied using Raman spectroscopy (16). Raman is used because it has better chemical specificity than IR (17). The chemical specificity offers advantages of Raman in detecting physical and chemical differences between isomers and analogues of the same drug (18). Recent developments in data analysis, portable Raman spectrometers, and new excitation wavelengths offer exciting new opportunities for Raman spectroscopy applications in the detection and quantification of drugs of abuse, including investigations carried out immediately at the crime scene. Raman spectroscopy is regarded as a “Category A” technology, offering the maximum level of selectivity through structural information, according to worldwide recommendations given by the Scientific Working Group on Drugs (SWGDRUG) Core Committee (19). An emerging technique for the quick onsite detection of illicit drugs is handheld Raman spectroscopy because it offers additional features over conventional Raman in safety and security where the operator does not need to touch the sample that can be measured inside original packaging (20–23). The aim of this study is to demonstrate the application of rapid, portable methods for the quantitative detection of cocaine HCl and its impurities in human fingernails using handheld Raman spectroscopy in combination with chemometrics.
Materials and Methods
This work comprised the Raman spectroscopic analysis of 20 sets (11 males and nine females) of fingernails of adults of two ethnicities. Fingernail clippings of 1–2 mm were collected and measured through glass vials. No intervention was made by the researchers during the collection of the fingernail clippings, considering this procedure as an everyday activity. Ethical approval was provided from two institutions: Liverpool John Moores University (PBS/2021/22/04) and the Lebanese University in Lebanon (2022-0104). Five sets of fingernail clippings were then spiked with one of the following drugs or drug impurities: benzocaine (BEN); cocaine HCl (COC); levamisole HCl (LEV); lidocaine HCl (LID); and procaine HCl (PRO). After six weeks of treatment, the spiked nails were measured using a handheld Metrohm Mira XTR Raman spectrometer equipped with a 785-nm laser wavelength, and less than 100 mW of laser output power was used. Raman spectra were collected over a wavenumber range of 400–2300 cm-1 with a spectral resolution of 10 cm-1. The laser beam of the spectrometer used orbital raster scanning (ORS) technology where the beam sampled multiple positions on the sample.
Reference samples of the chosen drugs and impurities were measured through glass vials and included in the instrumental library. The in-built spectral algorithm searched for matches between the reference samples and spiked fingernail clipping samples. Matches were shown for the chosen drug and its impurities and highlighted the key spectral features between the drug and impurities. Offline analysis was also carried out in Matlab 2022b software, whereby the spectra of the drug and impurities were interpreted based on the spectral quality, functional groups, and similarities among the substances identified through the principal component analysis (PCA) algorithm. The spectral quality was evaluated for the measured drug and drug impurities. For PCA, the Raman spectra were investigated for patterns among their PC scores. False negatives were observed when a drug or impurity score was not grouped with the scores of the same drug or impurity and where false positives were seen when a drug or impurity score was clustered with scores of a different drug or impurity.
Results and Discussion
The measured nails consisted of 20 sets of fingernails obtained from different individuals within the age group of 18–64 years old. The male:female ratio of these individuals was 11:9, and they were of (two) ethnicities: white British and Arab. Each nail set consisted of 7–10 fingernail clippings, and the dimension of each fingernail clipping was 1–2 mm. Of the 20 sets, five were spiked with BEN, COC, LEV, LID, and PRO, respectively. Two types of spiking were made: powder form of the drug (3–5 nails per set) and liquid form (3–5 nails per set) of the drug. A minimum of 20 spectra were collected for each nail set (whether plain or spiked).
Raman Activity of Drugs
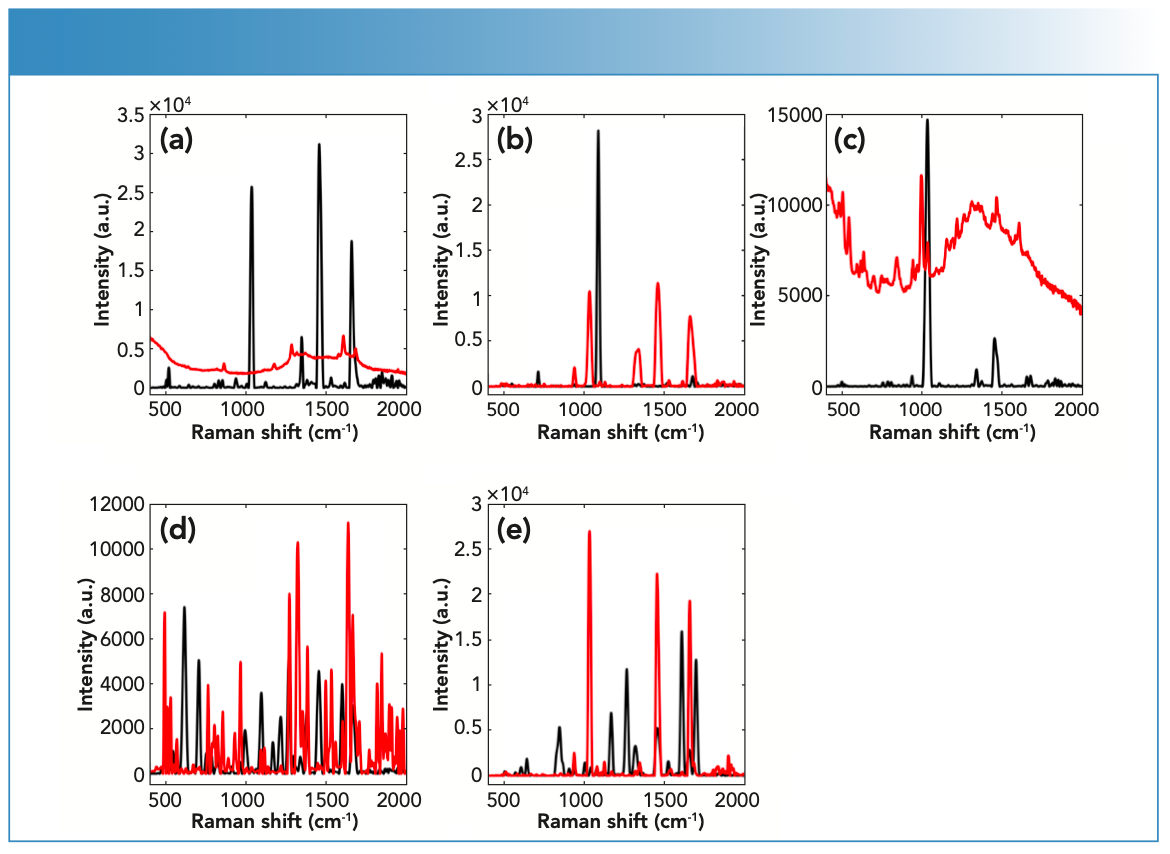
Raman spectroscopy was able to detect COC and its impurities in fingernails six weeks post-spiking (Figure 1). In this respect, nail samples showed strong spectral quality with a maximum intensity up to 30,000 a.u.
FIGURE 1: Raman spectra of (a) BEN, (b) COC HCl, (c) LEV HCl, (d) LID HCl, and (e) PRO HCl measured using the handheld Raman spectrometer equipped with a 785-nm laser wavelength; powder (black) and liquid (red) spiked spectra.
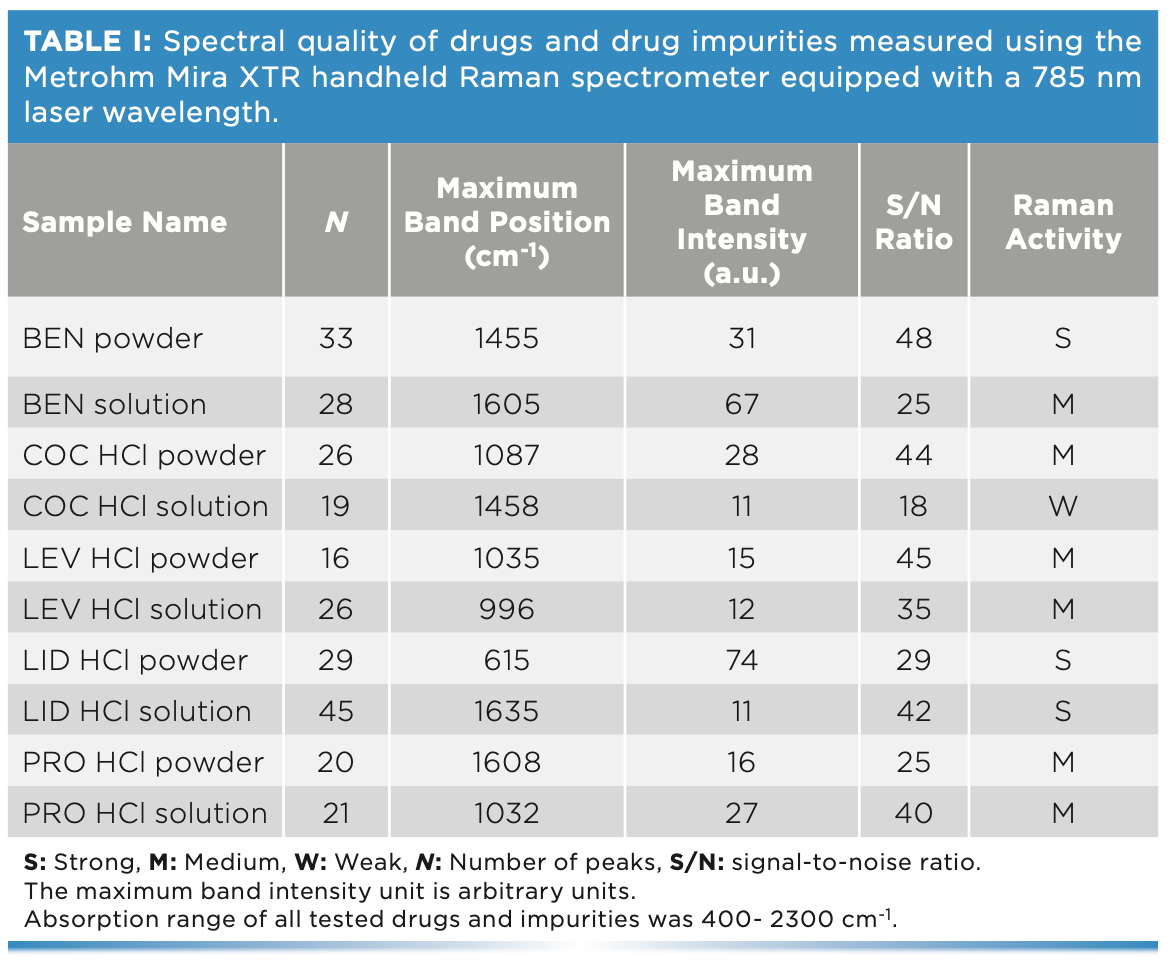
Raman activity of the chosen drug and impurities was determined through investigating their Raman spectral quality (Table I). In turn, Raman spectra were evaluated using the following parameters: the number of peaks (N), the maximum peak position and intensity, the wavenumber range, and the signal-to-noise (S/N) ratio. In this respect, the BEN powder, LID powder, and LID solution showed strong Raman activity with N (29–45), maximum intensity (11–74 a.u.), and S/N (33–42). The BEN liquid, COC HCl powder, LEV HCl powder, LEV HCL liquid, PRO HCl powder, and PRO HCl liquid displayed medium Raman activity with N (16–28), maximum intensity (12–66 a.u.), and S/N (20–29). COC HCl liquid showed low Raman activity with N (19), maximum intensity (28 a.u.), and S/N (25).
Effect of Physical Form on Raman Activity
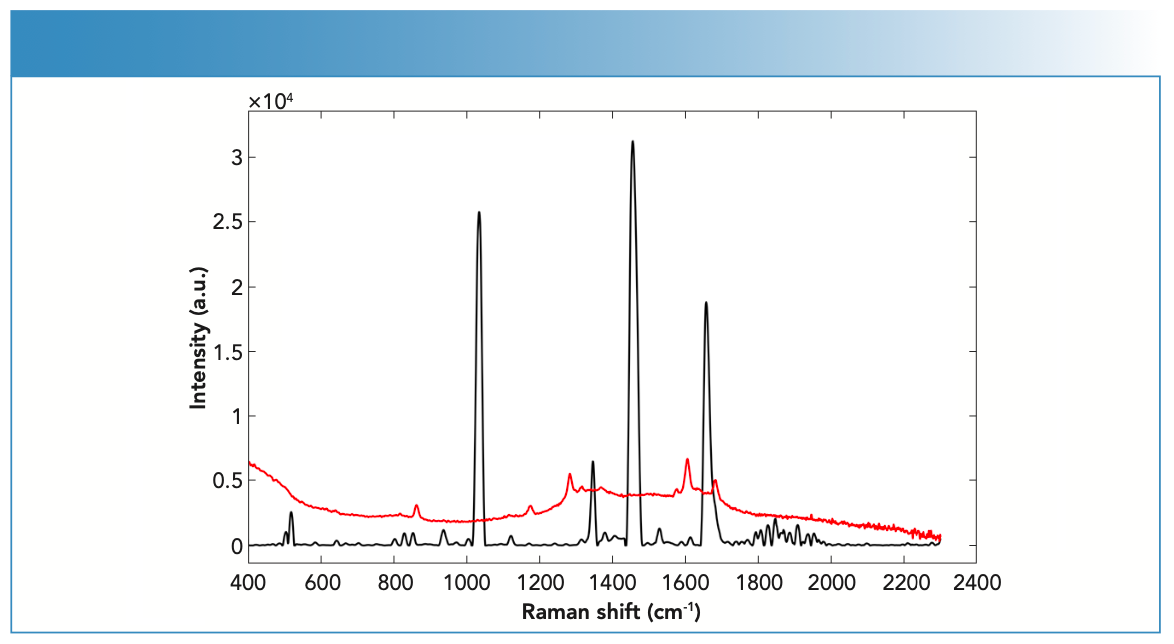
Key variations were seen in the Raman activity between drugs in solid versus liquid forms (Figure 2). The degree of variation depended on the type of drug being analyzed because some drugs showed no difference in Raman activity in their solid forms compared to their liquid forms, which was the case for LEV and PRO; both showed medium Raman activity in their solid and liquid forms. LID also showed strong Raman activity in both its solid and liquid form. Some drugs, such as BEN and COC, showed differences in Raman activity between their solid and liquid forms. In this respect, BEN and COC showed stronger Raman activity in their solid form compared to their liquid forms (that was medium). Variations between drugs and impurities in their solid and liquid forms suggested that physical properties of the substance influenced their Raman activity.
FIGURE 2: Raman spectra of fingernails spiked with BEN powder (black) and BEN liquid (red) forms measured using the handheld Raman spectrometer equipped with 785-nm laser wavelength.
Raman Activity of Fingernails
Previous work has reported the Raman activity of key endogenous compounds such as carbohydrates, lipids, and proteins (24). Figure 3 shows the Raman spectra of endogenous compounds. Carbohydrates have been associated with the bands 1471 (CH2 scissoring) and 808 cm-1 (C-C stretching) (25). The amino acids cystine and cysteine have been linked to C-S stretching vibrations that showed Raman scattering at 623 and 643 cm-1 (26). These amino acids make up the disulfide bridges related to the microstructure of fingernails. Disulfide cross-linking is determinant for physical and mechanical properties of a fingernail’s keratin, and it can often be used to identify disease or nail degradation such as diabetes (27). For example, bands at 830 and 850 cm-1 corresponded to the presence of denatured tyrosine (amino acid) in keratin (26), which is advantageous for establishing patterns between healthy, diseased, or aged fingernails. The strong C-C stretching band at 935 cm-1 was associated with the α-helix of the fingernail’s nail plate (28). Proteins have also corresponded to S-S stretching bands at 509–514 cm-1. CH2 and CH3 scissoring bands at 1447–1448 cm-1 were representative of lipids and proteins, respectively (24).
FIGURE 3: Raman spectra of a fingernail clipping using the handheld Raman spectrometer equipped with 785-nm laser wavelength.
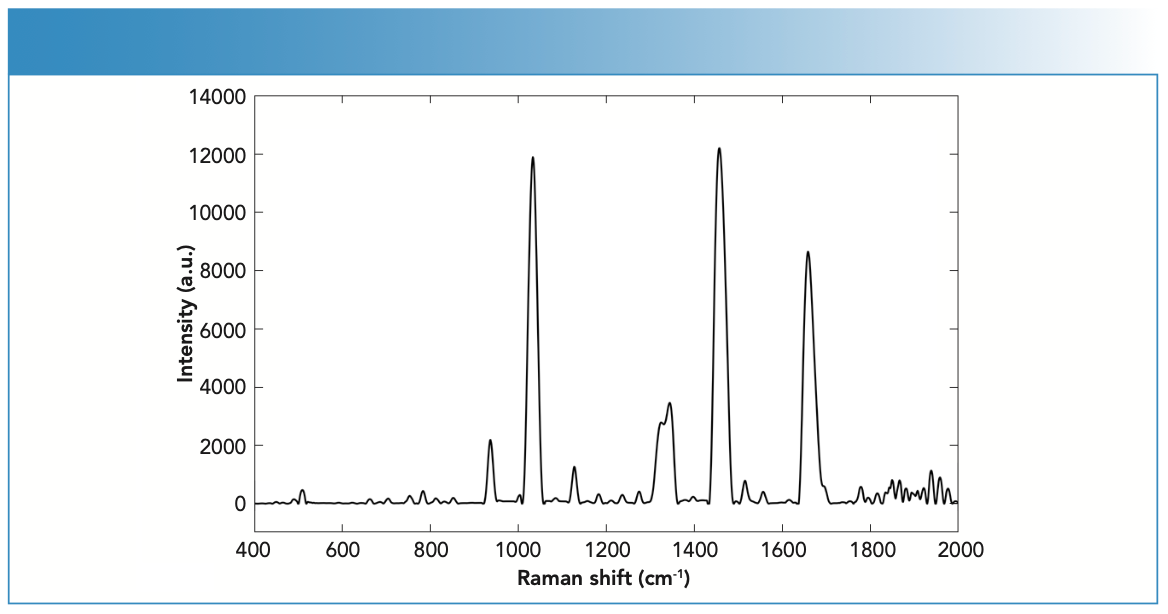
The Raman activity of fingernails was also evaluated using the aforementioned parameters. The tested fingernails (N = 20) showed strong Raman activity with 38 peaks and a S/N ratio of 56. Fingernails also demonstrated a maximum peak position of 1457 cm-1 and 12,000 a.u.
Raman Scattering of Fingernails
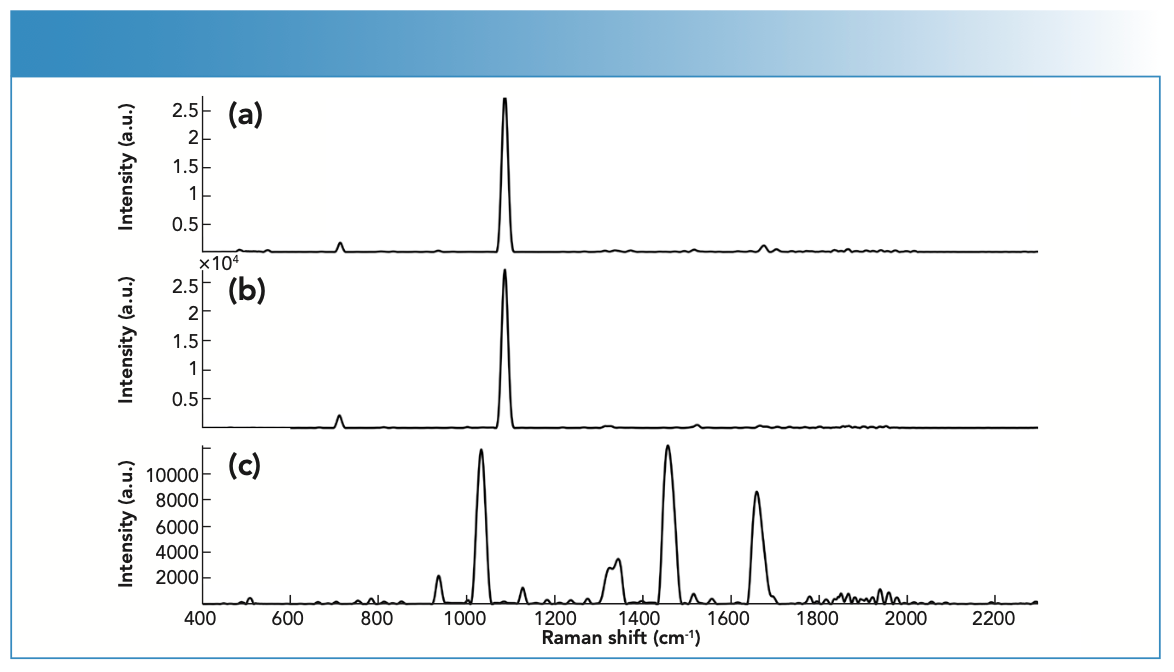
The Raman activity of fingernails impacted the level of Raman scattering, and this was apparent in terms of the number of bands and the Raman activity of the fingernail clippings. It is important to mention the incorporation of ORS technology and how this improved the representation of the sample’s identify and composition. Traditional Raman methods incorporated a small interrogation area, whereas ORS technology ensured a larger interrogation area. The ORS technique included a tightly focused laser beam scan over a large sample area, which provided high intensity spectra and resolution, resolving previous limitations of conventional Raman spectroscopy (29). Thus, highly complex structures could be analyzed. The ORS technique ensured that all components within the fingernail clipping were collected, and a high spectral resolution was maintained. Hence, Raman spectra of fingernails were highly representative of the heterogeneous components found within fingernails, such as BEN, COC HCl, LEV HCl, LID HCl, and PRO HCl (Figure 4).
FIGURE 4: Raman spectra of (a) fingernail clipping spiked with cocaine powder, specifically cocaine HCl powder, (b) fingernail clipping spiked with cocaine HCl powder, and (c) unspiked fingernail clipping measured using the handheld Raman spectrometer.
Raman Scattering of Drugs in Spiked Nails
In the case of COC, the physical properties of the drug influenced its Raman scattering. For example, COC powder showed medium Raman scattering, whereas the COC solution showed weak Raman scattering. However, some drugs, such as LID, were unaffected by physical properties and demonstrated strong Raman scattering in both the powder and liquid forms. BEN was also a strong scattering regardless of the physical state. LEV and PRO showed medium scattering in both their powder and liquid forms.
Detection of Drugs in Fingernails
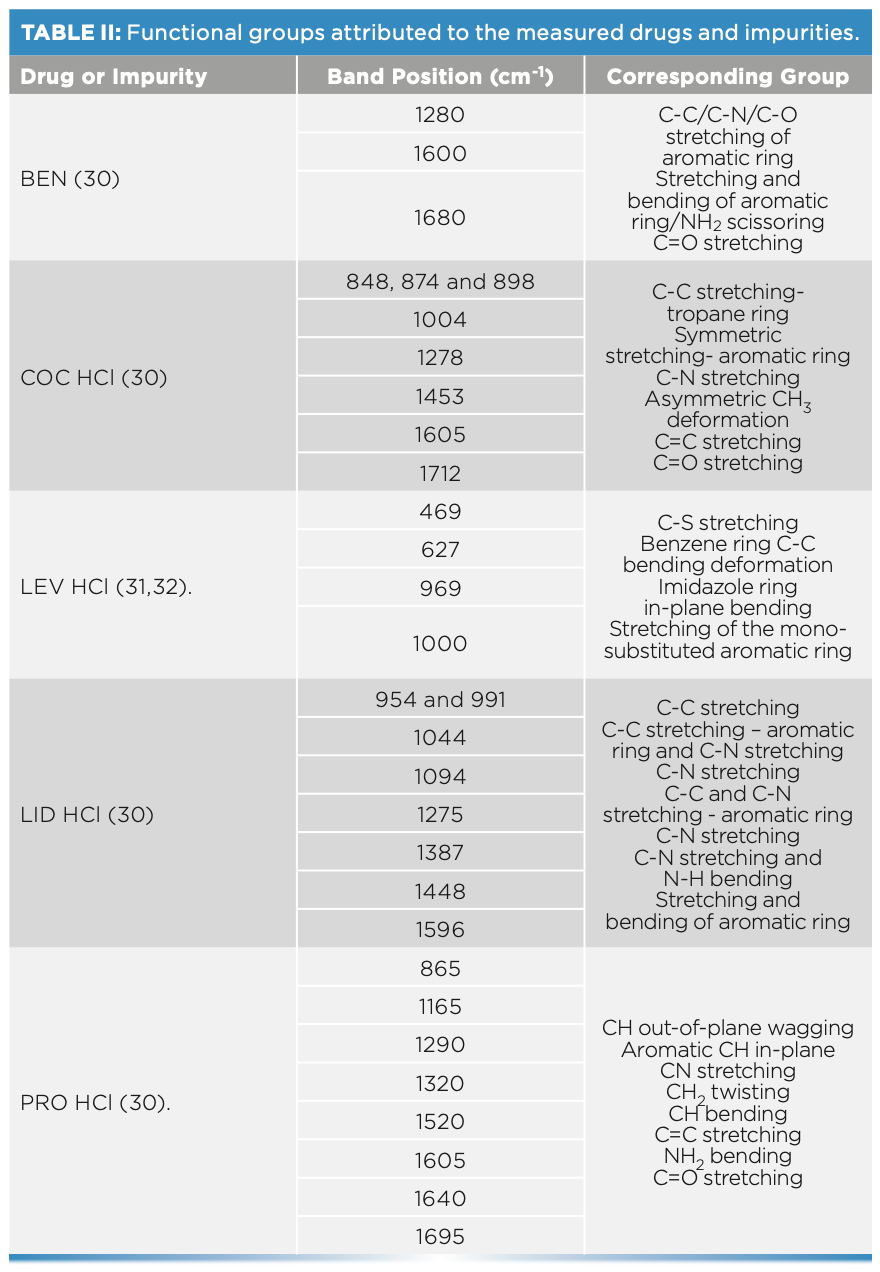
Spectral interpretation showed characteristic scattering bands for the chosen drug and impurities, which suggested that Raman spectra indicated a key difference between the sets of spiked fingernails. The tested drug and impurity showed key bands between 400–1700 cm-1. In this respect, Raman spectra showed key differences between the spiked fingernail sets. Fingernails spiked with COC HCl could be differentiated from BEN over the ranges of 1600–1712 cm-1 (30). PRO could also be discriminated from BEN and COC over a range of 1600–1712 cm-1. For example, PRO showed key bands at 1605 (C=C stretching), 1640 (NH2 bending), and 1695 cm-1 (30). Similarly, LEV could be differentiated from COC over a range
of 460–1004 cm-1, where COC showed key bands at 848, 878, and 898 cm-1, which have been associated with the C-C stretching of the tropane ring. COC also showed bands at 1278 (C-N stretching), 1453 (asymmetric CH3 deformation), 1605 (C=C stretching), and 1712 cm-1 (C=O stretching) (Figure 4) (30). On the other hand, LEV showed key bands at 469 (C-S stretching), 627 (C-C bending of the benzene ring), 969 (In-plane bending related to the imidazole ring) and 1000 cm-1 (stretching of the mono-substituted aromatic ring) (31,32). Furthermore, LID showed characteristic bands at 954 and 991 (C-C stretching), 1044 (C-C stretching of the aromatic ring), 1094 (C-N stretching), and 1275 cm-1 (C-C and C-N stretching of the aromatic ring) (30) (Table II).
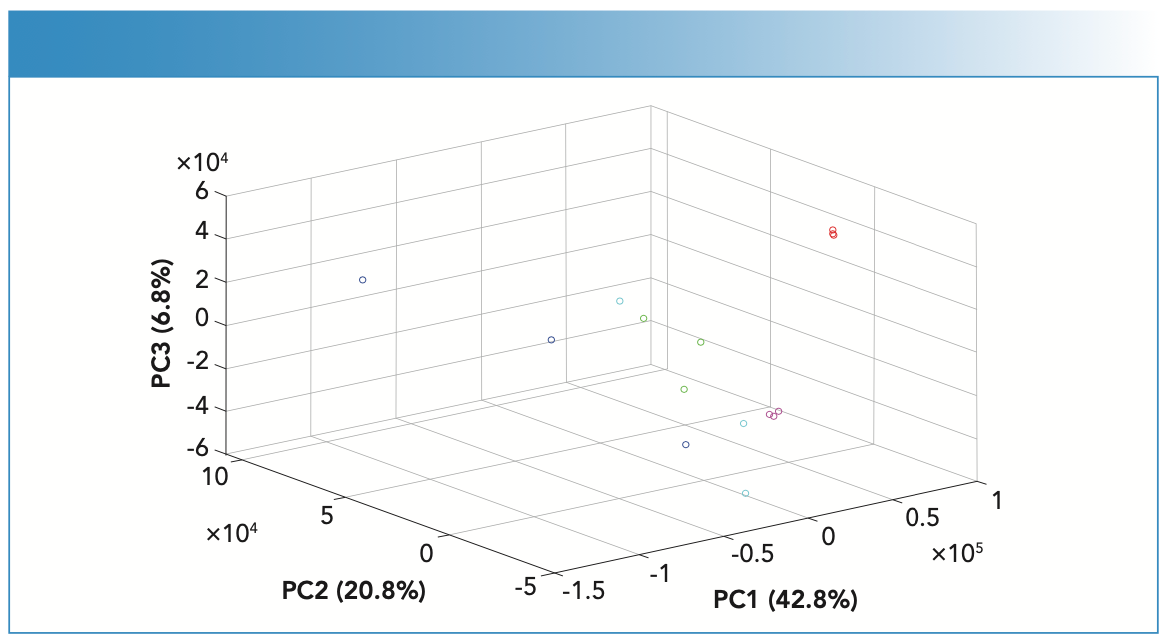
PCA scores recognized patterns in the spiked fingernail scores, which corresponded to the spectral features and contributed to a high variance (Figure 5). The first three PCs contributed 70.4% of the variance among the spiked fingernail spectra. PC scores indicated that Raman spectroscopy and chemometrics demonstrated the ability to differentiate fingernails spiked with COC from other drug impurities. PC1 demonstrated the highest variance among the data (42.8%) and showed scores relating to BEN, COC, LID, and PRO. PC2 showed the second highest variance (20.8%) and accounted for BEN, LEV, and LID, and PC3 showed the third highest variance (6.8%) with scores relating to BEN. The combination of Raman spectroscopy and PCA analysis was successful in identifying and classifying the different sets of spiked fingernails where each set of spiked fingernails showed a distinct cluster (Figure 4). In this respect, no false positive was observed but false negatives were seen for the scores of BEN, LEV, and PRO spectra. This observation could be related to two main reasons—the first being the inconsistency of distribution of drugs within fingernails, and the second being related to the nature of ORS in hitting multiple spots within the sample. To address this limitation in future, Raman microscopy could be used where larger areas of the sample could be measured and studied in further detail.
FIGURE 5: PCA scores plot of the Raman spectra of fingernails spiked with BEN (blue), COC HCl (red), LEV HCl (green), LID HCl (magenta), and PRO HCl (cyan).
Conclusion
Raman spectroscopy offered a rapid and specific detection method for fingernails’ endogenous constituents, COC HCl, and its impurities. The results showed ORS technology resolved previous issues of conventional Raman spectroscopy, such as low spectrum intensity and resolution, and enhanced the Raman signal of fingernails spiked with drugs and impurities. This was ensured by a greater interrogation area and therefore advancing the overall sample’s identity. Further research is needed into looking at the influence of spiking over a longer duration of time and identifying the differences between acute and chronic drug exposure.
Acknowledgments
The authors would like to thank Paul Bonser and Ian Jackson for their support of the project and for the Metrohm Mira XTR spectrometer.
References
(1) D.K. Tracy, D.M. Wood, and D. Baumeister, BMJ 356, i6848 (2017). https://doi.org/10.1136/bmj.i6848.
(2) United Nations Office on Drugs and Crime, World Drug Report 2021 (United Nations, New York, NY, 2021).
(3) United Nations Office on Drugs and Crime, World Drug Report 2019 (United Nations, New York, NY, 2019).
(4) B. Brands, B. Sproule, and J. Marshman, Drugs & Drug Abuse (Centre for Addiction and Mental Health, Toronto, Ontario, Canada, 3rd ed., 1998).
(5) L.S. Goodman, L.L. Brunton, B. Chabner, and B.C. Knollmann, Goodman & Gilman’s Pharmacological Basis of Therapeutics (McGraw-Hill Medical, New York, NY, 2011).
(6) A. Poklis, R.L. Fitzgerald, K.V. Hall, and J.J. Saady, Forensic Sci. Int. 59, 63–70 (1993). DOI: 10.1016/0379-0738(93)90312-X
(7) P. Saar-Reismaa, E. Erme, M. Vaher, M. Kulp, M. Kaljurand, and J. Mazina-Šinkar, Anal. Chem. 90, 6253–6258 (2018). DOI: 10.1021/acs.analchem.8b00911
(8) S. Rauf, L. Zhang, A. Ali, Y. Liu, and J.H. Li, ACS Sensors 2, 227–234 (2017). DOI: 10.1021/acssensors.6b00627
(9) S. Balayssac, E. Retailleau, G. Bertrand, M.P. Escot, R. Martino, M. Malet-Martino, and V. Gilard, Forensic Sci. Int. 234, 29–38 (2014). DOI: 10.1016/j.forsciint.2013.10.025.
(10) C. McKenzie, O.B. Sutcliffe, K.D. Read, P. Scullion, O. Epemolu, and D. Fletcher, Forensic Toxicol. 36, 359–374 (2018). DOI: 10.1007/s11419-018-0413-1.
(11) H. Schulz, M. Baranska, R. Quilitzsch, and W. Schütze, Analyst 129, 917–920 (2004). DOI: 10.1039/ B408930H.
(12) C. Penido, M.T.T. Pacheco, I.K. Lednev, and L.J. Silveira, J. Raman Spectrosc. 47, 28–38 (2016). DOI: 10.1002/jrs.4864.
(13) S. Ewen, and G. Dent, Modern Raman Spectroscopy: A Practical Approach (John Wiley & Sons, New York, NY, 2005).
(14) D.A. Skoog, F.J. Holler, and S.R. Crouch, Principles of Instrumental Analysis (Cengage Learning, Boston, MA, 6th ed., 2006).
(15) H.H. Willard, Jr L.L. Meritt, J.J. Dean, and Jr. F.A. Settle, Instrumental Methods of Analysis (CBS Publisher & Distributor, New Delhi, India, 7th ed., 1988).
(16) M.J. West and M.J. Went, Drug Test. Anal. 3, 532–538 (2011). https://doi.org/10.1002/dta.217.
(17) G. Ellis, P.J. Hendra, C.M. Hodges, T. Jawhari, C.H. Jones, P. Le Barazer, and C. Passingham, Analyst 114, 1061–1066 (1989).
(18) E.A. Cutmore, and P.W. Skett, Spectrochim Acta A 49, 809–818 (1993).
(19) SWGDRUG, Scientific Working Group for the Analysis of Seized Drugs (SWGDRUG) Recommendations, version 8.0. www.swgdrug.org (accessed June 13, 2019).
(20) E.M.A. Ali and H.G.M. Edwards, J. Raman Spectrosc. 45(3), 253–258 (2014).
(21) H. Muhamadali, A. Watt, Y. Xu, M. Chisanga, C. Jones, D. Ellis, et al., Front Chem. 7, 412 (2019). https://doi.org/10.3389/fchem.2019.00412.
(22) J. Omar, B. Slowikowski, C. Guillou, F. Reniero, M. Holland, and A. Boix, J. Raman Spectrosc. 50(1), 41–51 (2019). https://doi.org/10.1002/jrs.5496.
(23) C. Eliasson and P. Matousek, Anal. Chem. 79(4), 1696–1701 (2007).
(24) M. Gniadecka, O. Nielsen, D. Christensen, and H. Wulf, J. Investig. Dermatol. 110(4), 393–398 (1998).
(25) E. Wiercigroch, E. Szafraniec, K. Czamara, M. Pacia, K. Majzner, and K. Kochan, Biomol. Spectrosc. 185, 317–336 (2017).
(26) A. Chiriac, D. Azoicai, A. Coroaba, F. Doroftei, D. Timpu, and A. Chiriac, Molecules 26(2), 280–281 (2021).
(27) P. Rich, Dermatol Ther. 15(2), 107–110 (2002).
(28) B. Barry, H. Edwards, and A. Williams. J. Raman Spectrosc. 23(11), 641–645 (1992).
(29) A. Geravand, and S. Hashemi Ne-zhad, Optik. 178, 83–89 (2019).
(30) I. Abdulazeez, S. Popoola, T. Saleh, and A. Al-Saadi, Chem. Phys. Lett. 730, 622–716 (2019).
(31) R. Kranenburg, J. Verduin, Y. Weesepoel, M. Alewijn, M. Heerschop, and G. Koomen, Drug Test. Anal. 12(10), 1404–1418 (2020).
(32) S. Shi, F. Yang, W. Yao, and Y. Xie, Spectrosc Spect. Anal. 41(12), 3759– 3760 (2021).
Megan Wilson, Jason Birkett, Iftikhar Khan, and Sulaf Assi are with the School of Pharmacy and Biomolecular Sciences at Liverpool John Moores University, in Liverpool, United Kingdom. Dhiya Al-Jumeily is with the School of Engineering and Technology at Liverpool John Moores University, in Liverpool, United Kingdom. Ismail Abbas is with the Faculty of Science at Lebanese University, in Beirut, Lebanon. Direct correspondence to: m.wilson3@2019.ljmu.ac.uk ●
AI-Powered SERS Spectroscopy Breakthrough Boosts Safety of Medicinal Food Products
April 16th 2025A new deep learning-enhanced spectroscopic platform—SERSome—developed by researchers in China and Finland, identifies medicinal and edible homologs (MEHs) with 98% accuracy. This innovation could revolutionize safety and quality control in the growing MEH market.
New Raman Spectroscopy Method Enhances Real-Time Monitoring Across Fermentation Processes
April 15th 2025Researchers at Delft University of Technology have developed a novel method using single compound spectra to enhance the transferability and accuracy of Raman spectroscopy models for real-time fermentation monitoring.
Nanometer-Scale Studies Using Tip Enhanced Raman Spectroscopy
February 8th 2013Volker Deckert, the winner of the 2013 Charles Mann Award, is advancing the use of tip enhanced Raman spectroscopy (TERS) to push the lateral resolution of vibrational spectroscopy well below the Abbe limit, to achieve single-molecule sensitivity. Because the tip can be moved with sub-nanometer precision, structural information with unmatched spatial resolution can be achieved without the need of specific labels.