Rapid Determination of the Peroxide Value of Edible Oil by Handheld NIR Spectroscopy in Combination with Wavelength Variables Selection and PLS Calibration
Detecting the peroxide value (PV) in oil is significant for people in everyday life, especially as a fast, convenient, and on-site method. To tackle this challenge, the near-infrared (NIR) spectra of oil were collected by a Viavi MicroNIR 1700 handheld NIR spectrometer and a liquid sample transmission accessory. Subsequently to the spectral pretreatment method of standard normal variate (SNV), the sensitive wavelength variables were optimized by the algorithms of competitive adaptive reweighted sampling (CARS), genetic algorithms (GA), and random frog (RF). The results showed that CARS was the best, and the selected variables were used to build the partial least squares (PLS) regression model. The root mean square error (RMSE) values for cross-validation (RMSECV) and prediction (RMSEP) were 0.984 mmol/ kg and 0.950 mmol/kg, respectively, and the corresponding R2cv and R2P were 0.875, and 0.867, respectively. Therefore, the PV of edible oil can be determined easily and quickly with a handheld NIR spectrometer.
Because of high-volume manufacturability and the opportunity to significantly reduce costs, numerous companies target handheld near-infrared (NIR) scanners for a non-expert user community for consumer applications. A tremendous impact of handheld NIR spectroscopy for everyday life applications can be expected, ranging from food testing to detection of fraud and adulteration in a broad area of materials (1). The present study focuses on the on-site determination of the peroxide value (PV) in edible oil by handheld NIR spectroscopy.
Edible oil is one of the main raw materials for food, and its PV is one of the important indexes for the evaluation of oil quality. It is an index of the degree of oxidation of oils and fatty acids. During the rancidity process, oil produces some intermediate products that are very unstable and continue to decompose into aldehydes, ketones, and other oxides, which further deteriorates the oil (2). Long-term consumption of food with excessive PV is very disadvantageous to human health because peroxide can destroy cell membrane structure, which could result in gastric cancer, liver cancer, arteriosclerosis, myocardial infarction, hair loss, and weight loss (3). Therefore, a fast detection method for measuring PV in oil is important. Undoubtedly, handheld NIR spectroscopy is the optimal choice because it is fast and easy to use.
Materials and Methods
Samples
For this study, 54 oil samples were collected as the calibration set for the development of the calibration models.
NIR Spectra Acquisition
A MicroNIR 1700 instrument combined with a liquid-sample accessory (Figure 1a) was applied for the recording of spectra. For the transflection measurements, a drop of oil was deposited in the trough of the liquid sample accessory, and then the lid was closed (Figures 1a and 1b). First, 50 scans with an integration time of 60 ms were accumulated for the wavelength range 950–1650 nm with a spectral resolution of 12.5 nm. A 99% Spectralon reflection standard (Labsphere Inc.) was used as the reference. The final spectrum was the average of triplicate measurements.
FIGURE 1: Images showing method and apparatus for NIR spectrum collection for oil. (a) A liquid-sample accessory and (b) optical path diagram of spectrum acquisition.

PV Measurements
The reference PV of the samples was determined based on the national standard GB5009.277-2016; the unit was mmol/kg.
Spectral Analysis
Spectra Pretreatment
NIR spectra frequently contain background information, drift, and noise. To obtain reliable, accurate, and stable calibration models, it may be necessary to preprocess the spectral data before modeling (4). In this application, the spectra were pretreated by the standard normal variate (SNV) scatter correction.
Wavelength Variables Selection
In NIR spectra, the spectral information is not evenly distributed over the whole wavelength range under investigation. Therefore, the selection of the informative variables is a significant preprocessing step (5). In the present work, three kinds of wavelength selection methods, competitive adaptive reweighted sampling (CARS), random frog (RF), and genetic algorithm (GA), were applied.
CARS is based on the simple and effective “survival of the fittest” principle to select wavelength variables, and it selects the optimal combination of wavelength variables with larger absolute regression coefficients in PLS regression (6). RF is a novel feature wavelength optimization method applying the framework of reversible jump Markov Chain Monte Carlo (RJM- CMC) (5). It runs a search in the model space through both fixed-dimensional and trans-dimensional moves between different models, and then a pseudo-MCMC chain is computed to calculate the selection probability (SP) for each variable. The wavelength variable is preferred according to the ranking of all variables based on SP. GA is an adaptive search procedure based on the mechanism of genetics and natural selection (7). The fitness of an individual (its ability to adapt to the environment) is calculated; high-quality individuals are retained and low-quality individuals are discarded. New individuals are generated through inheritance and evolved through natural selection. In this way, eventually, the solution to the problem is achieved.
CARS and RF were run by the lib-PLS toolbox (6), and GA was run by the “genpls” toolboxes.
Partial Least Squares (PLS) Calibration
The Unscrambler (version 10.4, Camo Software AS) was used to develop the PLS calibration models, and the number of factors was determined by 20-fold internal cross-validation. Cross-validation was applied to estimate the prediction error by dividing all the samples into 20 random segments, one segment was reserved for validation, and the remaining 19 segments were used for calibration. This process was repeated until all segments were used for validation once, and then the optimal number of factors was obtained (8).
Validation with Unknown Samples
For this part of the study, 27 unknown samples were collected as a test (or prediction) set to externally validate the prediction capability of the calibration models.
Calibrations and Validation Statistics
Calibration and validation statistics parameters were the R-squared values (R2) and the root mean square errors (RMSEs). For the calibration, cross-validation, and prediction sets, the RMSEs for calibration (RMSEC), cross-validation (RMSECV), and prediction (RMSEP), respectively, were determined. Accordingly, the R2 were represented by the R2C, R2CV, and R2P (9). The RMSEC, RMSECV, and RMSEP were used to evaluate the feasibility and predictive capability of the model The lower the RMSEP and the closer its value to the RMSECV, the stronger the prediction ability and the greater the robustness of the model. The residual predictive deviation (RPDCV) defined by the standard deviation/RMSECV of the cross-calibration set was included to estimate how well the calibration model can predict the compositional data. Generally, an RPDCV value greater than three can be considered as very good for prediction purposes (10).
Results and Discussions
PV Reference Values
The oil PV values were determined by a national method and the results are summarized in Table I. For the calibration set and the test set, the mean values were 4.25 mmol/kg and 4.17 mmol/kg, respectively. The corresponding ranges were 4.25–12.23 mmol/kg and 4.17–10.86 mmol/kg, and the standard deviations were 2.76 mmol/kg and 2.65 mmol/kg, respectively. The values were almost the same, which demonstrated that the collected samples for the calibration set and test set were reasonable.

Raw NIR Spectra
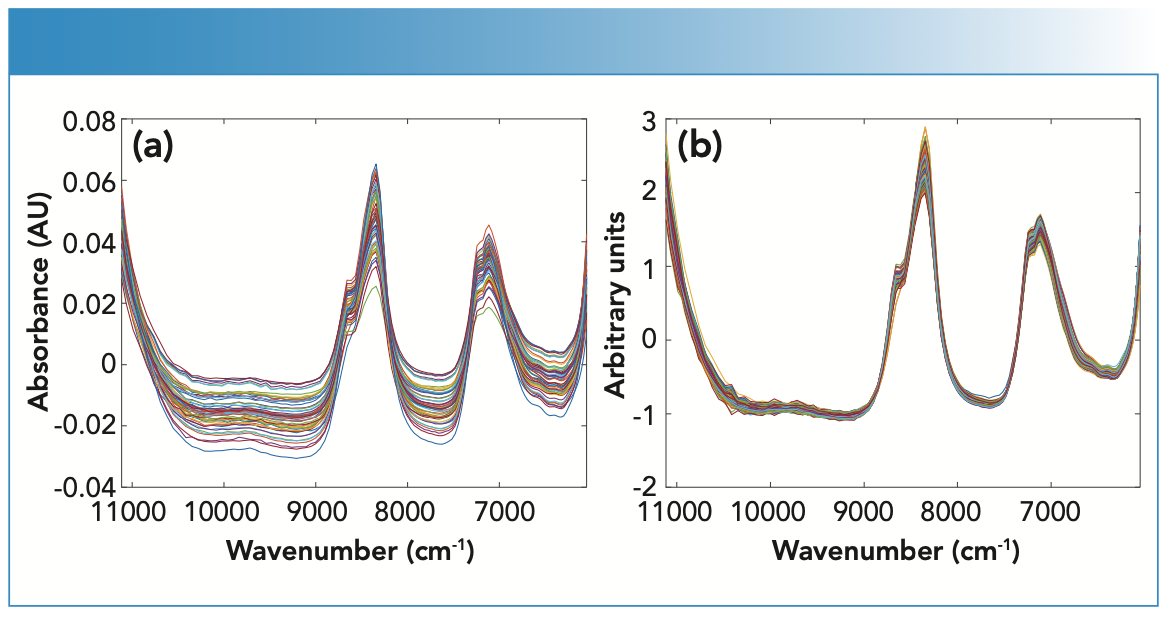
The raw NIR spectra of oil are presented in Figure 2a. The most intense peak at 8343 cm-1 and the shoulder at 8660 cm-1 are the second overtones of the ν(CH2) and ν(CH3) vibrations, respectively. The absorption bands at 7243 cm-1 and 7114 cm-1 can be assigned to the 2ν(CH3) + δ(CH3) and 2ν(CH2) + δ(CH2) combination bands (11), respectively, superimposed by the first overtone of the ν(OH) stretching vibration. As shown in Figure 2b, after SNV pretreatment, especially the spectral differences in the 8000–9000 cm-1 wavenumber range were highlighted.
FIGURE 2: The NIR spectra of oil showing (a) raw spectra and (b) spectra pretreated by SNV.

Wavelength Selection
As mentioned in the previous section, CARS, RF, and GA were used to select wavelength variables. The selection results are shown in Figure 3. Finally, 25, 52, and 40 wavelength variables were selected for the calibration.
FIGURE 3: The results of wavelength variable selection by the three different methods: (a) CARS, (b) RF, and (c) GA.

Calibration Analysis
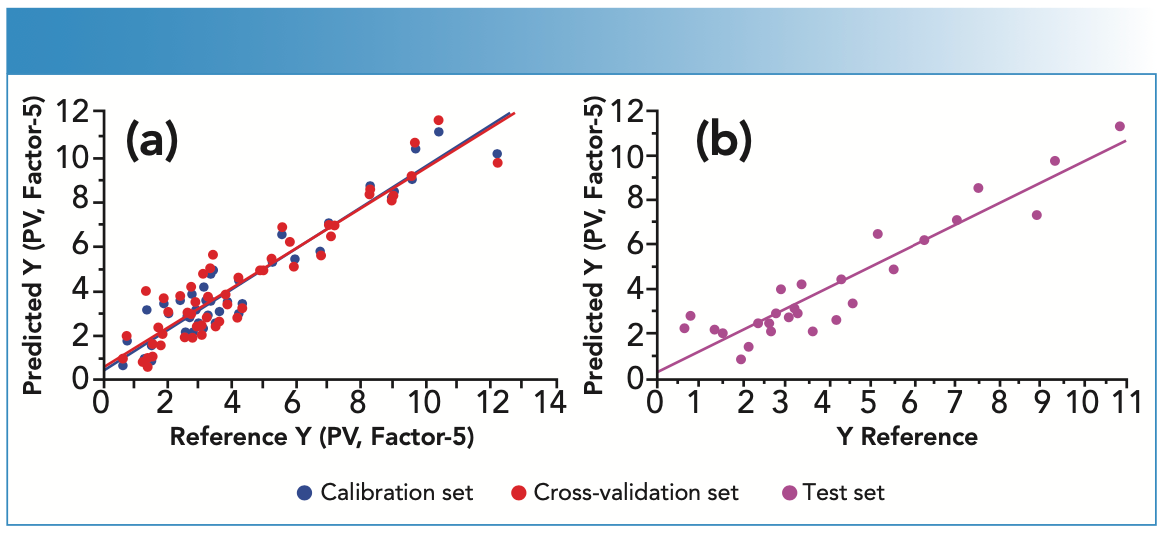
After the wavelength variables were selected by the CARS, RF, and GA methods, they were subjected to PLS modeling. For the three wavelength optimization methods, they all improved the calibration performance. Although they had almost the same RMSECVs of 0.98 mmol/kg, 0.97 mmol/kg, and 0.93 mmol/kg, CARS had the lowest RMSEC of 0.76 mmol/kg, Therefore, CARS proved to be the best variable selection method. Regarding the RPDcvs values of models with selected variables, they were larger than those of models with the full variables and were close to 3, which demonstrated that the models had accurate prediction capability in the whole range of PV. Figure 4a presents the scatter plot of the reference PV compared to the predicted PV for the calibration and cross-validation sets; the proximity to the regression line demonstrates a good calibration performance.
FIGURE 4: The scatter plots of PV reference compared to the predicted values for (a) the calibration cross-validation sets and (b) the test set.

Validation of Unknown Samples
There were 27 samples collected for the validation of the calibration model. The results are summarized in Table II, where CARS has the smallest RMSEP of 0.95 mmol/kg, compared to 1.14 mmol/kg and 1.15 mmol/kg of RF and GA, respectively. The plot of reference compared to the predicted values is shown in Figure 4b, with the points lying close to the regression line. The large R2P of 0.867 proves that the built model has a good performance for the PV prediction of unknown oil samples and the calibration can be used for future applications.

Conclusion
The PV of edible oil can be easily and rapidly determined on-site by handheld NIR spectroscopy. With the further de- velopment and dissemination of this technology, it will prove very helpful for the protection of human health and also be used for the rapid detection of other quality indicators in food.
References
(1) H. Yan, B. Han, and H.W. Siesler, Spectroscopy 35(6), 15–18 (2020).
(2) N. Zhang, Y. Li, S. Wen, Y. Sun, J. Chen, Y. Gao, A. Sagymbek, and X. Yu, Food Chem. 358, 129834 (2021). DOI: 10.1016/j.foodchem.2021.129834
(3) R.R. Mariana, E. Susanti, L. Hidayati, and R.A. Wahab, AIP Conf. Proc. 2231(1), 040057 (2020). DOI: 10.1063/5.0002656
(4) X.L. Chu, H.F. Yuan, and W.Z. Lu, Prog. Chem. 16(4), 528–542 (2004). DOI: 10.1016/j.jco.2003.08.015
(5) H.D. Li, Y.Z. Liang, X.X. Long, Y.H. Yun, and Q.S. Xu, Chemom. Intell. Lab. Syst. 122(5), 23–30 (2013). DOI: 10.1016/j.chemolab.2013.01.003
(6) H.D. Li, Q.S. Xu, and Y.Z. Liang, Chemom. Intell. Lab. Syst. 176, 34–43 (2018). DOI: 10.1016/j.chemolab.2018.03.003
(7) X. Shao, F. Wang, D. Chen, and Q. Su, Anal. Bioanal. Chem. 378(5), 1382–1387 (2004). DOI: 10.1007/s00216-003-2397-9
(8) T. Næs, T. Isaksson, T. Fearn, and T. Davies, A User-Friendly Guide to Multivariate Calibration and Classification (NIR publications, London, United Kingdom, 2002). DOI: 10.1255/nirn.658
(9) S.X. Fan, B.H. Zhang, J.B. Li, W.Q. Huang, and C.P. Wang, Biosyst. Eng. 143, 9–19 (2016). DOI: 10.1016/j.biosystemseng.2015.12.012
(10) T. Fearn, NIR News 13(6), 12–13 (2002). DOI: 10.1255/nirn.689
(11) J. Workman and L. Weyer, Practical Guide and Spectral Atlas for Interpretive Near-Infrared Spectroscopy (CRC Press, Boca Raton, FL, 2nd ed., 2012)
Ziniu Zhao and Hui Yan is with the School of Biotechnology at Jiangsu University of Science and Technology, in Jiangsu, China. Heinz W. Siesler is with the Department of Physical Chemistry at the University of Duisburg-Essen, in Essen, Germany. Direct correspondence to: yanh1006@163.com.●

Real-Time Battery Health Tracking Using Fiber-Optic Sensors
April 9th 2025A new study by researchers from Palo Alto Research Center (PARC, a Xerox Company) and LG Chem Power presents a novel method for real-time battery monitoring using embedded fiber-optic sensors. This approach enhances state-of-charge (SOC) and state-of-health (SOH) estimations, potentially improving the efficiency and lifespan of lithium-ion batteries in electric vehicles (xEVs).