The Versatility of Portable Raman in Process Development
Special Issues
Raman spectroscopy is a well-suited spectroscopic technique for process development and control within development labs in chemical, pharmaceutical, and other industries. This article demonstrates the utility of portable Raman spectroscopy as a simple and versatile tool for in-situ monitoring of reactions using univariate analysis such as peak trending, as well as multivariate analysis approaches to predict the end point of chemical reactions. Using portable Raman systems allows users to make measurements in the lab, but also serves as a proof of concept for the Raman measurements to be implemented at-line or on-line in small pilot plants or large scale production sites. For known reactions that are repetitively performed, or for continuous online process monitoring of reactions, the present approach provides a convenient solution for process understanding and the basis for future implementation.
Raman spectroscopy is a well-suited spectroscopic technique for process development and control within development laboratories in chemical, pharmaceutical, and other industries. This article demonstrates the utility of portable Raman spectroscopy as a simple and versatile tool for in-situ monitoring of reactions using univariate analysis techniques such as peak trending, as well as multivariate analysis approaches to predict the end point of chemical reactions. The use of portable Raman systems allows analysts to make measurements in the laboratory, but also serves as a proof of concept for the Raman measurements to be implemented at-line or on-line in small pilot plants or large-scale production sites. For known reactions that are repetitively performed, or for continuous on-line process monitoring of reactions, the present approach provides a convenient solution for process understanding as well as a basis for future implementation.
Process analytics has been in use for nearly 70 years, starting in the petrochemical and chemical industries using infrared (IR) photometers and different types of devices such as oxygen and conductivity sensors as process analyzers to control manufacturing and refining processes (1). These univariate sensors and others continue to be used, and other sensors including spectroscopic systems have also been adopted. The value of process analytics is that it can provide the pulse of a process. Process analytical technology (PAT) is the use of off-line, at-line, or in-line analyzers to obtain analytical data faster, more often with high precision to increase manufacturing controls of biological or chemical materials, as well as aid in process understanding for optimization and improvement (2). PAT has seen increased interest since 2005 with the publication of a guidance on PAT utilization in the pharmaceutical industry from the United States Food and Drug Administration (FDA). Spectroscopic tools including Raman can be used in situ or can be interfaced to a sampling loop on a process to monitor the chemical composition with full spectral information, which is the molecular picture of the changes occurring in the process. The amount of data that can be collected may exceed the speed of a process and in the early phases of process development this can be used to understand a process and its dynamics, possible side reactions, and kinetic pathways.
Raman spectroscopy is a laser-based form of molecular spectroscopy that provides specificity and sensitivity for qualitative and quantitative analysis of substances from their molecular vibrations. It is used in many different environments as an analytical tool for the study of solids, liquids, and gases. Many Raman instruments are interfaced with a fiber-coupled probe, which gives the versatility and flexibility for measurements to be made in different places, including in situ as is often the requirement for the monitoring of processes. More than a decade ago, hardware developments that lead to an increase in the adoption of Raman spectroscopy were recognized as the development of compact lasers, introduction of spectroscopic-grade charge-coupled device detectors, improvements in sampling optics (including fiber-optic probes), and the advances in powerful personal computers and associated software to collect and analyze volumes of data (3). These developments, as well as the advancement of technology in laser and spectrometer miniaturization and improved filters for laser light rejection and fiber-optic probes, have allowed for the development of portable Raman spectroscopy systems that can be deployed and transported to different locations for uses that include process analysis. There are other complementary spectroscopic techniques to Raman such as Fourier transform infrared (FT-IR) and near-infrared (NIR) spectroscopy. However, because of Raman spectroscopy’s flexible sampling interface, high sampling rate, and high spectral specificity it is an invaluable tool for qualitative and quantitative analysis of chemical systems for reaction monitoring and end-point detection for chemical synthesis and polymerization reactions, hydrogenation, hydrolysis, and polymorphic characterization (1,3,5).
In the development of a process, there are many parameters that may be evaluated and experiments performed to optimize the yield, purity, and cycle time. To understand the impact of process changes on the process and product, in situ measurements can be made that relate the process parameters to product and process properties. In choosing measurement tools in process development, the needs of the chemical system in terms of “purpose, specificity, sensitivity, cycle time, on-line–off-line, qualitative–quantitative, accuracy, precision” must be defined and the proper technology that can fulfill the defined criteria must be chosen (4). In early phases of process development, qualitative information on reaction progress may be sufficient to gauge reaction completion. The trending of reactant- and product-relative concentrations based on peak height or area in a spectrum can be used to follow a reaction, even as other reaction parameter (such as solvent and other reagents or temperature) are changed from one reaction to another. In reactions where stoichiometric control is required, a quantitative measure of reactant concentrations may be needed. Off-line measurements by high performance liquid chromatography (HPLC) can be made and quantitative calibration models developed, but such models are matrix dependent and often require updating or redevelopment when the reaction matrix is changed.
In this study, the goal was to determine the end point of the chemical reaction for the 6-methyl-2-phenylimidazo[1,2-a]pyridine synthesis and its derivative. The synthesis of this compound was under development for medicinal chemistry, and traditional thin-layer chromatography (TLC) was used to verify reaction completion, but very few aliquots are taken at the small-scale reactions, and the timing for sampling for the end point is based on the visual precipitation in the reaction mixture followed by the TLC test. Information on reaction progress and possible formation of intermediates and side products is possible only when Raman spectra are collected regularly throughout the course of the reaction. Monitoring the reaction with in situ Raman spectroscopy reduces the need for removing samples for analysis and also provides real-time information on reaction progress.
Experimental
The experimental setup consisted of an i-Raman Plus portable Raman spectrometer from B&W Tek with a 785-nm, 300-mW laser excitation source connected to a back-thinned charge-coupled device (CCD) array detector covering a spectral range of 65–3200 cm-1. The sampling interface was a fiber-optical bundle with an immersion probe to allow for in situ measurements during the reactions. The Raman instrument was used to monitor the small molecular synthesis of 6-methyl-2-phenylimidazo[1,2-a]pyridine synthesis and its derivative 2-phenylimidazo[1,2-a]pyridine. The immersion probe was inserted into the round-bottom flask for direct measurement throughout the course of the reaction. The starting reagents were suspended into acetonitrile, and a small amount of sodium bicarbonate was added to neutralize the hydrobromic acid that formed during the process. The reaction was placed under argon atmosphere and heated to 80 °C for approximately 2 h. Raman measurements were collected every minute during the reaction with an integration time of 3 s averaged over 10 spectra.
Two similar Sn2 reactions were monitored to understand the reactions and determine their reaction end point. In these chemical reactions for development of these medicinal chemistry compounds, the goal of the process monitoring was to have a qualitative trend of the reaction progress and a means to detect the reaction end point. The first reaction is 2-aminopryidine reacted with 2-bromoacetophenone to form 2-phenylimidazo[1,2-a]pyridine. For this reaction, a univariate approach of monitoring the reactant and product peaks was conducted using B&W Tek’s BWSP software. For the second reaction of 2-amino-5-methyl-pyridine and 2-bromoacetophenone to form 6-methyl-2-phenylimidazo[1,2-a]pyridine, a multivariate analysis method was applied using the Unscrambler software (CAMO Software). This approach also provided qualitative information, because there was no requirement of quantitation, but rather a real-time measure of reaction end point in place of previously used off-line TLC.
Results and Discussion
For the first reaction of the synthesis of 2-phenylimidazo[1,2-a]pyridine, a spectrum was taken for each of the starting materials and the final product to identify the Raman peaks to monitor during the course of the reaction process. As shown in Figure 1, the three regions of interest are 847 cm-1 (2-aminopyridine, reactant 1), 1547 cm-1 (final product), and broad dual peaks between 1684 and 1702 cm-1 (2-bromoacetophenone, reactant 2). Because of the specificity of the Raman spectrum and the fact that these identified peaks do not have any overlap with other Raman peaks of solvent or other reaction components, univariate analysis can be effectively used. During the progression of the reaction the two product peaks at 1547 cm-1 and 1603 cm-1, respectively, were monitored as shown in Figure 2a. The region with a significant dip in the real-time trending plot of relative intensity as a function of time was caused by probe fouling. This fouling can occur during in situ monitoring because material may adhere to the probe, and for full process monitoring implementations a measure should be taken to minimize it, including better control of stirring or automated probe cleaning procedures. Figure 2b is the peak trending plot of the reactants and product peaks created post-reaction with the probe fouling data removed. The data plotted was preprocessed using a second order derivative Savitzky-Golay filter to minimize baseline effects; the data were then multiplied by -1 to reverse the trend in the plot to show the reactants decreasing and product peaks increasing. The Raman spectra collected throughout the reaction monitoring are shown in Figure 3, with the reactant peaks visibly diminishing while the product peak is simultaneously increasing as the reaction progresses. The univariate analysis provided supportive information into the end point of the reaction as shown in Figure 4a where the overlay of the first and last spectra from the reaction illustrate the complete consumption of the reactants. Based on the peak trending plots of the reactants and product (Figure 2b), along with the overlay the first and last spectra collected (Figure 4a), the reaction appears to finish within 2 h. On a closer observation of the overlay regions of interest, shown in Figure 4b, the data indicates the reaction could have come to completion sooner because the peaks for the reactants are not visible in the raw data before the last collected spectrum.
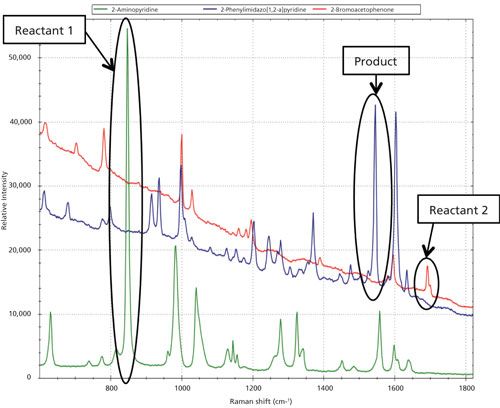
Figure 1: Overlay of the Raman spectra of the reactants and product for the first synthesis: green = 2-aminopyridine (reactant), red = 2-bromoacetophenone (reactant), and blue = final product: 2-phenylimidazo[1,2-a]pyridine.
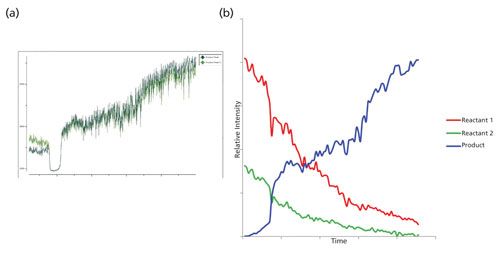
Figure 2: (a) Real-time peak trending of the two product peaks during the course of the reaction and (b) univariate peak trending plots using the (second derivative *-1 to remove any variation that might be coming from the baseline): red = 2-bromoacetophenone (reactant 1), green = 2-aminopyridine (reactant 2), and blue = final product: 2-phenylimidazo[1,2-a]pyridine synthesis.
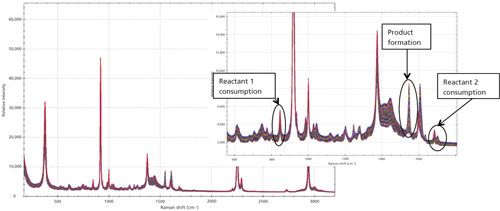
Figure 3: Reaction monitoring data for the first univariate test run. Note the consumption of the two reactant peaks at 847 cm-1 (reactant 1) and the broad band between 1684–1702 cm-1 (reactant 2) as well as the formation of the product at 1547 cm-1.
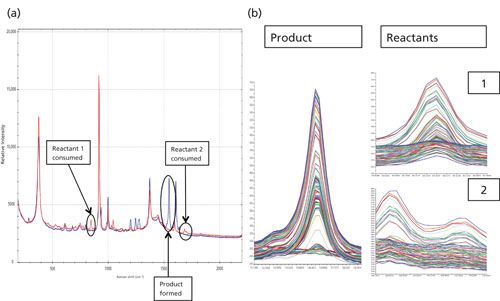
Figure 4: (a) The first and last spectra of the reaction along with (b) the peak trends of the formation of the product and the consumption of the reactants.
For the second reaction of the synthesis of 6-methyl-2-phenylimidazo[1,2-a]pyridine, the spectra of each starting material and final product were collected and the peaks of interest were identified for the reaction monitoring. The peaks were the same as the previous reaction, 847 cm-1 (2-amino-5-methyl-pyridine, reactant 1), 1547 cm-1 (final product), and broad dual peaks between 1684–1702 cm-1 (2-bromoacetophenone, reactant 2), as shown in Figure 5. The reaction proceeded for around 2 h with data collected throughout the course of the reaction at 1 min intervals. The peak trending during the course of the reaction showed similar profiles as those generated for the first reaction and gave insight into reaction progress. After the reaction, further data analysis was performed on the collected data using exploratory multivariate analysis. A multivariate curve resolution alternating least squares (MCR-ALS) algorithm was applied using the Unscrambler software over the regions of interest that include the product and reactant peaks. By this analysis, a two-component concentration and two-component spectra were determined, shown in Figure 6. The two component spectra were indicative to the product and reactant spectra. They are consistent with the reference spectra collected of the starting materials and product. The computed profiles plateau about midway through the reaction data collection, indicating that it was actually over in half the time, around 1 h. The experiments were repeated and validated using TLC to confirm the reaction completion in 1 h. The Raman spectroscopic monitoring of the reaction provided information on the reaction progress, and resulted in reducing the reaction cycle time by half.
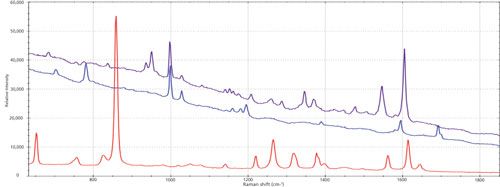
Figure 5: Overlay of reactants and product for the MCR approach: red = 2-amino-5-methyl-pyridine (reactant), blue = 2-bromoacetophenone (reactant), and purple = final product 6-methyl-2-phenylimidazo[1,2-a]pyridine.

Figure 6: (a) The two component spectra and (b) two component concentration of the MCR results.
Conclusions
Raman spectroscopy for process analytics is an invaluable tool for understanding reactions that have significant benefits for the chemical, pharmaceutical, and other industries. The aim of this contribution was to demonstrate the ability for portable Raman spectroscopy coupled with univariate and multivariate analysis tools in the process development stage to gain insight and process understanding of chemical reactions, specifically in determining reaction end points, on a laboratory-scale setup. The Raman spectral data was valuable to monitor the reaction qualitatively. These experiments serve as a proof of concept for further development with Raman measurements to move forward with at-line or on-line implementation as the chemical process is scaled up to pilot and manufacturing scales. This work demonstrates the versatility and ability of portable Raman spectrometers and their utility in process development and understanding.
References
- Process Analytical Technology: Spectroscopic Tools and Implementation Strategies for the Chemical and Pharmaceutical Industries, 2nd Edition, K.A. Bakeev, Ed. (John Wiley & Sons, Ltd., West Sussex UK, 2010).
- US Food and Drug Administration, Guidance for Industry: PAT -- A Framework for Innovative Pharmaceutical Development, Manufacturing, and Quality Assurance (FDA, Rockville, Maryland, 2004).
- J.B. Slater, J.M. Tedesco, R. Fairchild, and I.R. Lewis, in Handbook of Raman Spectroscopy, I.R. Lewis and H.G.M. Edwards, Eds. (CRC Press, New York, New York, 2001).
- G.L. Reid et al., Am. Pharm. Rev. June 20 (2012).
- X. Chen et al., Org. Process Res. Dev.19(8), 995–1003 (2015).
Thomas Padlo and Katherine Bakeev are with B&W Tek in Newark, Delaware. Direct correspondence to:
thomasp@bwtek.com and katherineb@bwtek.com

AI-Powered SERS Spectroscopy Breakthrough Boosts Safety of Medicinal Food Products
April 16th 2025A new deep learning-enhanced spectroscopic platform—SERSome—developed by researchers in China and Finland, identifies medicinal and edible homologs (MEHs) with 98% accuracy. This innovation could revolutionize safety and quality control in the growing MEH market.
New Raman Spectroscopy Method Enhances Real-Time Monitoring Across Fermentation Processes
April 15th 2025Researchers at Delft University of Technology have developed a novel method using single compound spectra to enhance the transferability and accuracy of Raman spectroscopy models for real-time fermentation monitoring.
Nanometer-Scale Studies Using Tip Enhanced Raman Spectroscopy
February 8th 2013Volker Deckert, the winner of the 2013 Charles Mann Award, is advancing the use of tip enhanced Raman spectroscopy (TERS) to push the lateral resolution of vibrational spectroscopy well below the Abbe limit, to achieve single-molecule sensitivity. Because the tip can be moved with sub-nanometer precision, structural information with unmatched spatial resolution can be achieved without the need of specific labels.