X-ray Fluorescence Spectroscopy, Part II: Sample Preparation
Spectroscopy

This installment of "Atomic Perspectives" is the second in a series describing the educational components and processes necessary in teaching and learning the technique of X-ray fluorescence (XRF) spectroscopy. Although three of the four states of nature (gas, liquid, and solid) are discussed briefly, the focus is on the sample preparation of bulk solid materials. Because of the advances in XRF instrumentation hardware and software as well as algorithm knowledge and selection for mathematical corrections, selection of an appropriate sample preparation technique is the major source of error in the most exacting quantitative analyses. The discussion begins with the fundamental assumptions necessary to prepare a bulk powder material for the best possible accuracy during quantitative analysis. Analysis of error is considered to show where sample preparation fits in the scheme of things. Then we discuss the physics involved during the excitation and emission processes and consider the major sources of error in preparing powders. Finally, the basics of grinding, pressing, and the fusion method of sample preparation are described.

The analytical process involved in producing an X-ray fluorescence (XRF) spectrochemical analysis of bulk materials (such as samples from ore deposits, ship cargo holds, quarries, coal seams, rail cars, manufacturing processes, and production lines) can be described as following four main categories: representative sampling and subsampling from the bulk, taking an aliquot from the subsample from which a specimen for analysis is prepared, generating net intensities from the specimen in an XRF spectrometer, and converting the net intensities into concentrations through a calibration curve. As shown in Figure 1 (1), the XRF technique can analyze most any material. The question is how much effort if any should go into the preparation of the specimen (the portion that is actually analyzed). As described in the previous installment of this column series on XRF spectroscopy (2), the reason to determine the elemental composition at high concentration of many materials with an XRF spectrometer is that the technique has the capability to produce the highest accuracy and precision possible. To achieve that goal, it is necessary when perfecting the method to review the sources of error and the amount that each may contribute (equation 1).
Figure 1: An assortment of materials that can be analyzed by XRF. Adapted with permission from Bruker.

Equation 1, the analysis of variance, shows contributions of the various components making up the analysis system. Analysis of variance (3) shows that the total error is equal to the square root of the sum of the squares of error of the individual components of the error; that is, the error from the counting statistics, the power source, the spectrometer, the macro sampling process, the specimen preparation process, the reference standards used for calibration, the type of correction algorithms applied and the decisions made when making those corrections, and everything else. Everything else can include the temperature, humidity, vibration, and dust in the laboratory and surroundings. These components contribute both random and systematic error. It is the job of the analyst performing the method development to minimize random errors and remove the systematic errors, which are generally quite large and easy to remove by an experienced spectroscopist. In fact, because of the advances made in the stability of the generators, tubes, and electronics, the accuracy of the goniometers, and the empirical and theoretical correction algorithms available in the software, the largest error now comes from standard selection, sampling, and specimen preparation. Therefore, the choice of method and application of technique when performing the specimen preparation is of paramount importance to the final accuracy of the analytical method. Notice the word accuracy is used here and not precision. In fact, it is possible when using XRF to choose a method where the precision will be very high but the accuracy will not be acceptable. The differentiation between precision and accuracy needs to be well understood when working with XRF, and will be discussed below.
If the goal is to achieve the highest accuracy possible, it is absolutely necessary to understand the concepts involved. For sure, the XRF technique for quantitative analysis is a comparative technique. That is, by virtue of using calibration curves, the ratio technique, or type standard technique, the closer the standards used are to the mineralogy, particle homogeneity, particle size, and matrix characteristics of the unknown, the more accurate the analysis will be. Let us call this "The Golden Rule for Accuracy in XRF Analysis." Conversely, the farther standards and unknowns are from each other in the above listed characteristics, the less accurate the analysis will be. This is a certainty.
Accuracy and Precision
Figure 2: Accuracy versus precision.
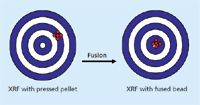
Precision can be defined as the closeness or agreement among replicate results. Accuracy can be defined as the nearness of a result to the true or accepted value. The bull's-eye on the left in Figure 2 shows that several determinations can lead to high precision (the dots are close together), but poor accuracy (they missed the bull's-eye). This can often be the case with the pressed powder method of specimen preparation. The bull's-eye on the right shows both high precision (dots are close together), and high accuracy (they hit the bull's-eye). This is almost always the case with the fusion method of specimen preparation. Later on, we will discuss why this is so, and how to choose which method will give the fastest and most accurate result. It is also important to understand that, as stated before, XRF spectrometers produce intensities, which are converted into concentrations through a calibration curve. The intensities themselves can be of very high precision, and the theoretical precision can be calculated because it is equal to the square root of the total number of counts. It is therefore possible to determine if the spectrometer is performing properly by making a 10-shot precision test and comparing it to the theoretical precision of each element. This is highly recommended before preparing standards or unknowns, making intensity measurements, and performing the calibrations.
Basic Concepts for XRF Sample Preparation
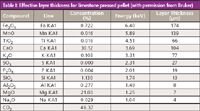
Table I: Effective layer thickness for limestone pressed pellet (with permission from Bruker).
The general rules for XRF analysis apply to situations where the highest accuracy is desired; these rules include
- The specimen should be representative of the bulk sample
- The specimen must be homogenous and flat
- Standards and unknowns must be very similar (density, particle size, particle homogeneity, mass attenuation coefficient)
- Specimen preparation should have good reproducibility
- The specimen should remain stable before and during analysis
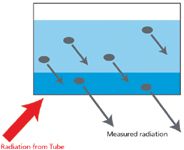
Figure 3: Concepts of infinite thickness and effective layer thickness (adapted with permission from Bruker).
More specific considerations involving the physical properties of the specimen (and container, if liquids or loose powders are analyzed) include
- Infinite thickness
- Effective layer thickness
- Surface film absorption characteristics (liquids)
- Particle size effects (loose and pressed powders) such as grain size effect, inter-mineral effect, and mineralogical effect
- Grinding curve analysis (pressed powders)
- Groove depth, smearing, and groove orientation (metals)
As an ideal starting point, the specimen should have an analytical depth for each wavelength (energy) analyzed that provides
Figure 4: Effective layer thickness calculation.
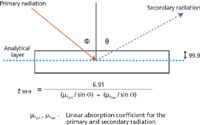
infinite thickness. That is, the thickness of the sample will not affect the analysis. On a more practical note, the specimen should have an effective layer thickness that will provide at least 99% of the analysis. Figure 3 shows the concepts of infinite thickness and effective layer thickness. The wavelengths of interest are not excited in the white layer. They are excited in the light blue layer, but most of them are absorbed by the sample matrix. Wavelengths in the dark-blue layer are excited and escape from the specimen to take place further in the analytical process. Modern software has the capability to calculate the effective layer thickness, and such a calculation is shown in Table I. It is worthwhile to take note of the narrow depth (thickness) from which most of the analysis is taking place for each element. For instance, sodium is coming from a depth of only 4 µm, aluminum and silicon from around 10 µm, and all of it from only 200 µm. The average thickness of a human hair is about 100 µm, so it is evident that the surface of the prepared specimen cannot be touched, breathed on, or exposed to any conditions that could alter it. Moreover, the effective layer thickness for any given wavelength changes with the matrix. As an example, the effective layer thickness for iron K-alpha wavelength changes from 3000 µm (3 mm) in carbon to 11 µm in lead. Togel (4) gives the equation for calculating the effective layer thickness; the equation of calculation and geometry of the situation are shown in Figure 4. The problem of particle size effect is shown in Figure 5, where the specimen analyzed is neither homogenous nor representative in the effective layer analyzed for the wavelength of interest. This sample must be crushed and ground to obtain a representative, homogenous, effective layer thickness to be analyzed for the wavelength of interest shown (and for any longer wavelengths). Even then, the mineralogical effect may cause problems, which cannot be solved by any means other than fusion. We have seen first-hand the problems caused by the mineralogical effect when analyzing kyanite, sillimanite, and andalusite (three polymorphs of Al2O3·SiO2). In their pure form, each has the same weight percent of silica and alumina; however, using one as a standard to analyze the other can result in analysis totals ranging from 75% to 125%! Figure 6 illustrates the mineralogical effect on iron intensities from minerals prepared as pressed briquettes having the same particle size and concentration of iron. Because the compositions of mineral deposits vary from one location to the next, in addition to substituting various elements as contaminants in the crystal structures, it is virtually impossible to closely match the matrix of standards to unknowns using the pressed powder technique; therefore highly accurate analyses at high concentration levels are difficult if not impossible for many natural materials.
Gases, Liquids, Loose Powders, and Metals
Figure 5: Particle size and homogeneity effects (adapted with permission from Bruker).

The analysis of gases is not practical with an XRF spectrometer, although it is possible. To be sure, there are many other analytical techniques better suited to this task. The specimen preparation for liquids and loose powders is a matter of choosing the appropriate equipment and accessories, and it is better demonstrated in a workshop environment such as at the annual XRF course at ICDD in Newtown Square, Pennsylvania (5), or at the Denver X-ray Conference Workshop on XRF Sample Preparation (6). Metals are also a matter of trial and error, with the properties of hardness and smearing weighing heavily on the choice of cutting tool, sanding device, or sanding material (7). In any case, the surface should be renewed whenever it has changed, and that depends on the element and the material it is in. Selecting the sample spinner on the spectrometer will remove the problem of groove orientation affecting intensities. And in any case, the same fundamental concepts of infinite thickness and effective layer thickness (described above) apply no matter the physical state of the material.
Pressed Powders Technique
Figure 6: Mineralogical effect on iron intensities from minerals prepared as pressed powders having the same particle size and concentration of iron.

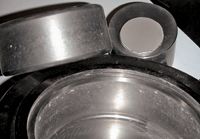
Now that the question of "How long should I grind?" has been answered, we can take a closer look at the grinding and pressing (also known as briquetting or pelletizing) process. There are many different types of grinding equipment, and the size of the specimen and briquette have to be taken into consideration when choosing one, as well as the standard sizes and characteristics of the manufacturer of the XRF instrument being used. The typical size of a briquette made for a typical XRF spectrometer ranges from 30 to 40 mm in diameter, and involves about 5 g of sample and 1 g of binder. Figure 7 shows a briquette (pressed pellet) of cement. The powder was poured into an aluminum cap to provide stability to the pellet. Also shown are the ring, puck, and container in which the specimen was ground. The weight and motion of the ring and puck mill are quite efficient for reducing most oxide materials down to about 30â40 µm particle size in about 3â4 min. Grinding further will lead to agglomeration of the particles, thus defeating the purpose of the grinding exercise. Adding a binder is necessary for the stability of the briquette, depending on the friability of the material. Anzelmo and colleagues (8) describe adding a grinding aid that greatly facilitates the uniformity of the particle size reduction, eliminates contamination from the grinding media and from the sample sticking to the grinding media, speeds up the cleaning process, and reduces dust during the cleaning process. Manual or automatic presses operating between 20,000 lb and 40,000 lb have been found adequate as long as the time of the pressing procedure remains constant. After the grinding equipment, additives, and backing equipment are decided on, the final step is to determine the optimum grinding time, given the goal of achieving the correct effective layer thickness for all wavelengths of interest. Figure 8 shows plots of grinding time versus intensity for various briquettes. The intensities are changing with different grinding times, so in addition to finding the time to achieve the appropriate effective layer thickness for each wavelength of interest, it is desirable to find a time when intensities are not changing drastically with time.
Figure 7: Pressed powder briquette and ring and puck grinding equipment.
When should one use the pressed powder technique? When parameters such as high speed of analysis, low skill level for preparation, small concentration range of calibration, and lowest limit of detection are involved, the pressed powder technique may serve the purpose adequately. The technique can be especially useful when working with man-made products, because the material being analyzed is well known and characterized when the process is working correctly; secondary standards can be collected and analyzed by wet and alternative methods to provide "matrix matched" standards, allowing the prospect of a highly accurate analysis. A problem arises with the technique when the process is not working correctly, and the unknowns are then not matrix matched. This presents a challenging if not unacceptable situation to a process control situation requiring accurate analyses.
Fusion Bead (Glass Disk) Technique
Figure 8: Grinding time determination (adapted with permission from Bob Tuttle).
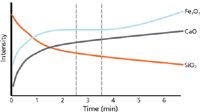
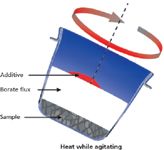
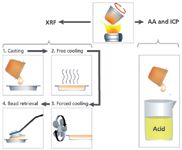
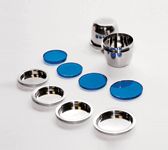
The borate fusion technique shown in Figure 9 consists of mixing a ground sample with a borate flux (lithium or sodium) inside a 95% platinum, 5% gold crucible, heating to about 1000 °C with agitation until the flux melts, and then dissolving the sample homogeneously in the flux (10). The choice of lithium borate or sodium borate depends on the application, but lithium borates are more commonly used because of the greater retention of moisture on the surface of the glass disks with sodium borate flux, and the desire to analyze for sodium. Lithium borates exist as lithium tetraborate (Li2B4O7), and lithium meta-borate (LiBO2). It is not necessary to melt the sample, so temperatures above 1100 °C are not necessary and can adversely affect the retention of volatiles and flux. A nonwetting agent (bromide or iodide) can be added when integrated into the flux, or independently, depending on the application. All oxides dissolve in borate flux, so it is essential to make sure the sample is oxidized. Metals alloy with the platinum forming a eutectic, which lowers the melting point of the platinum and results in its destruction. If the sample is not oxidized fully, it may be necessary to add an oxidizer to the sampleâflux mixture, and heat at a lower temperature to start, and then raise the temperature after the oxidation process has taken place. Careful observation of the oxidation process will allow commonly analyzed volatiles such as sulfur (9,10) and even chlorine to be analyzed. After the sample is completely dissolved in the flux, the casting process can be performed by pouring the melt into a heated 95% platinum, 5% gold mold. This particular alloy of platinum is chosen to prevent wetting (sticking) of the bead to the mold. The cast glass disk is cooled quickly at first to freeze the bead in the amorphous (glass) state, and then it is cooled faster over a period of time with forced air to relieve the stresses in the glass disk from the initial drop in temperature when first cast and to allow the bead to be retrieved by hand for analysis. The entire process is shown in Figure 10. Glass disks made from different materials and cast into molds of different sizes are shown in Figure 11 along with their crucibles.
Figure 9: Fusion procedure.
The process can be performed manually with a Meker burner and a ring stand or with a good muffle furnace. Automatic fusion machines, electric or gas (propane or natural gas), can produce multiple glass disks automatically depending on how many positions they have (typically one to six). For the highest sample throughput, it is possible to use a robot to automate the entire process, including the weighing and flux dispensing step.
The advantages of fusion are listed below:
- Eliminates the particle size effect
- Eliminates mineralogical effects
- Provides excellent homogeneity and flatness
- Creates perfectly matrix matched standards and unknowns
- Allows for matrix correction when previously not possible
- Provides the highest accuracy
- Can use with the synthetic standards for calibrations, when reference standards are otherwise not available
Figure 10: Fusion casting procedure.
- Easy to produce "defendable" analyses (traceable to International Primary Reference Standards)
- Can provide wide-range (universal) calibrations
- Should be used whenever it is not known if the standards and unknowns are not matrix matched. This is often the case when working with materials from nature (minerals mining, clays, ores, geological, and soils). It is also used in the case where man-made products are mixed with other man-made products and also products from nature such as blended cements, catalysts, electronic materials, and high-tech composite materials.
Fusion should be used whenever it is not known if the standards and unknowns are matrix matched. This is often the case when working with materials from nature, such as mining samples, minerals, clays, ores, geological, soils, wastes, and environmental samples. It is also used in the case where man-made products are mixed with other man-made products and also with products from nature such as blended cements, polymers with additives, catalysts, electronic materials, and high-tech composite materials.
Figure 11: Platinum crucibles and molds (top and bottom) and fusion beads of different sizes from different materials.
These samples are difficult if not impossible to matrix-match with standards. An everyday example of this problem is the analysis of SiO2 in raw mix used in the manufacturing of cement (9,10). The plot on the left in Figure 12 shows the calibration curve made for SiO2 in raw mix from three cement plants (denoted by the triangle, circle, and x symbols). The scatter around the line is unacceptable and cannot even be made into straight lines by separating out each plant. Mathematical interelement corrections will not improve this situation because the problem is not from absorption-enhancement effects; it is from the mineralogical effect and can only be solved by fusion. The middle plot shows that the points have now moved very close to the line after fusion, giving acceptable accuracy expectations when analyzing unknowns. The plot on the right shows even more improvement after mathematical corrections are applied. Mathematical corrections are now possible because the larger, dominating error from the mineralogical effect has been removed, allowing the smaller error from absorption enhancement to be reduced (and to be able to see the improvement).
Conclusion
The choice of specimen preparation for XRF analysis is critical to achieving the accuracy desirable. The choice between pressed
Figure 12: SiO2 calibration of raw materials from three cement plants before (pressed powder preparation) and after fusion bead preparation (adapted with permission from Thermo/ARL).

powder briquettes and fused glass disks is actually easy to make when one knows whether the samples are matrix-matched or not. If the standards and unknowns are not known with certainty to be matrix-matched, then fusion is the safe choice to ensure that a ridiculous analysis is not reported. For more detail about the concepts and practices of these techniques, we recommend attending the training course and workshop noted in references 5 and 6.
References
(1) Bruker webinar, "The Final Faceoff: Fused vs Pressed," available at: .
(2) J.A. Anzelmo, M. Bouchard, and M.E. Provencher, Spectroscopy 28(7), 16â23 (2013).
(5) ICDD annual Practical XRF course, available at: http://www.icdd.com/education/xrf.htm.
(6) Denver X-ray Conference XRF sample preparation workshop, available at: http://www.dxcicdd.com/14/program.htm#workshops.
(7) V. Buhrke, R. Jenkins, and D. Smith, Preparation of Specimens for X-ray Fluorescence and X-ray Diffraction Analysis (Wiley-VCH, New York, 1998), pp. 83â100.
(8) J.A. Anzelmo, A. Seyfarth, and L. Arias, Adv. X-Ray Anal. 43, (2000). Available at: http://www.icdd.com/resources/axasearch/search_based_on_vol.asp?vol_num=44.
(9) M. Bouchard, J.A. Anzelmo, S. Rivard, A. Seyfarth, L. Arias, K. Behrens, and S. Durali-Muller, Adv. X-Ray Anal. 53, 263â279 (2010).
(10) M. Bouchard, J.A. Anzelmo, S. Rivard, A. Seyfarth, L. Arias, K. Behrens, and S. Durali-Muller, Adv. X-Ray Anal. 54, 247â265 (2011).
(11) "Spectrographer's News Letter," Applied Research Laboratories XIII, 3 (1960).
John A. Anzelmo

John A. Anzelmo is the president of Claisse USA in Madison, Wisconsin. He is also the ICDD XRF Technical Program Director for the International Centre for Diffraction Data in Newtown Square, Pennsylvania.
Marie-Ève Provencher

Marie-Ãve Provencher is a Technical Representative (M.Sc. Chemist) with Corporation Scientifique Claisse in Quebec City, Quebec, Canada.
Mathieu Bouchard

Mathieu Bouchard is the Fusion and XRF Applications Manager (M.Sc. Chemist) with Corporation Scinetifique Claisse in Quebec City, Quebec, Canada.
LIBS Illuminates the Hidden Health Risks of Indoor Welding and Soldering
April 23rd 2025A new dual-spectroscopy approach reveals real-time pollution threats in indoor workspaces. Chinese researchers have pioneered the use of laser-induced breakdown spectroscopy (LIBS) and aerosol mass spectrometry to uncover and monitor harmful heavy metal and dust emissions from soldering and welding in real-time. These complementary tools offer a fast, accurate means to evaluate air quality threats in industrial and indoor environments—where people spend most of their time.
Atomic Perspectives: Highlights from Recent Columns
March 3rd 2025“Atomic Perspectives,” provides tutorials and updates on new analytical atomic spectroscopy techniques in a broad range of applications, including environmental analysis, food and beverage analysis, and space exploration, to name a few. Here, we present a compilation of some of the most popular columns.