X-ray Diffraction and Fluorescence Spectroscopy Analysis of Sm3+ in Lithium Calcium Silicate
Here, Li2CaSiO4:Sm3+ reddish orange phosphors were synthesized by a solid-state reaction method and examined by spectroscopic methods.
Trivalent samarium–doped lithium calcium silicate phosphors with the nominal formulas of Li2Ca1-xSmxSiO4 were prepared with a conventional solid-state reaction technique and the dopant concentration was varied in the range of 0.01 ≤ x ≤ 0.10. The phase and structure of the as-prepared samples were characterized using X-ray diffraction. The excitation and emission spectra were measured to characterize the luminescent properties of the Li2CaSiO4:Sm3+ phosphors. The excitation and emission spectra at room temperature show the typical f–f transitions of Sm3+. The dominant excitation line is around 408 nm because of the 6 H5/2→4K11/2 transition. The emission spectrum of all phosphors exhibited four sharp emission peaks corresponding to the 4G5/2→6H5/2 (565 nm), 4 G5/2→6H7/2 (601 nm), 4G5/2→6H9/2 (654 nm), and 4G5/2→6H11/2 (708 nm) transitions of Sm3+. The emission intensity depended on the Sm3+ concentration and it was observed that the optimum concentration of Sm3+ in phosphor was 4 mol% for the highest emission intensity at 601 nm.
Luminescence materials are important for modern technology because of their ability to convert electromagnetic radiation (that is, ultraviolet [UV] and infrared [IR] light) into visible light (1). Recently, the development of rare earth, ion-activated, novel luminescent materials have attracted more attention because of their potential applications in optical display systems (2–9). Because the 4f electrons in rare earth ions are shielded by the outer 5s and 5p electrons, the intra-4f emission spectra of rare earth ions are characterized by narrow lines with high color purity (10).
The Sm3+ ion is widely used as an activator of reddish orange emission because of its 4 G5/2→6HJ (J = 5/2, 7/2, 9/2, and 11/2) transitions (11–16), which is the most suitable source for lighting and display, from a practical viewpoint. Moreover, Sm3+ ions act as a spectroscopic probe of local structure around rare-earth ions in condensed matter. This is because of the electric-dipole (ED) character of the 4 G5/2→6H9/2 hypersensitive transition, whose intensity increases as the environmental symmetry of the luminescent site decreases (17). Those investigations of Sm3+ -doped materials mainly focused on the host matrixes, which included borates (18), silicates (19), and vanadates (20).
In this article, Li2CaSiO4:Sm3+ reddish orange phosphors were synthesized by a solid-state reaction method. The photoluminescence of the phosphors was systematically investigated using a spectrofluorometer at room temperature. Also, the dependence of the emission intensity on the Sm3+ concentration for the Li2Ca1-xSmxSiO4 (0.01 ≤ x ≤ 0.10) was studied in detail.
Experimental
Li2Ca1-xSmxSiO4 (x = 0.01, 0.02, 0.03, 0.04, 0.05, 0.06, 0.07, 0.08, 0.09, and 0.10) phosphors were prepared according to a standard solid-state technique (Table I). The starting materials were Li2CO3, CaCO3, SiO2, and Sm2O3 (all materials were analytical grade). The raw materials were weighed according to the stoichiometric proportions. The chemicals were ground in an agate mortar at room temperature and later were collected into an alumina crucible for heating. First, the powder mixtures were calcined at 450 °C for 1 h. After grinding and the homogenization of preannealed mixtures, the mixtures were heat treated at 600 °C for 1 h and 850 °C for 2 h.
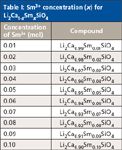
Table I: Sm3+ concentration (x) for Li2Ca1-xSmxSiO4
The structural characterization of the fine powders was performed by X-ray diffraction (XRD) analysis using a Bruker AXS D8 Advance diffractometer. The system was run at 20–60 kV and 6–80 mA, 2Θ = 10–90° and a step of 0.002° using the CuKα line of 1.5406 A° (quartz [PDF 46-1045] was used as reference material for XRD). Scanning electron microscopy (SEM) images were taken with a FEI Quanta 250 FEG model scanning electron microscope using an accelerating voltage of 20 kV.
All the luminescence characteristics of these phosphors were investigated at room temperature using a Thermo Scientific Lumina fluorescence spectrometer equipped with a 150-W xenon lamp.
Results and Discussion
The XRD pattern of pure and Sm3+-doped Li2CaSiO4 is presented in Figure 1, which is in agreement with the XRD data of Li2CaSiO4 presented by Liu and colleagues (21). The result indicates that the diffraction peak positions of the prepared sample are well matched with the standard powder diffraction file (Contrast JCPDS-27-0290). In the Li2CaSiO4 crystal structure, the Ca atom occupies the 8-coordinated distorted dodecahedral site. The divalent calcium site is substituted by the trivalent samarium ions because the Sm3+ ions (0.96 Å) are expected to occupy the Ca2+ (0.99 Å) sites in the Li2CaSiO4 host and no Sm3+ ion is expected to occupy the Li+ sites (0.68 Å) (22,23). According to the XRD phase analysis, the Sm3+ substitutes Ca2+ without disturbing the Li2CaSiO4 crystal lattice.
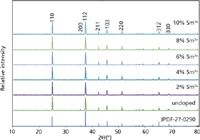
Figure 1: XRD patterns (CuKα radiation) obtained for Li2Ca1-xSmxSiO4 (x = 0, 0.02, 0.04, 0.06, 0.08, and 0.10).
When trivalent rare earth ions are incorporated into the host material, it is usually considered that rare earth ions occupy mainly divalent M2+ (Ca, Sr, and Ba) sites (24–32). Therefore, the substitution on Ca2+ sites in Li2CaSiO4 needs charge compensation mechanisms, which can be described as

Figure 2 shows the images obtained from the SEM of the phosphors calcined at 850 °C for 2 h using solid-state reactions. The microstructures of the phosphor consisted of regular fine grains.
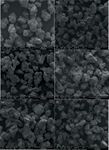
Figure 2: The SEM images of (a) Li2CaSiO4, (b) Li2CaSiO4:2%Sm3+, (c) Li2CaSiO4:4%Sm3+, (d) Li2CaSiO4:6%Sm3+, (e) Li2CaSiO4:8%Sm3+, and (f) Li2CaSiO4:10%Sm3+ phosphors.
Figure 3 shows the excitation spectra of undoped Li2CaSiO4 and 4 mol% Sm3+ :Li2CaSiO4 in the range of 190–500 nm by monitoring the 604-nm emission. In the longer wavelength region, the f–f transitions within the Sm3+ 4f5 configuration can be detected, which is assigned as transition from the 6H5/2 ground state to the corresponding excited state of Sm3+ listed in Table II. Among the sharp lines, the strongest peak centered at 408 nm is assigned to 6H5/2→4K11/2 (33).
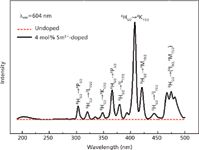
Figure 3: Excitation spectra of undoped and 4 mol% Sm3+: Li2CaSiO4 phosphor (λem = 604 nm).
Figure 4 shows the emission spectra of Li2Ca1-xSmxSiO4 (x = 0.01, 0.02, 0.03, 0.04, 0.05, 0.06, 0.07, 0.08, 0.09, and 0.10) under the excitation of 407 nm at room temperature. The emission spectrum of all phosphors exhibited four sharp emission peaks corresponding to 4G5/2→6H5/2 (565 nm), 4G5/2→6H7/2 (601 nm), 4G5/2→6H9/2 (654 nm), and 4G5/2→6H11/2 (708 nm) transitions of Sm3+. When Sm3+ occupies a site coinciding with a center of symmetry, 4G5/2→6H7/2 is forbidden as an electric dipole, but allowed as a magnetic dipole (34). The 4G5/2→6H9/2 transition is allowed as an electric dipole while the Sm3+ ion is situated at a site that lacks the inversion symmetry (35).
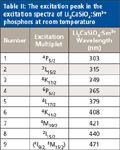
Table II: The excitation peak in the excitation spectra of Li2CaSiO4:Sm3+ phosphors at room temperature
The dependence of the emission intensity on the Sm3+ concentration for the Li2Ca1-xSmxSiO4 (x = 0.01, 0.02, 0.03, 0.04, 0.05, 0.06, 0.07, 0.08, 0.09, and 0.10) is shown in Figure 5. It is well-known that in phosphor materials, photon emission intensity of rare earth activator ions has an optimum concentration (36). It is difficult for the phosphor materials to exhibit efficient emission when the rare earth activator ion concentration is too low. On the other hand, the cross-relaxation interaction between the nearest rare earth activator ions will quench the emission if the rare earth activator ions exceed their optimum concentration. The experimental result revealed that the luminescence intensity of Sm3+ -doped Li2CaSiO4 increased with the Sm3+ dopant concentration. The luminescence intensity reached its maximum when the concentration of Sm3+ was at about 4% (Figure 3) and then decreased with concentration because the increase of the Sm3+ dopant concentration increased the cross-relaxation between two neighboring Sm3+ ions and therefore quenched the emission. The process of cross-relaxation results from the nonradiative electric dipole–electric quadrupole transition from the 4G5/2 energy level.
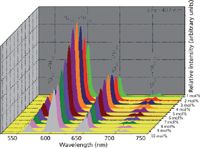
Figure 4: Photoluminescence spectra of the Li2Ca1-xSmxSiO4 (0.01 ⤠x ⤠0.10) phosphors (λex = 407 nm).
Conclusions
In summary, we have successfully synthesized Li2CaSiO4:Sm3+ reddish orange phosphors by using a solid-state reaction method at 850 °C and investigated their structural properties using X-ray powder diffraction analysis. Undoped Li2CaSiO4 was not shown to have the photoluminescence property. The relationship between the luminescent intensity and the concentration of activated Sm3+ ions shows that there is concentration quenching of Sm3+ in the host Li2CaSiO4, and the critical concentration is 4 mol%.
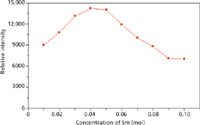
Figure 5: Emission intensity as a function of Sm3+ concentration (x) for Li2Ca1-xSmxSiO4 (0.01 ⤠x ⤠0.10).
Acknowledgment
The authors would like to thank Professor Orhan Türkoğlu (Erciyes University) for the use of the XRD instrument.
References
(1) I.M. Nagpure, K.N. Shinde, V. Kumar, O.M. Ntwaeaborwa, S.J. Dhoble, and H.C. Swart, J. Alloys Compd. 492, 384–388 (2010).
(2) H. Yokota, M. Yoshida, H. Ishibashi, T. Yano, H. Yamamoto, and S. Kikkawa, J. Alloys Compd. 495, 162–166 (2010).
(3) L. Zhou, J. Huang, F. Gong, Y. Lan, Z. Tong, and J. Sun, J. Alloys Compd. 495, 268–271 (2010).
(4) X.M. Zhang, X.B. Qiao, and H.J. Seo, J. Electrochem. Soc. 157, J267–J269 (2010).
(5) M.A.K. Elfayoumi, M. Farouk, M.G. Brik, and M.M. Elokr, J. Alloys Compd. 492, 714–716 (2010).
(6) X.W. Zhu, Y. Masubuchi, T. Motohashi, and S. Kikkawa, J. Alloys Compd. 489, 157–161 (2010).
(7) X.M. Zhang and H.J. Seo, J. Alloys Compd. 503, L14–L17 (2010).
(8) S.S. Yao, Y.Y. Li, L.H. Xue, and Y.W. Yan, J. Alloys Compd. 491, 264–267 (2010).
(9) K. Shioi, N. Hirosaki, R.-J. Xie, T. Takeda, and Y.Q. Li, J. Alloys Compd. 504, 579–584 (2010).
(10) Z. Xia and D. Chen, J. Am. Ceram. Soc.93, 1397–1401 (2010).
(11) Z.H. Ju, R.P. Wei, J.X. Ma, C.R. Pang, and W.S. Liu, J. Alloys Compd. 507, 133–136 (2010).
(12) J. Mu, L. Liu, and S. Kang, Nanoscale Res. Lett. 2, 100–103 (2007).
(13) Y. Zhou, J. Lin, and S. Wang, J. Solid State Chem. 171, 391–395 (2003).
(14) E. De la Rosa, L. Diaz-Torres, P. Salas, and R. Rodriguez, Opt. Mater. 27, 1320–1325 (2005).
(15) I. Pekgözlü, J.Lumin. 132, 13 (2013).
(16) I. Pekgözlü and S. Çakar, J.Lumin. 132(9), 2312 (2012).
(17) A. Patra, D. Kundu, and D. Ganguli, Mater. Lett. 32, 43–47 (1997).
(18) B. Vengala Rao, U. Rambabu, and S. Buddhudu, Mater. Lett. 61, 2868–2871 (2007).
(19) G.S.R. Raju and S. Buddhudu, Spectrochim. Acta A 70, 601–605 (2008).
(20) W.J. Park, M.K. Jung, T. Masaki, S.J. Im, and D.H. Yoon, Mater. Sci. Eng. B 146, 95–98 (2008).
(21) J. Liu, J.Y. Sun, and C.S. Shi, Mater. Lett. 60, 2830–2833 (2006).
(22) B. Lei, H. Zhang, W. Mai, S. Yue, Y. Liu, and S. Man, Solid State 13, 525-528 (2011).
(23) R.C. Weast, CRC Handbook of Chemistry and Physics (CRC Press, Boca Raton, Florida, 1989) pp. pF-187
(24) H. Liang, Q. Su, Y. Tao, T. Hu, and T. Liu, J. Alloys Compd. 334, 293–298 (2002).
(25) R. Ternane, M.T. Cohen-Adad, G. Panczer, C. Goutaudier, C. Dujardin, G. Boulon, N. Kbir-Ariguib, and M. Trabelsi-Ayedi, Solid State Sci. 4, 53–59 (2002).
(26) G. Blasse, J. Solid State Chem. 14, 181–184 (2002).
(27) B. Piriou, D. Fahmi, J. Dexpert-Ghys, A. Taitai, and J.L. Lacout, J. Lumin. 39, 97–103 (1987).
(28) Y.K. Voronko, G.V. Maksimova, and A.A. Sobol, Opt. Spectrosc. (USSR) 70, 203–207 (1991).
(29) A. Zounani, D. Zambon, and J.C. Cousseins, J. Alloys Compd. 207, 94–98 (1994).
(30) A.O. Wright, M.D. Seltzer, J.B. Gruber, and B.H.T. Chai, J. Appl.Phys. 78, 2456–2467 (1995).
(31) R. Ternane, M.T. Ayedi, N.K. Ariguib, and B. Piriou, J. Lumin. 81, 165–169 (1999).
(32) R. El Ouenzerfi, N.K. Ariguib, M.T. Ayedi, and B. Piriou, J. Lumin. 85, 71–75 (1999).
(33) J.B. Gruber, B. Zandi, and M.F. Reid, Phys. Rev. B: Condens. Matter 60, 15643–15648 (1999).
(34) P.S. May, D.H. Metcalf, F.S. Richardson, R.C. Carter, C.E. Miller, and R.A. Palmer, J. Lumin. 51, 249–268 (1992).
(35) G. Lakshminarayana and S. Buddhudu, Phys. Rev. B: Condens. Matter 373, 100–106 (2006).
(36) T. Kano, Phosphor Handbook (CRC, Boca Raton, Florida, 1999), p. 185.
(37) G. Blasse, J. Lumin. 2, 766–777 (1970).
Ertuğrul Erdoğmuş and Í. Pekgözlü are with the Faculty of Engineering in the Department of Environmental Engineering Bartin University in Bartin, Turkey. Esra Korkmaz is with the Faculty of Science and Arts in the Department of Chemistry at Bozok University in Yozgat, Turkey. Direct correspondence to: ertugrulerdogmus67@gmail.com
New Study Reveals Insights into Phenol’s Behavior in Ice
April 16th 2025A new study published in Spectrochimica Acta Part A by Dominik Heger and colleagues at Masaryk University reveals that phenol's photophysical properties change significantly when frozen, potentially enabling its breakdown by sunlight in icy environments.
Tracking Molecular Transport in Chromatographic Particles with Single-Molecule Fluorescence Imaging
May 18th 2012An interview with Justin Cooper, winner of a 2011 FACSS Innovation Award. Part of a new podcast series presented in collaboration with the Federation of Analytical Chemistry and Spectroscopy Societies (FACSS), in connection with SciX 2012 ? the Great Scientific Exchange, the North American conference (39th Annual) of FACSS.
Advancing Corrosion Resistance in Additively Manufactured Titanium Alloys Through Heat Treatment
April 7th 2025Researchers have demonstrated that heat treatment significantly enhances the corrosion resistance of additively manufactured TC4 titanium alloy by transforming its microstructure, offering valuable insights for aerospace applications.
New Fluorescence Model Enhances Aflatoxin Detection in Vegetable Oils
March 12th 2025A research team from Nanjing University of Finance and Economics has developed a new analytical model using fluorescence spectroscopy and neural networks to improve the detection of aflatoxin B1 (AFB1) in vegetable oils. The model effectively restores AFB1’s intrinsic fluorescence by accounting for absorption and scattering interferences from oil matrices, enhancing the accuracy and efficiency for food safety testing.