A Novel Fluorescence Sensor Based on the Tetrakis (4-Carboxyphenyl) Porphyrin (TCPP)-Hg2+ System for Glutathione (GSH) Detection
Glutathione (GSH) is an intracellular thiol that plays a major role in biological systems. Therefore, the development of effective probes that can detect GSH elicits significant attention.
This article discusses our development of a turn-on fluorescence sensor based on the tetrakis (4-carboxyphenyl) porphyrin (TCPP)-Hg2+ system for highly selective fluorescence detection of GSH. This is the first time TCPP has been used to detect GSH. A drastic decrease of TCPP fluorescence intensity was induced by Hg2+. The reason is that the pair of electrons of the nitrogen atom is transferred to the vacant d orbital of Hg2+. However, the fluorescence of the TCPP-Hg2+ system is turned to the “on” state when a concentration of GSH was added in the system, attributed to the stronger binding force between GSH and Hg2+. The small concentration of GSH needed to induce the fluorescence response indicates that the TCPP-Hg2+ system can be used as a sensitive GSH fluorescence sensor. The sensor showed a linear response varying from 0.02 μM to 22.67 μM, with a detection limit of 0.43 nM. The proposed sensor displayed good selectivity and high sensitivity for GSH. The sensor was applied successfully for GSH on various sample types.
Glutathione (GSH) is the most abundant thiol in animal cells and plays a vital role in biological regulation systems (1,2). It has been reported that GSH levels are relevant to cancer, human immunodeficiency viruses (HIV), and neurodegenerative diseases (3). GSH consists of glycine, cysteine, and glutamic acid, and can keep cysteine residues in the reduction state to protect enzyme activity (4,5). GSH plays an important role in gene regulation and intracellular signal transduction, along with intracellular redox activities (6,7). In addition, it can trap free radicals to protect cells against oxidative stress (8–10). Owing to these features, the development of highly selective and sensitive probes for biological thiols (11–13) has great significance. Until now, numerous analytical methods have been used to detect GSH, such as fluorescence sensing (14), surface-enhanced Raman scattering (15), electrochemical assays (16), and UV-vis techniques (17). Among these probes, fluorescent sensing is the most popular because of its great convenience as well as its high sensitivity and selectivity (18). Today, many fluorescent probes have been designed for detecting GSH. For instance, fluorescent probes based on TPPS4-Hg2+ (19), EDC-CQDS (20), AuNCs (21), (g-CNQD)-Hg2+ (2), and RhB-EDA-Hg2+ (22) have been reported.
Porphyrins are natural macrocyclic compounds that play a pivotal role in the metabolism of living organisms (23). They are also important in photodynamic therapy (PDT) of cancers (24). In addition, porphyrins possess special photoelectric properties, such as high fluorescence quantum yield, a large stock shift, and rich coordination chemistry (25–27). Therefore, porphyrins have been widely used in UV-vis detection systems, electrochemiluminescence analysis, and photoelectrochemical sensors.
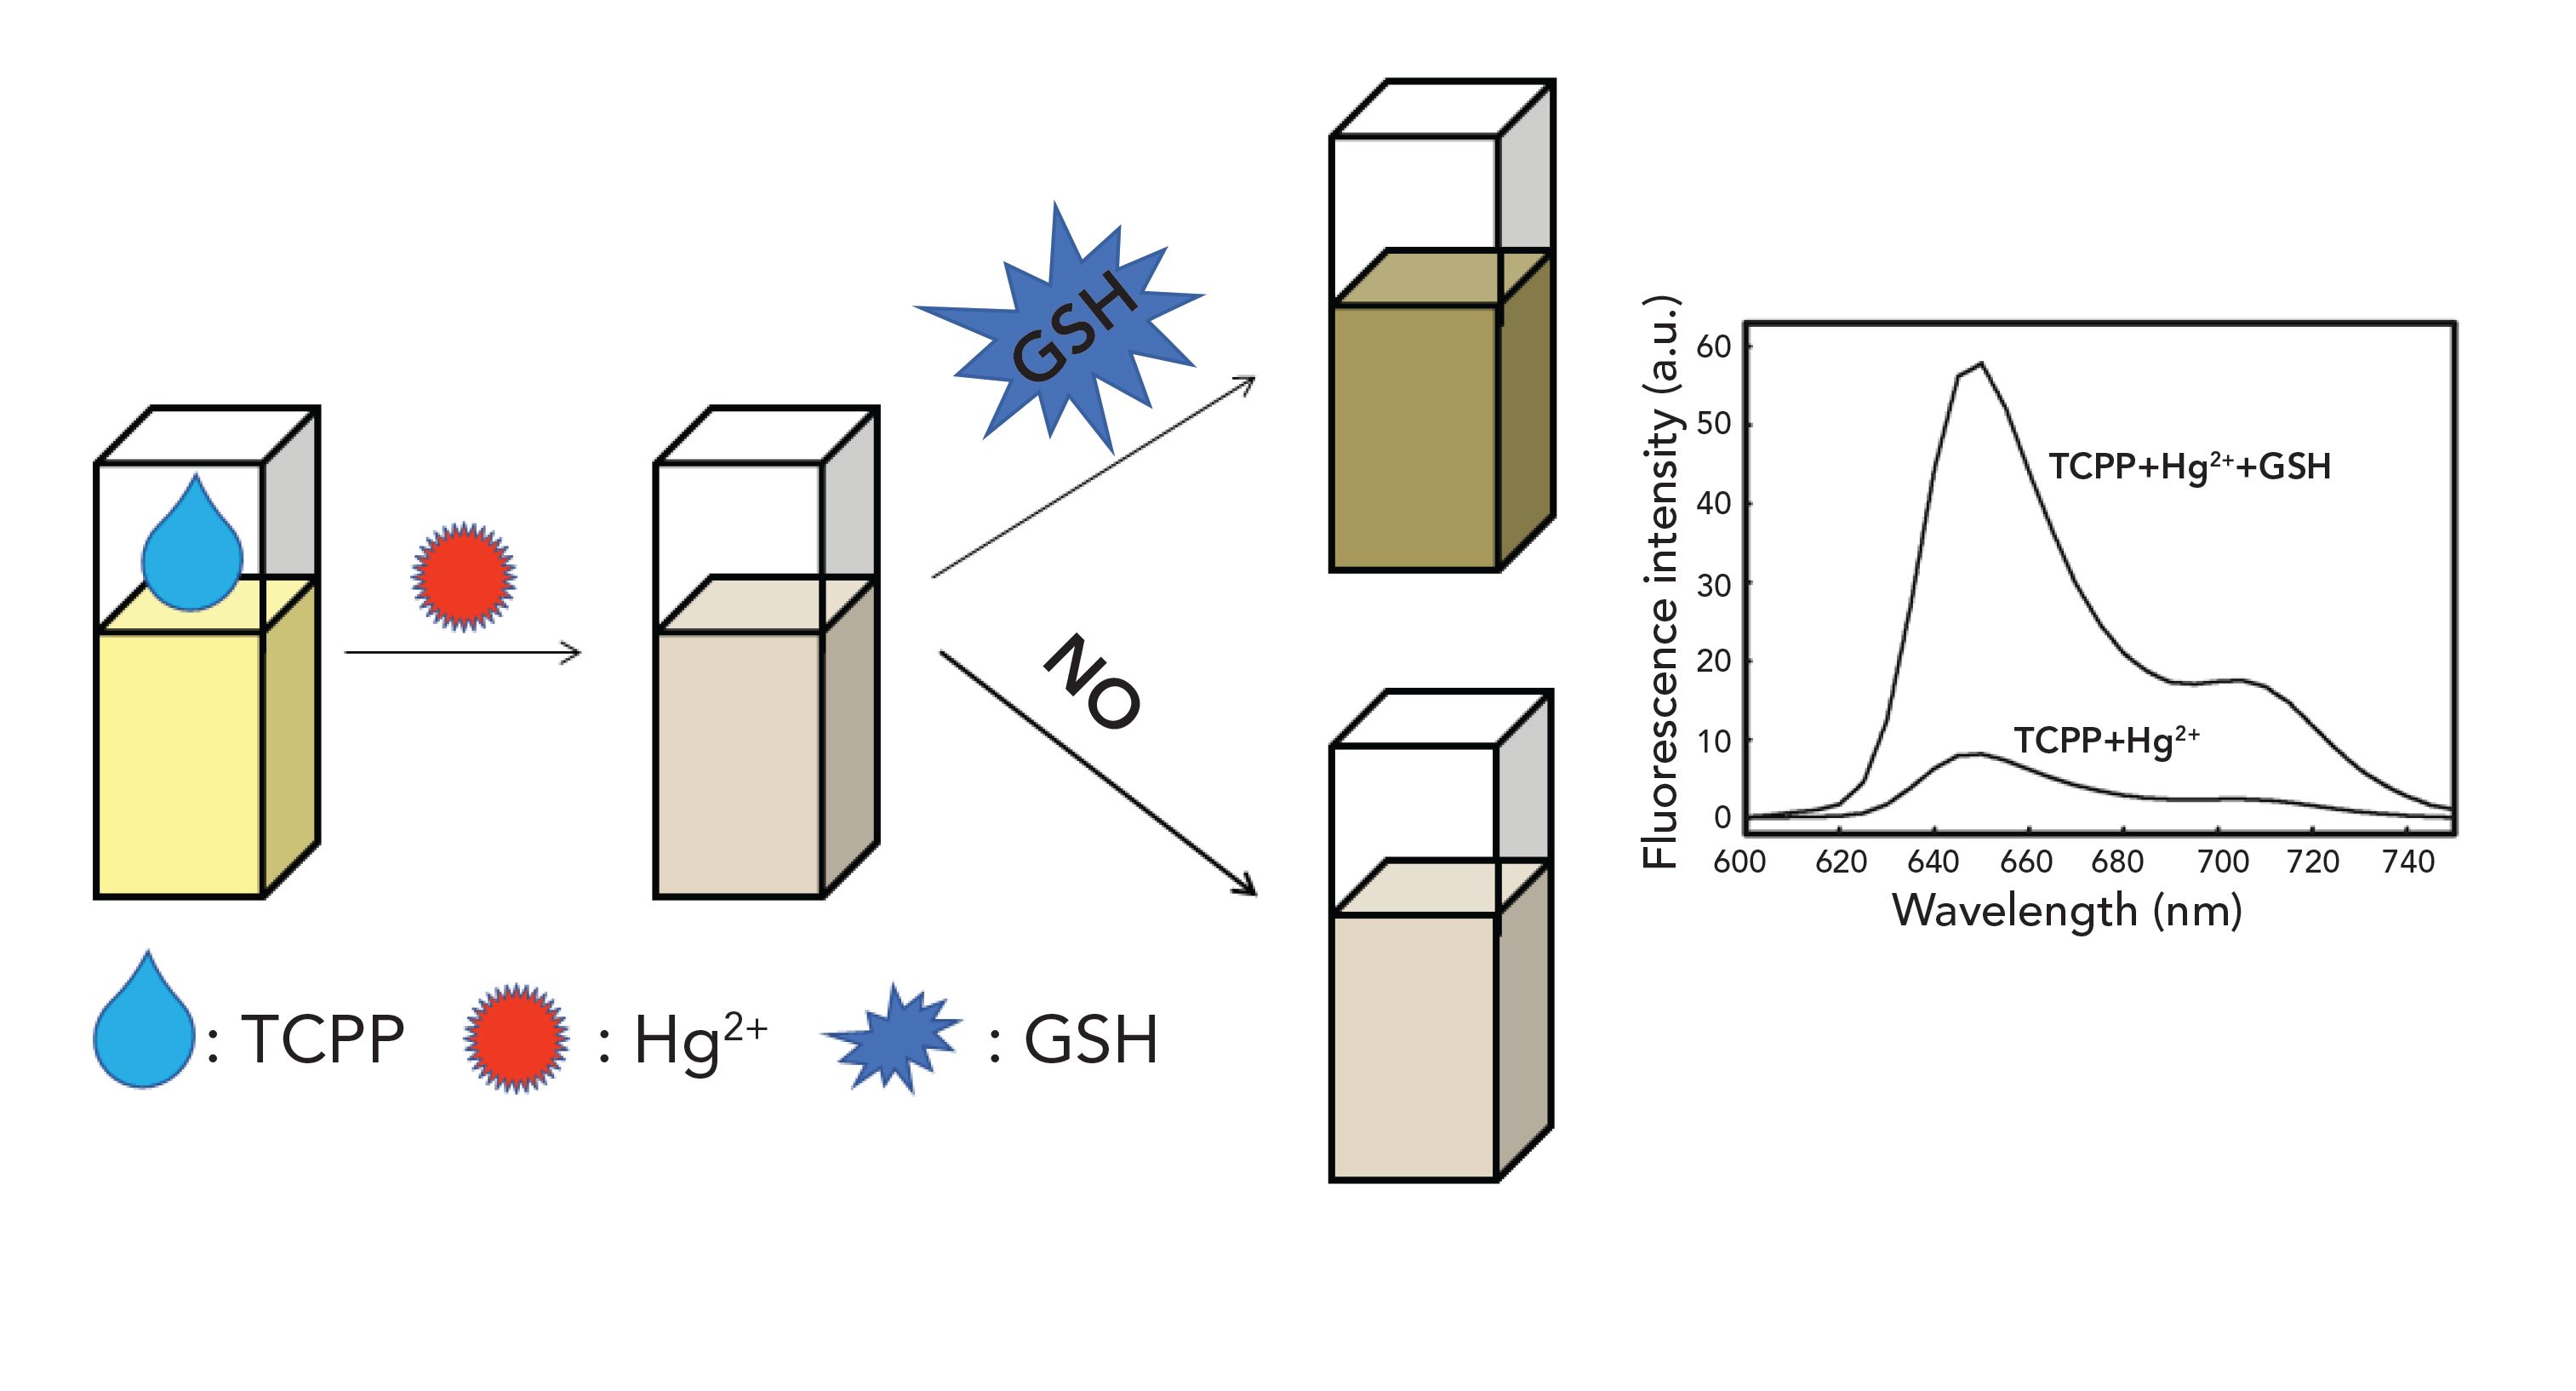
As a macrocyclic compound, porphyrin exhibits strong fluorescence in the visible region owing to the conjugated double bond system and the high mobility of its π-electron. Noticeable decreases of porphyrin fluorescence intensities have been observed in the presence of Hg2+. It is well known that Hg2+–GSH complexes have very high stability constants. In this work, when a certain concentration of GSH was added to the porphyrin Hg2+ system, the GSH was able to bind Hg2+ and remove it from the porphyrin–Hg2+ complex, which was attributed to the stronger binding force between GSH and Hg2+. Thus, a novel fluorescence probe based on the tetrakis (4-carboxyphenyl) porphyrin (TCPP) was designed for detecting GSH. In the TCPP–Hg2+ system, the fluorescence of TCPP was “off” (inactive) because of its coordination with Hg2+. The reason why the fluorescence was quenched in the presence of Hg2+ could be that the pair of electrons in the nitrogen atom transferred to the vacant d orbital of Hg2+. Adding GSH, however, the TCPP-Hg2+ turned the fluorescence “on” (activated it). The cause of this phenomenon is the stronger binding force between GSH and Hg2+ than that between the N atoms of the porphyrin ring and Hg2+. This “off-on” process was then used to detect GSH with sensitivity and efficiency, as illustrated in Figure 2. In addition, the proposed sensor displayed high sensitivity for GSH. The sensor was also applied successfully to the determination of GSH in different real samples.
FIGURE 1: The fluorescence spectra of TCPP under different concentrations of Hg2+ (from top to bottom, the concentrations of Hg2+ were 0 to 30 μM).
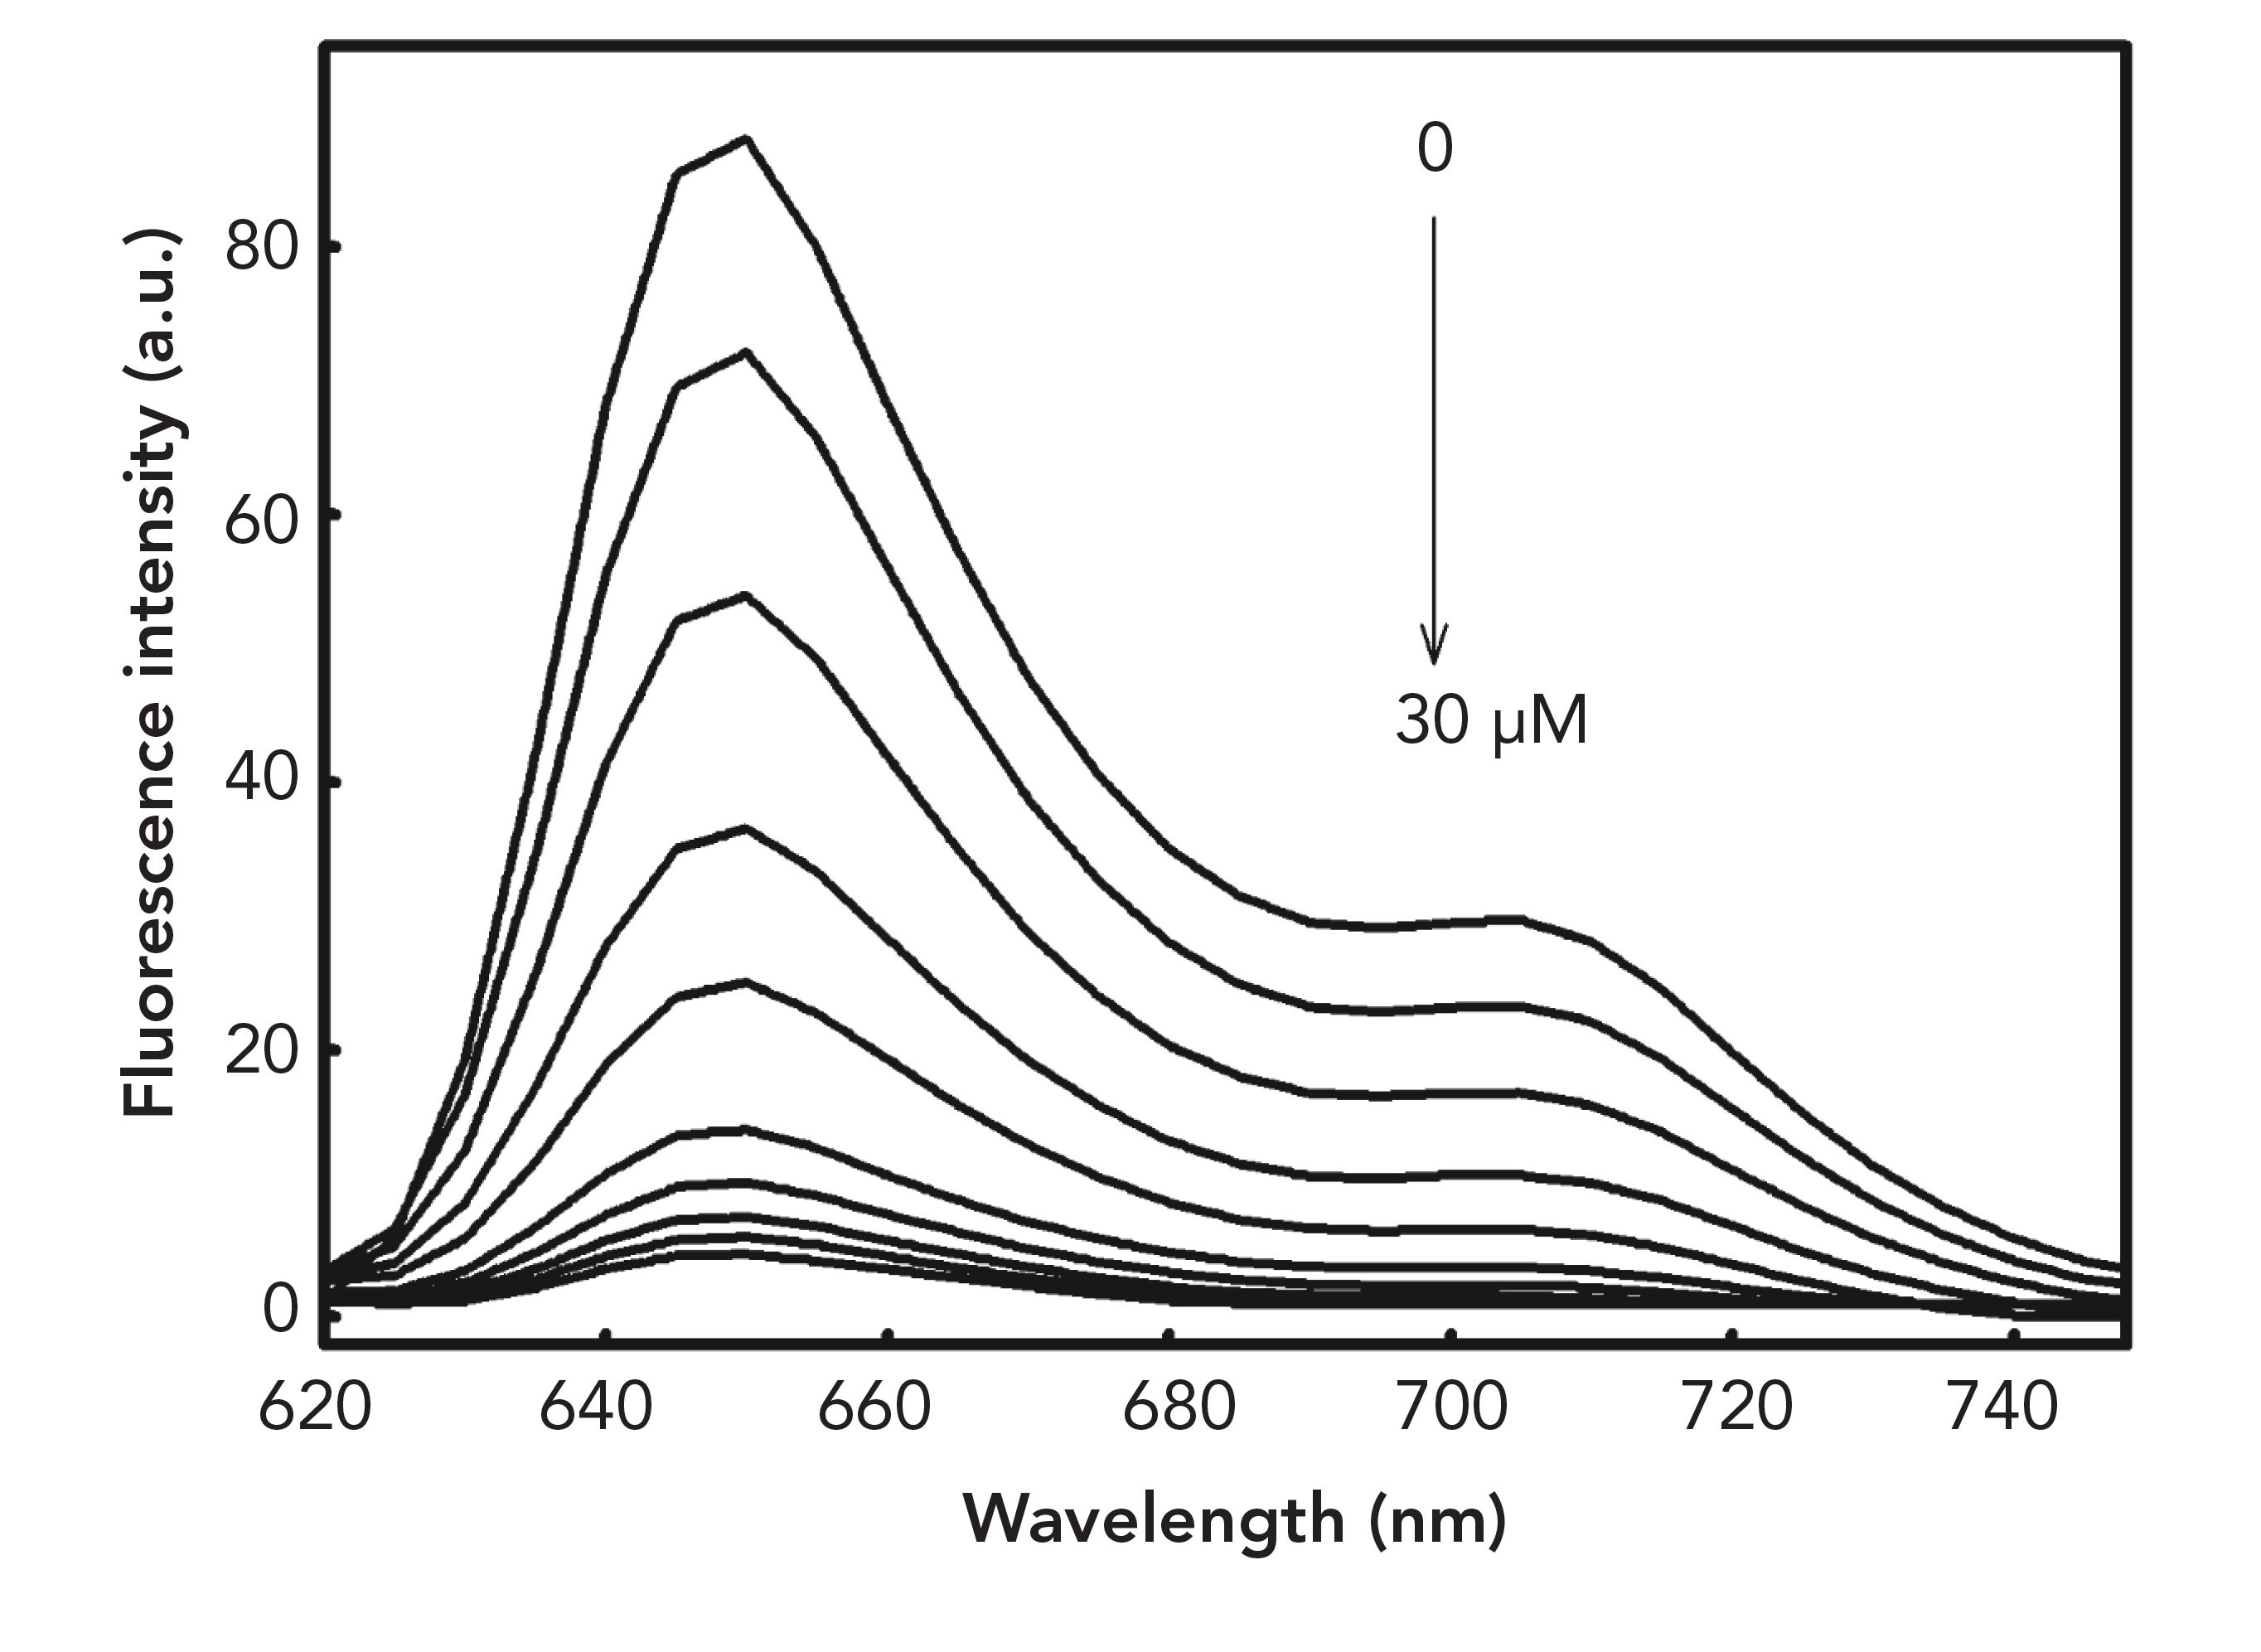
FIGURE 2: Schematic illustration of the principle of the “off-on” fluorescence sensor for GSH based on the TCPP-Hg2+ system.
Materials and Methods
Materials
TCPP, Cu(II) tetrakis (4-carboxyphenyl) porphyrin (CuTCPP), and mercury (II) chloride (HgCl2) were purchased from Sigma-Aldrich. The metal salts were obtained from Xiya Chemical Reagent Company. GSH and other amino acids including histidine, cysteine, glycine, arginine, alanine, lysine, leucine, and aspartic acid used in this work were obtained from Sinopharm Chemical Reagent Company. All of the chemicals were at least analytical grade, and the water used throughout all experiments was purified by a Milli-Q system.
Apparatus and Characterization
A WGY-10 fluorescence spectrophotometer was used to measure fluorescence. When measuring the fluorescence of TCPP, we set the excitation wavelength at 400 nm and the range of emission spectra at 650–700 nm. The excitation and emission silts were set at 5 and 10 nm, respectively. The UV spectrum measurements were performed on a Cary Varian spectrophotometer. The range of UV spectra was scanned from 350 nm to 500 nm.
Fluorescence Sensing of GSH
The detection of GSH by the sensor was carried out in Hepes (10 mM, pH = 7.0) buffer at room temperature. The 30 μL TCCP solution (0.4 mM) was added to a 1200 μL Hepes buffer (10 mM, pH = 7.0). The fluorescence of TCPP was measured by excitation at 400 nm and the emission spectra started from 650 nm and ended at 700 nm. A certain amount of Hg2+ ions was added to the solution, and then GSH was added to the solution gradually. The fluorescence was measured after 5 min. The fluorescence emission intensity was measured at 650 nm.
Determination of Detection Limit
The detection limit was obtained by the fluorescence titration. The fluorescence intensity of the TCPP-Hg2+ system was determined three times. The standard error was then calculated. The fluorescence intensity of the sensor was measured three times in the presence of GSH. Each average value of the fluorescence intensity was plotted as a GSH concentration. The slope of the line was obtained and the detection limit was calculated by Equation 1:
where SD is the standard deviation of the emission intensity of the TCPP-Hg2+ system and m is the slope between the emission intensity and concentration.
Testing in Real Samples
All fruit samples were purchased from a supermarket in Taiyuan, China. The samples were prepared in the same way as reported in the literature (28). First, the fruits were washed three times with distilled water before drying naturally and triturating. After that, supernatant and precipitation were separated by centrifugation via a refrigerated centrifuge at 5000 rpm for 10 min. Lastly, the supernatant was diluted to an appropriate concentration using distilled water. A human serum sample was obtained from the Affiliated Hospital of Shanxi Medical University. The procedure for treating the human serum sample was reported in the literature (7). First, the sample was filtered and the particulate matter was removed by centrifugation (12000 rpm, 20 min). After that, the supernatant was diluted by phosphate buffer (pH = 6.0). All samples were stored in the refrigerator at 4 oC.
Computational Details
The Gaussian 09 software program was used to carry out quantum mechanical calculations. The Gauss View 5.0.8 software was used to visualize the plots. All electronic transitions and geometry optimizations were optimized in implicit water by the DFT/TDDFT/B3LYP function and 6-311G(d) (LANL2DZ for Hg atom) basis sets with the default polarized continuum model (PCM) (29, 30).
FIGURE 3: (a) Corresponding photograph of TCPP-Hg2+ system shown in panel, revealing that the solution color as it turns from light yellow to colorless with the increase of Hg2+ concentrations, shown along the top of the figure. (b) The photograph of TCPP-Hg2+ system with the addition of different concentrations of glutathione (GSH), as indicated along the top of the figure.
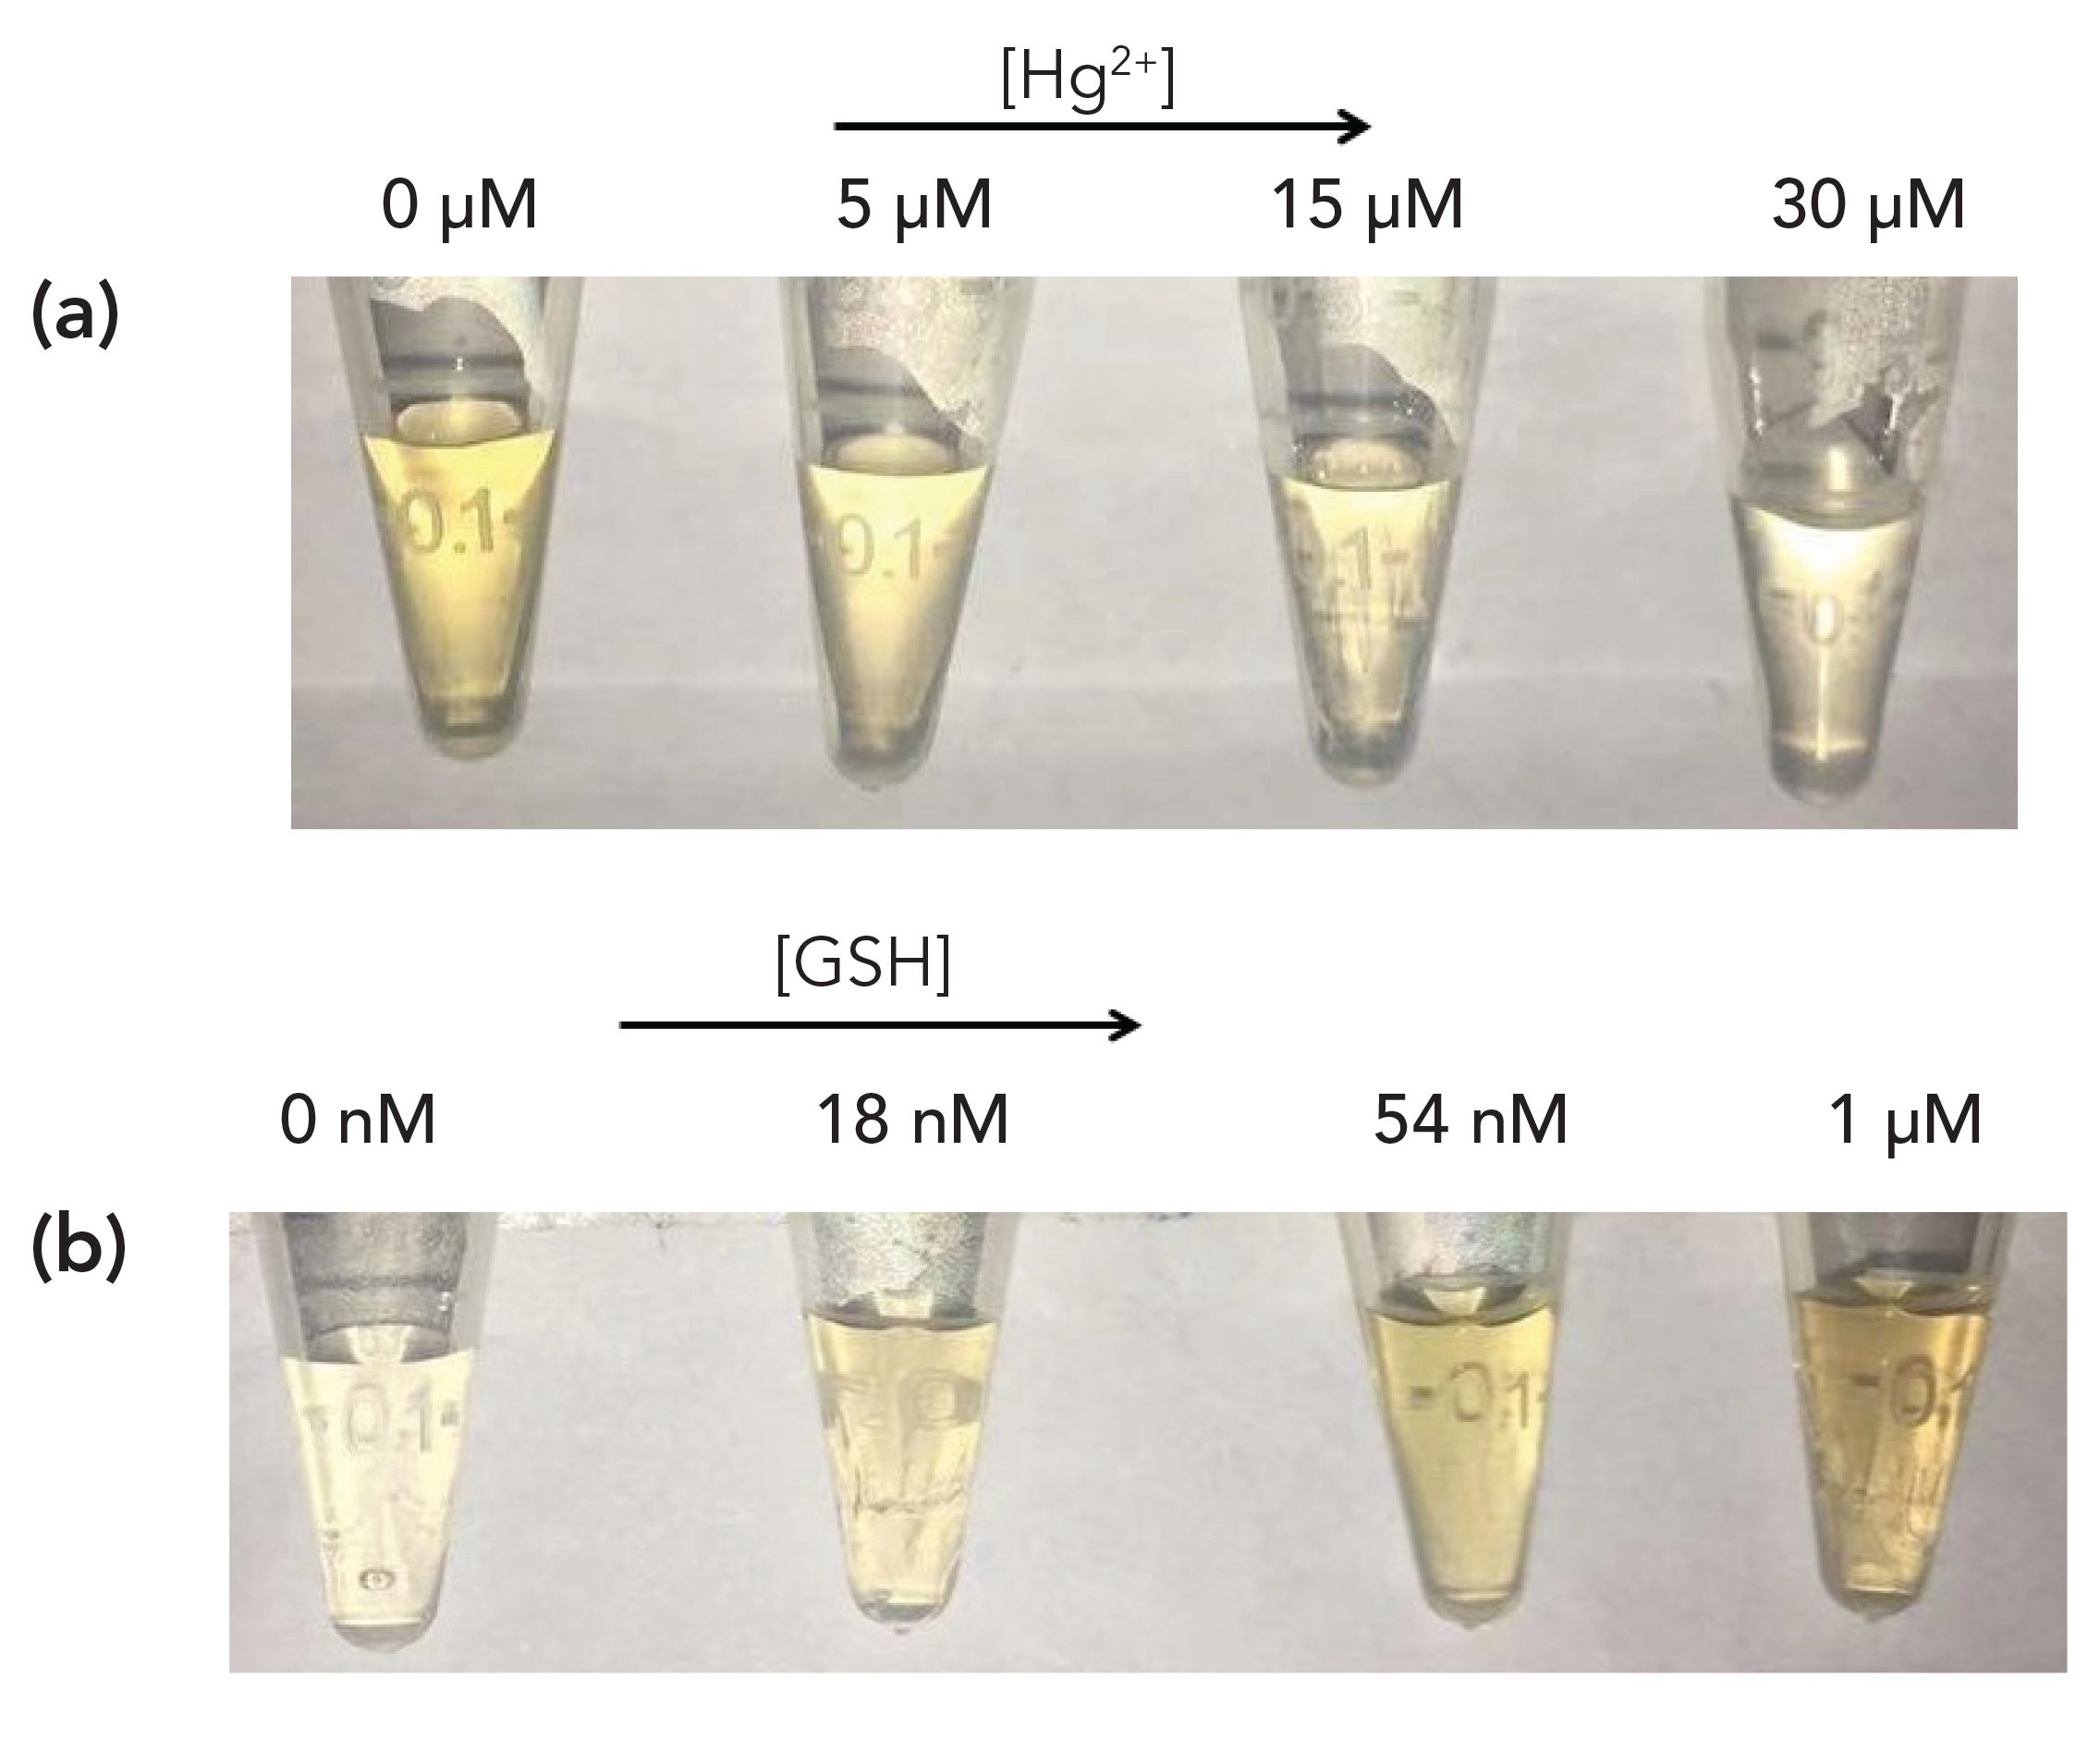
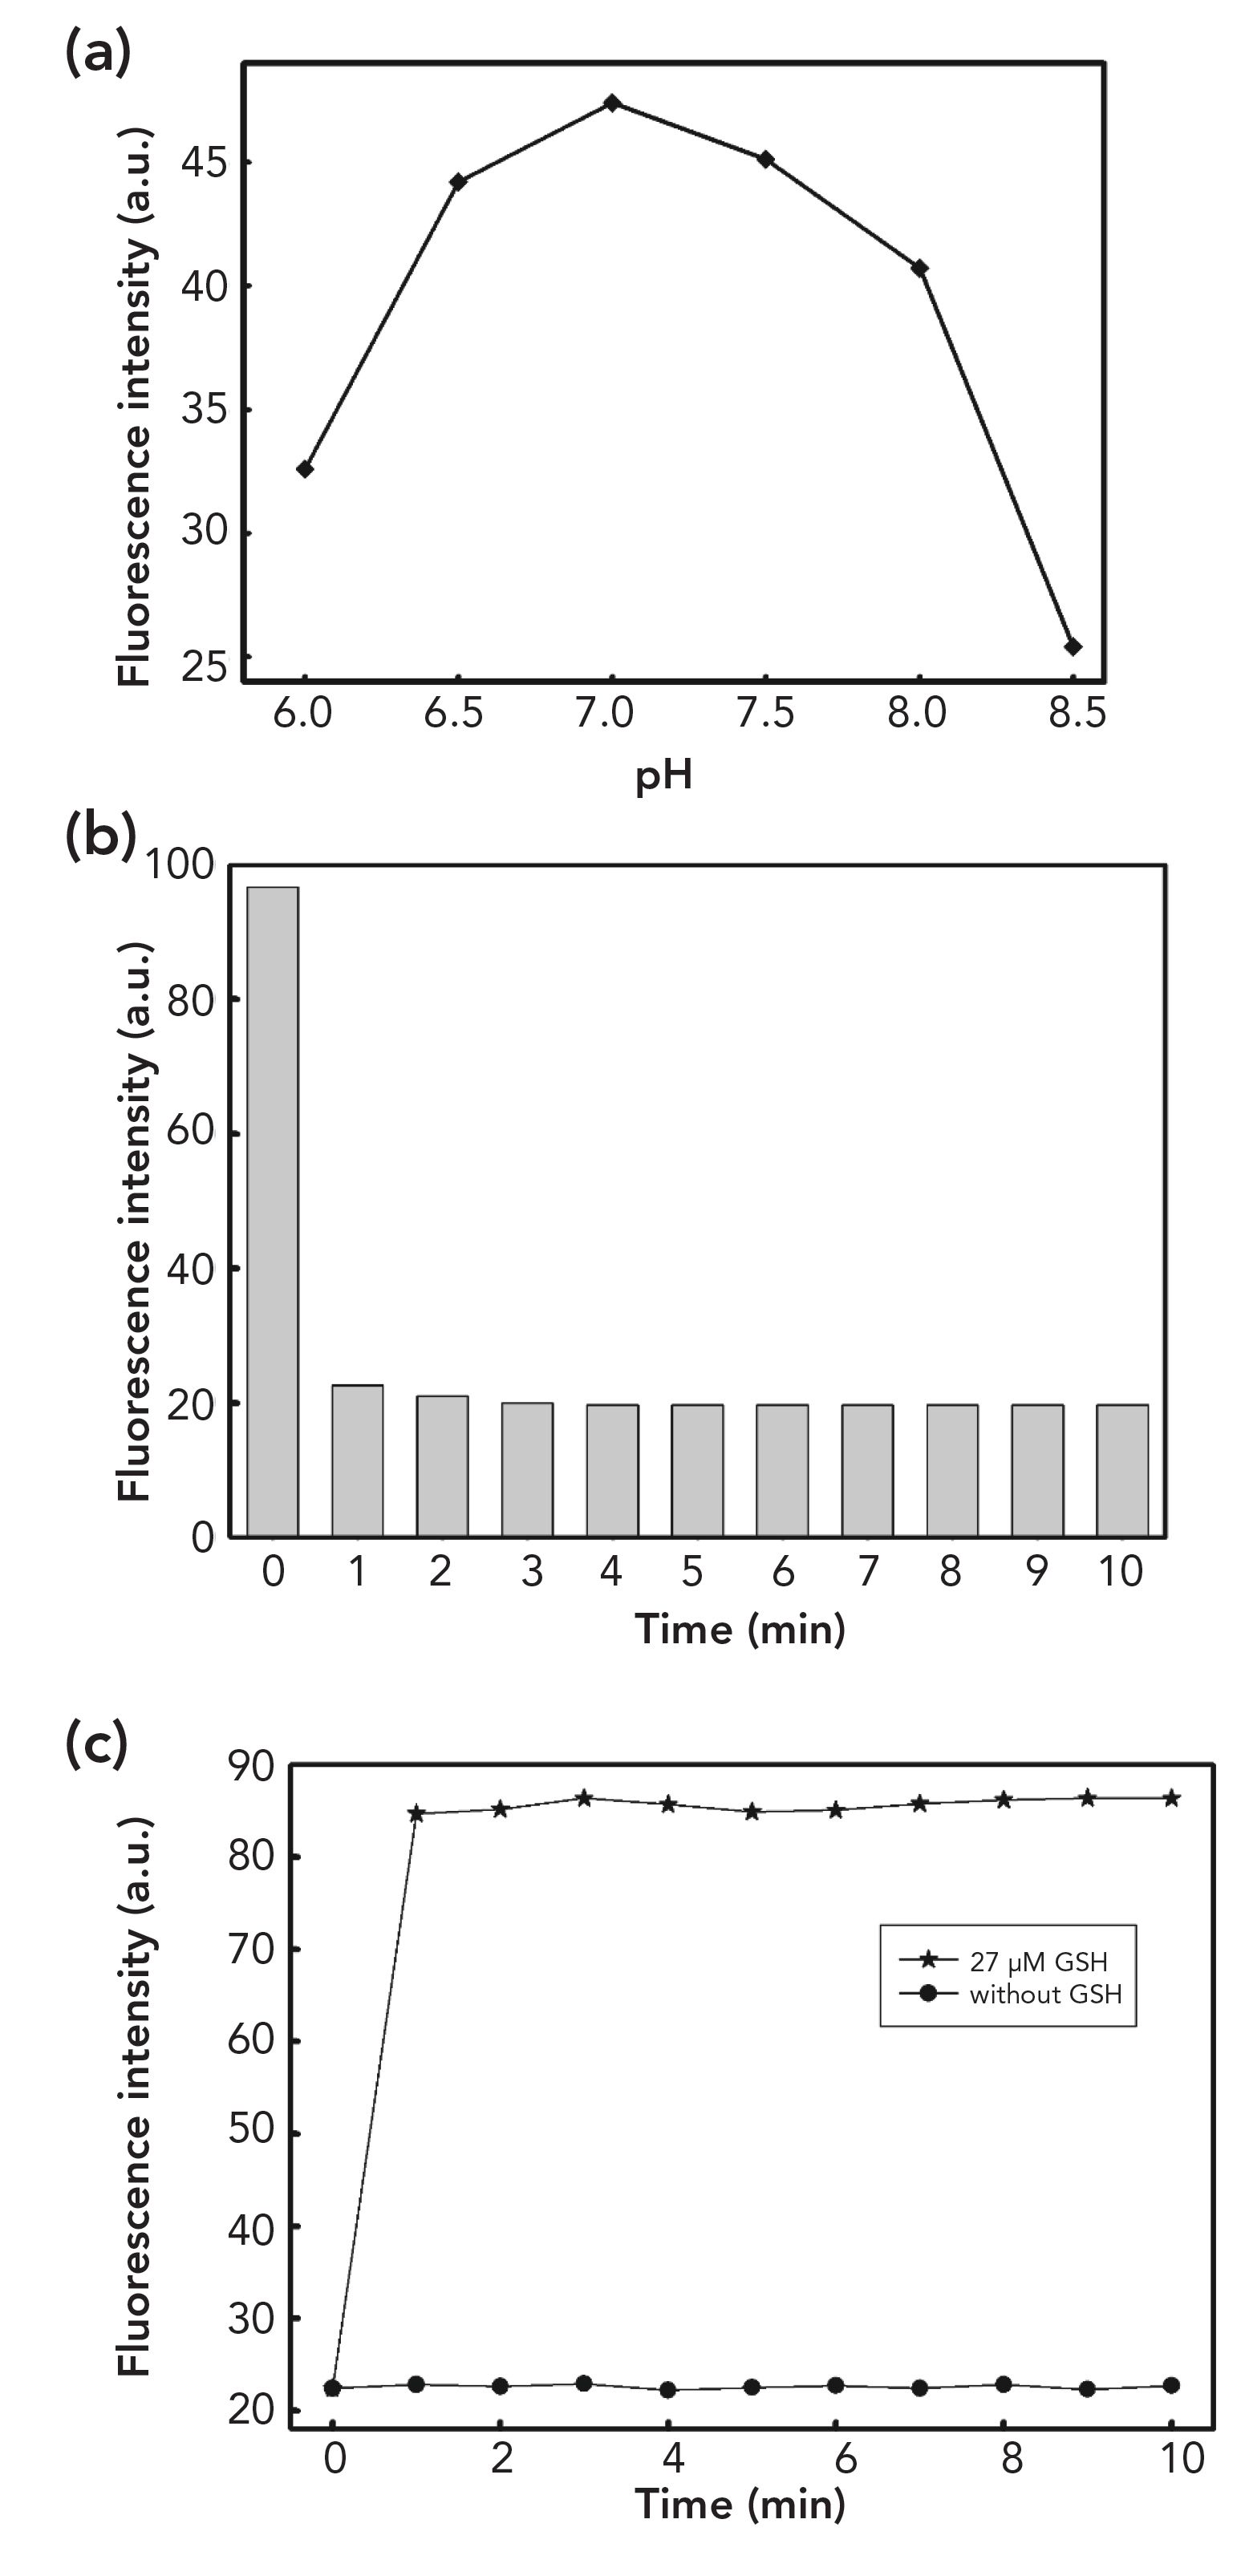
FIGURE 4: (a) The pH influence of buffer solution on fluorescence restoration. The pH range was from 6 to 8.5. Relationship between fluorescence intensity and incubation time of (b) quenching and (c) restoration, respectively. (The concentrations of Hg2+ and GSH were 30 μM and 17 μM, respectively).
Results and Discussion
Effect of Hg2+ Concentration
The fluorescence of TCPP changed with the addition of Hg2+, as displayed in Figure 1. The fluorescence intensity of TCPP (the concentration of TCPP is about 17 μM) was reduced with the rising concentration of Hg2+. The intensity reached a minimum value when the concentration of Hg2+ was 30 μM. Therefore, 30 μM was used as the concentration of Hg2+ in this system. The visible color of the system changed from yellow to colorless, which is shown in Figure 3a. In addition, Figure 3b shows how the color of the system changed with the varying concentrations of GSH. It was easy to see that the color of the sensor changed from colorless to yellow. The concentrations of GSH were 0 nM, 18 nM, 54 nM, and 1 μM, respectively. Due to this observed phenomenon, it was determined that a sensor could be designed to detect GSH.
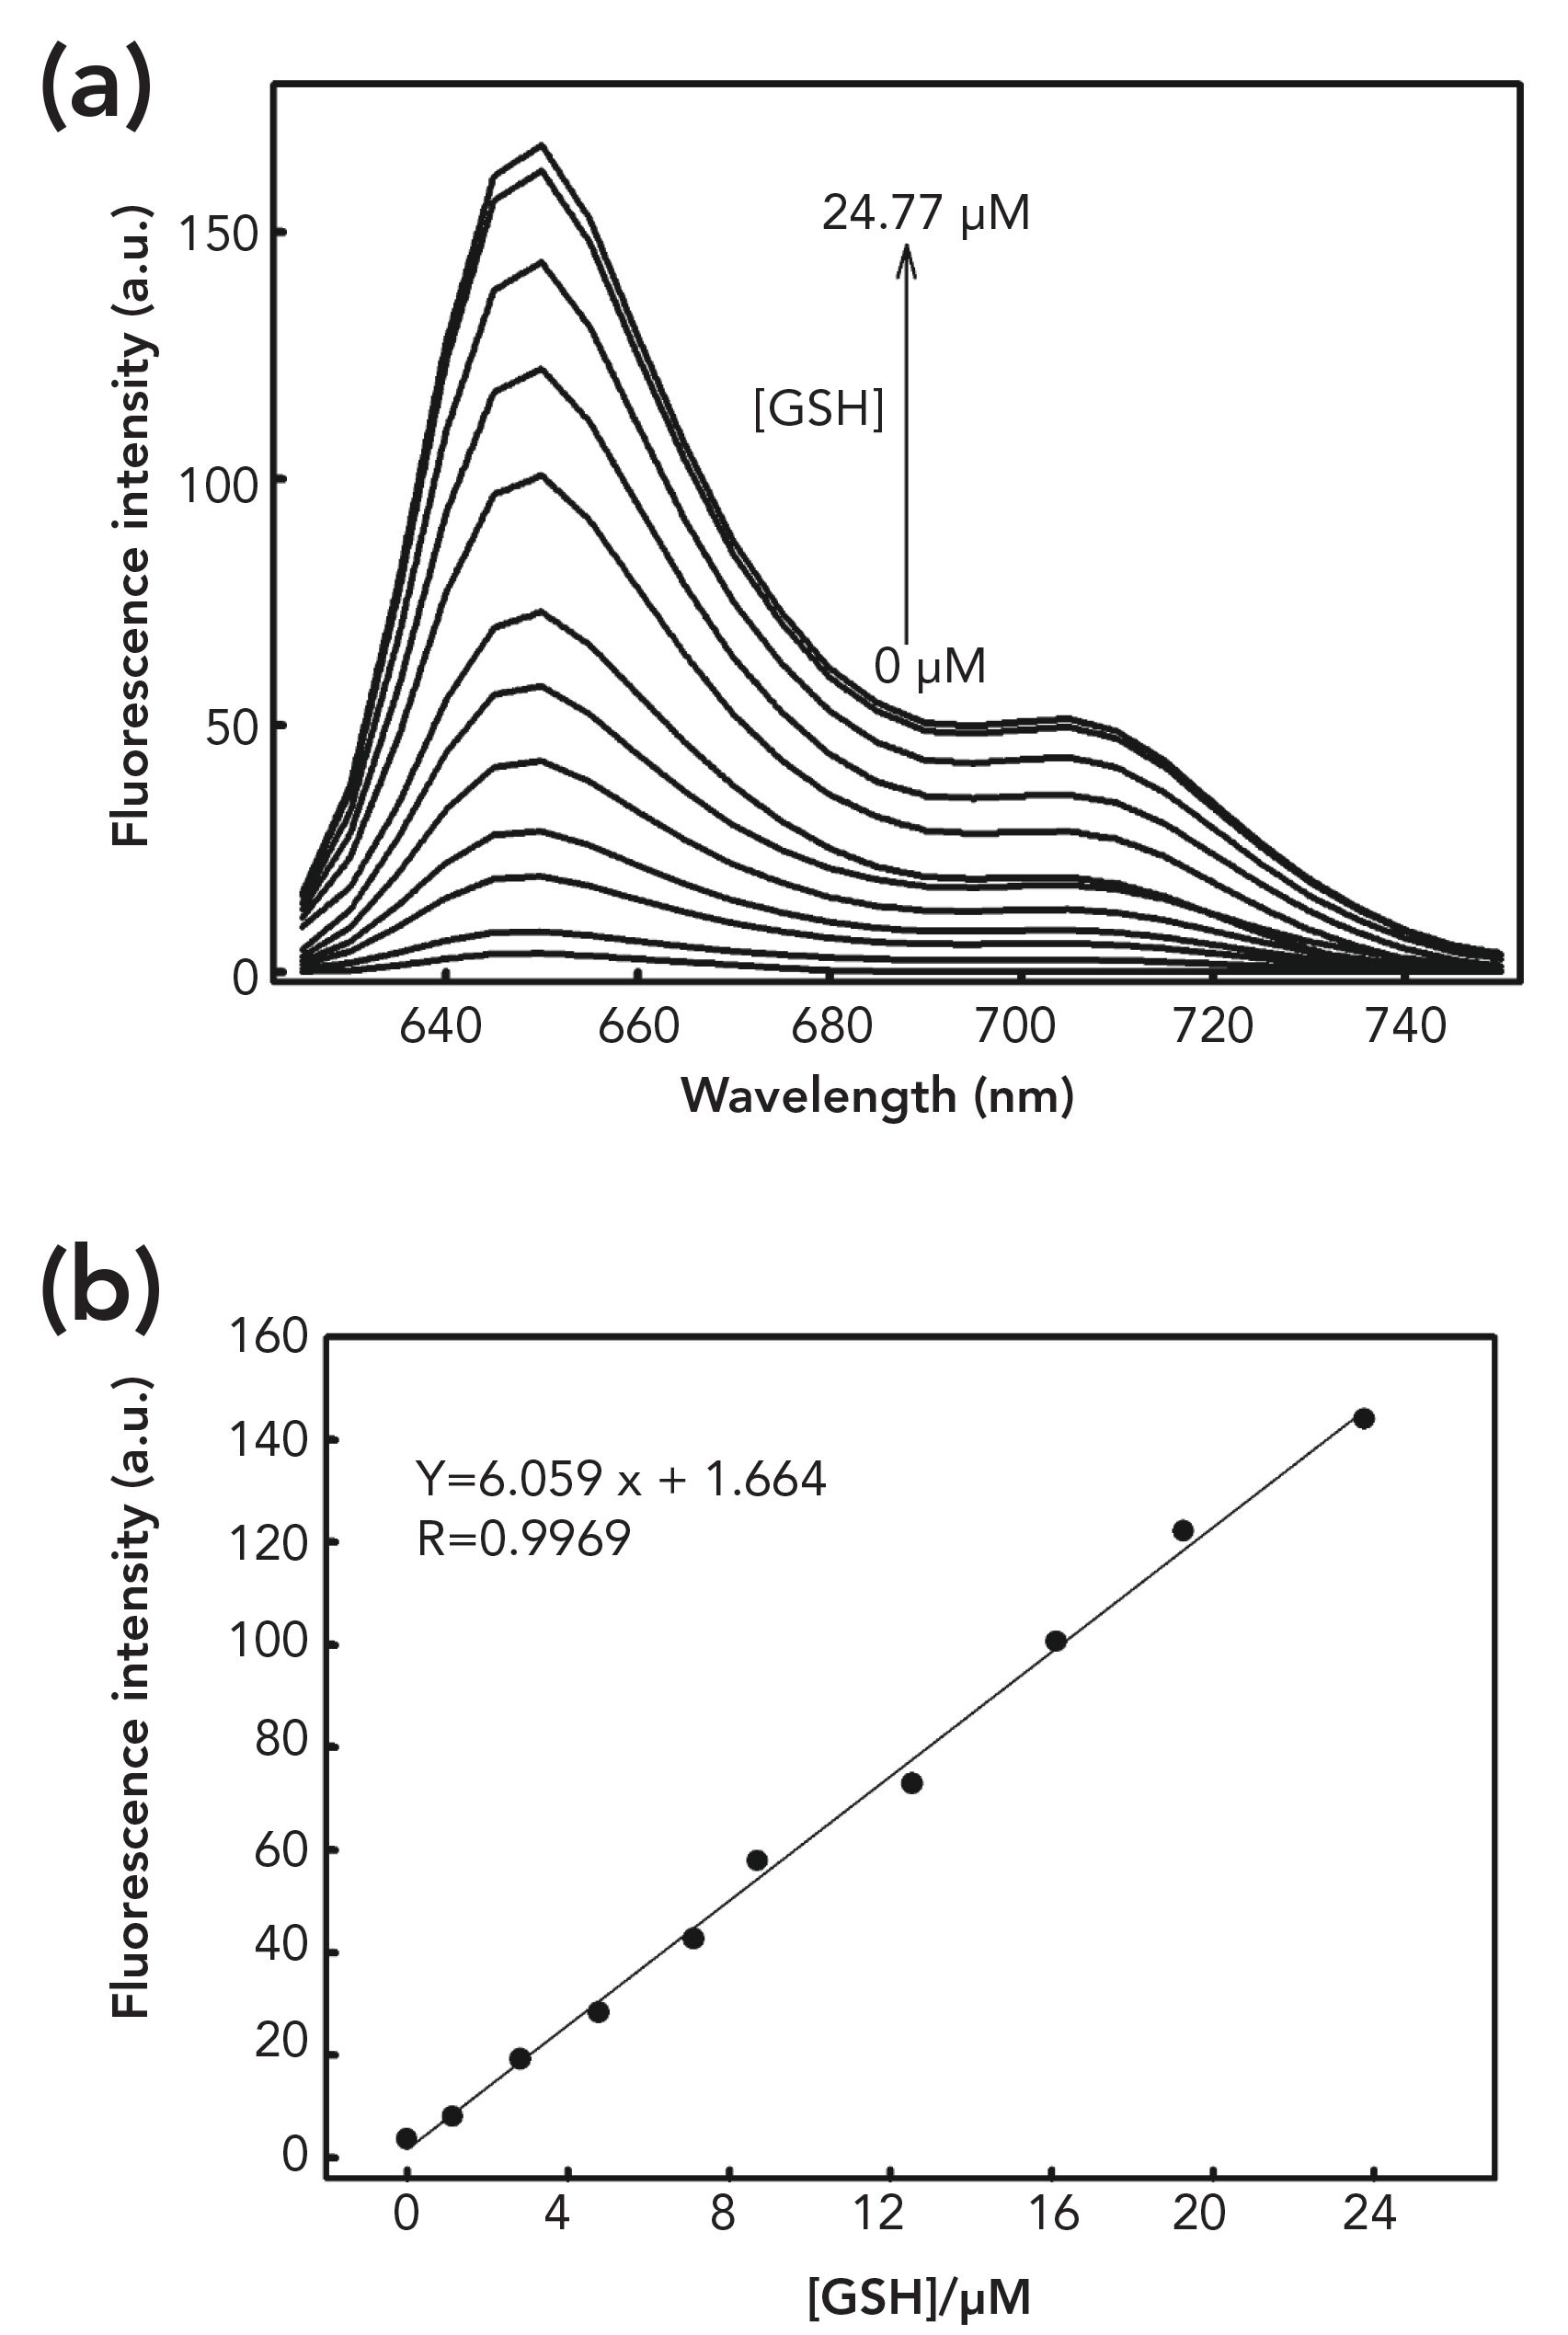
FIGURE 5: (a) Fluorescence emission spectra of the TCPP-Hg2+ system in the presence of different GSH concentrations. (b) The plot of fluorescence intensity versus GSH concentrations.
Optimization of Experimental Conditions
To improve the sensitivity of the sensor, relevant experimental conditions were optimized. Because pH value is generally considered as an important factor for the system, the optimum pH value of the buffer was based on a range between 6 and 8.5. Figure 4a shows the relationship between the fluorescence intensity of the TCPP-Hg2+ system and pH values. With the increasing pH value, the fluorescence intensity of the system was changed. Observably, the sensor signals reached the maximum at a pH level of 7.0. Because of this, we selected the pH value of 7 for our detection system.
In addition, the optimum reaction time of the sensor was investigated. The relationship between the time and fluorescence intensity is shown in Figure 4b, where the fluorescence intensity of TCCP decreased and reached the minimum after 3 min. The kinetic analysis in the fluorescence spectra of the system with and without GSH is shown in Figure 4c. The fluorescence intensity of the TCPP-Hg2+ system increased to the maximum immediately, and the values did not change during the experiment.
Detection of GSH
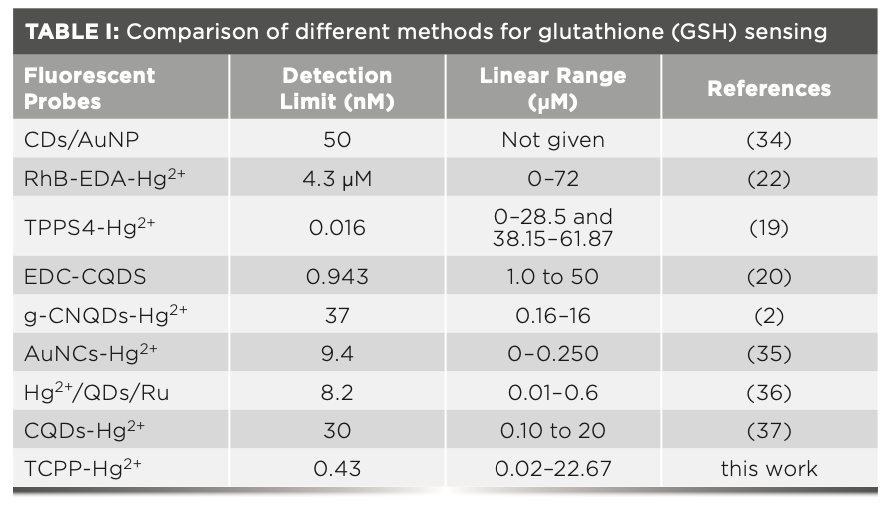
To quantitatively detect GSH, the changes in fluorescence intensity of TCPP-Hg2+ with the varying concentrations of GSH were investigated. Figure 5a shows that the fluorescence intensity of the TCPP-Hg2+ system increased gradually with the increases in GSH. Figure 5b shows that the linear correlation between GSH concentration and the fluorescence intensity was as below: F = 6.059[GSH] + 1.664 (R2 = 0.9969), where F is the fluorescence intensity of TCPP-Hg2+ with GSH. In addition, the detection limit, based on equation 1, was found to be 0.43 nM. The results suggested that the system could potentially be employed to detect GSH quantitatively with high sensitivity. The linear regions and the limit of detection for other fluorescence probes are listed in Table I. As compared with other methods, the method highlighted in Table I has a lower detection limit. The linear regions are obtained from 0.02 μM to 22.67 μM.
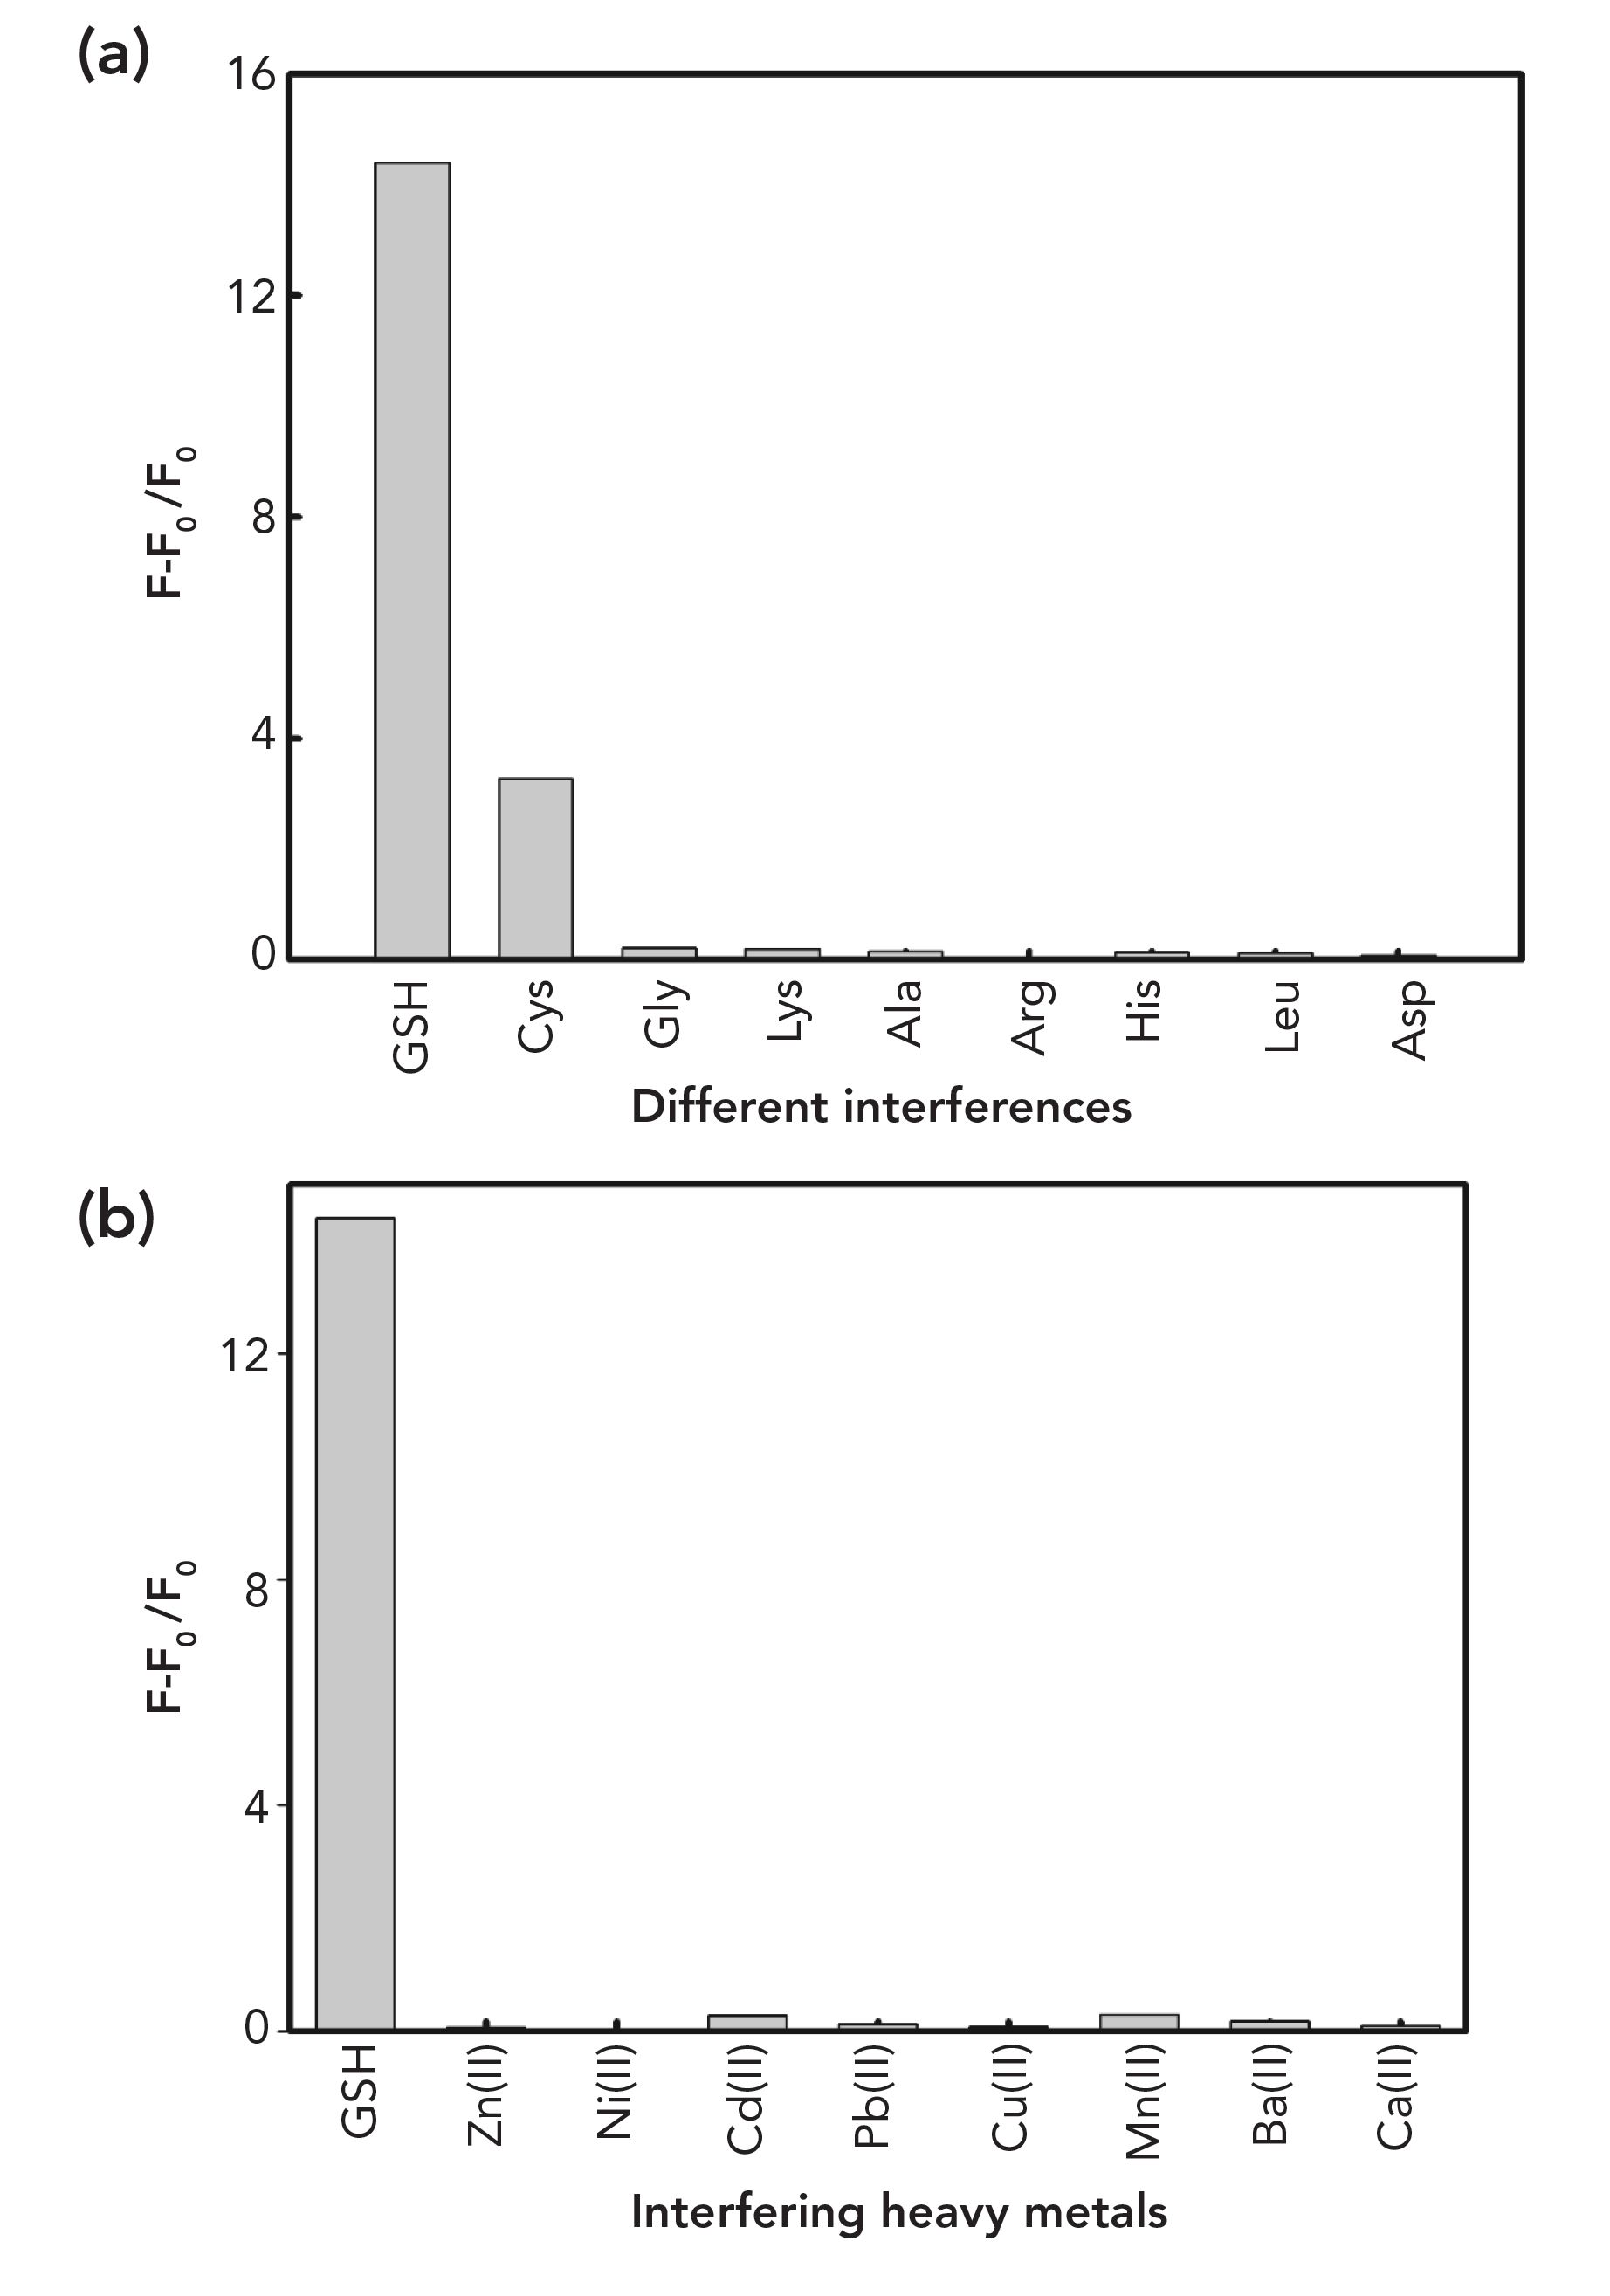
FIGURE 6: Fluorescence response of the TCPP-Hg2+ system (a) toward GSH and the different interferences as well as (b) the other interfering heavy metals. The concentrations of other interferences were about 10-fold that of GSH.
The Selectivity of the TCPP-Hg2+ Probe for GSH
Figure 6 shows the selectivity of this system. The TCPP-Hg2+ showed very weak fluorescence spectra when excited at 400 nm in the absence of various amino acid and metal ions, such as histidine, cysteine, glycine, arginine, alanine, lysine, leucine, aspartic acid, Zn2+, Ni2+, Cd2+, Pb2+, Cu2+, Mn2+, Ba2+, and Ca2+. When 10 equivalents amino acid and metal ions were added, no obvious changes in fluorescence intensity were observed (Figure 6). However, under the same condition of GSH, it resulted in a remarkable enhancement of fluorescence at 650 nm.
Detection of GSH in Real Samples
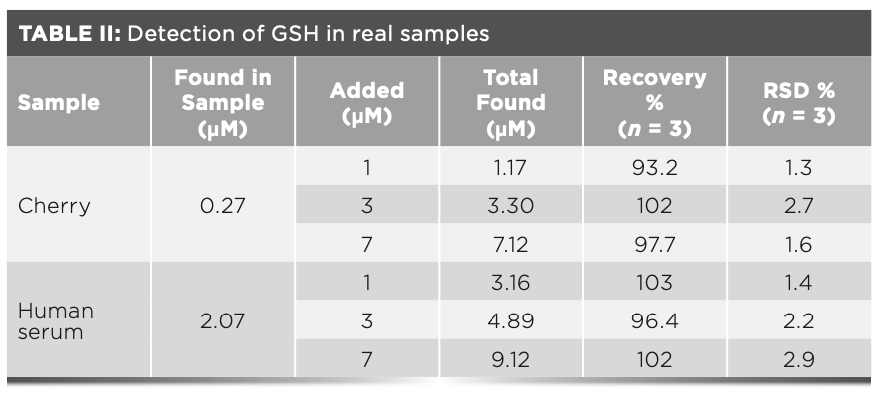
To assess the applicability of our biosensor for practical samples, we analyzed the GSH concentration in real samples including grapes, tomatoes, and cherries. Table II shows the relative errors and recovery rates when the proposed method was applied. The average recovery rates of GSH in cherries and human serum were found to be in the ranges of 93.2– 102% and 96.4–103%, respectively. Therefore, it can be seen that this method can be used to detect GSH in real samples.
Mechanism Discussion
Owing to the conjugated double bond system and the high mobility of their π-electrons, the porphyrin compound TCPP exhibited strong fluorescence emission. Hg2+ ion usually acts as a fluorescence quencher via a spin-orbital coupling effect. Noticeable decreases of fluorescence intensities were observed in the presence of Hg2+. The reason for the fluorescence quenching induced by Hg2+ may be that the pair of electrons of the nitrogen atom transferred to the vacant d orbital of Hg2+. To verify our inference, the following experiment was carried out.
As shown in Figure 7a, significant shifts in the Soret band were observed after the Hg2+ was added to the TCPP solutions. In addition, the Q bands of TCPP were decreased and even invisible in the presence of Hg2+. This can be explained by the reduction of the electron cloud density in the porphyrin ring center of TCPP since the pair electrons of nitrogen atom transferred to the vacant d orbital of Hg2+.
Nevertheless, the absorbance of Q bands appeared again when GSH was added into the TCPP-Hg2+ solution. Furthermore, CuTCPP was used to prove that Hg2+ only coordinated with the N atoms in the porphyrin ring. Figure 7b shows that CuTCPP’s fluorescence intensity was almost unchanged in the presence and absence of Hg2+. The result suggested that Hg2+ likely only coordinated with the N atoms in the porphyrin ring. This result may be closely related to the lower electronegatively of nitrogen than that of oxygen.
FIGURE 7: (a) The UV–vis absorption spectra of TCPP, TCPP-Hg2+ and TCPP- Hg2+ + GSH solution. (b) The fluorescence emission spectra of TCPP, TCPP- Hg2+, CuTCPP, CuTCPP-Hg2+, respectively.
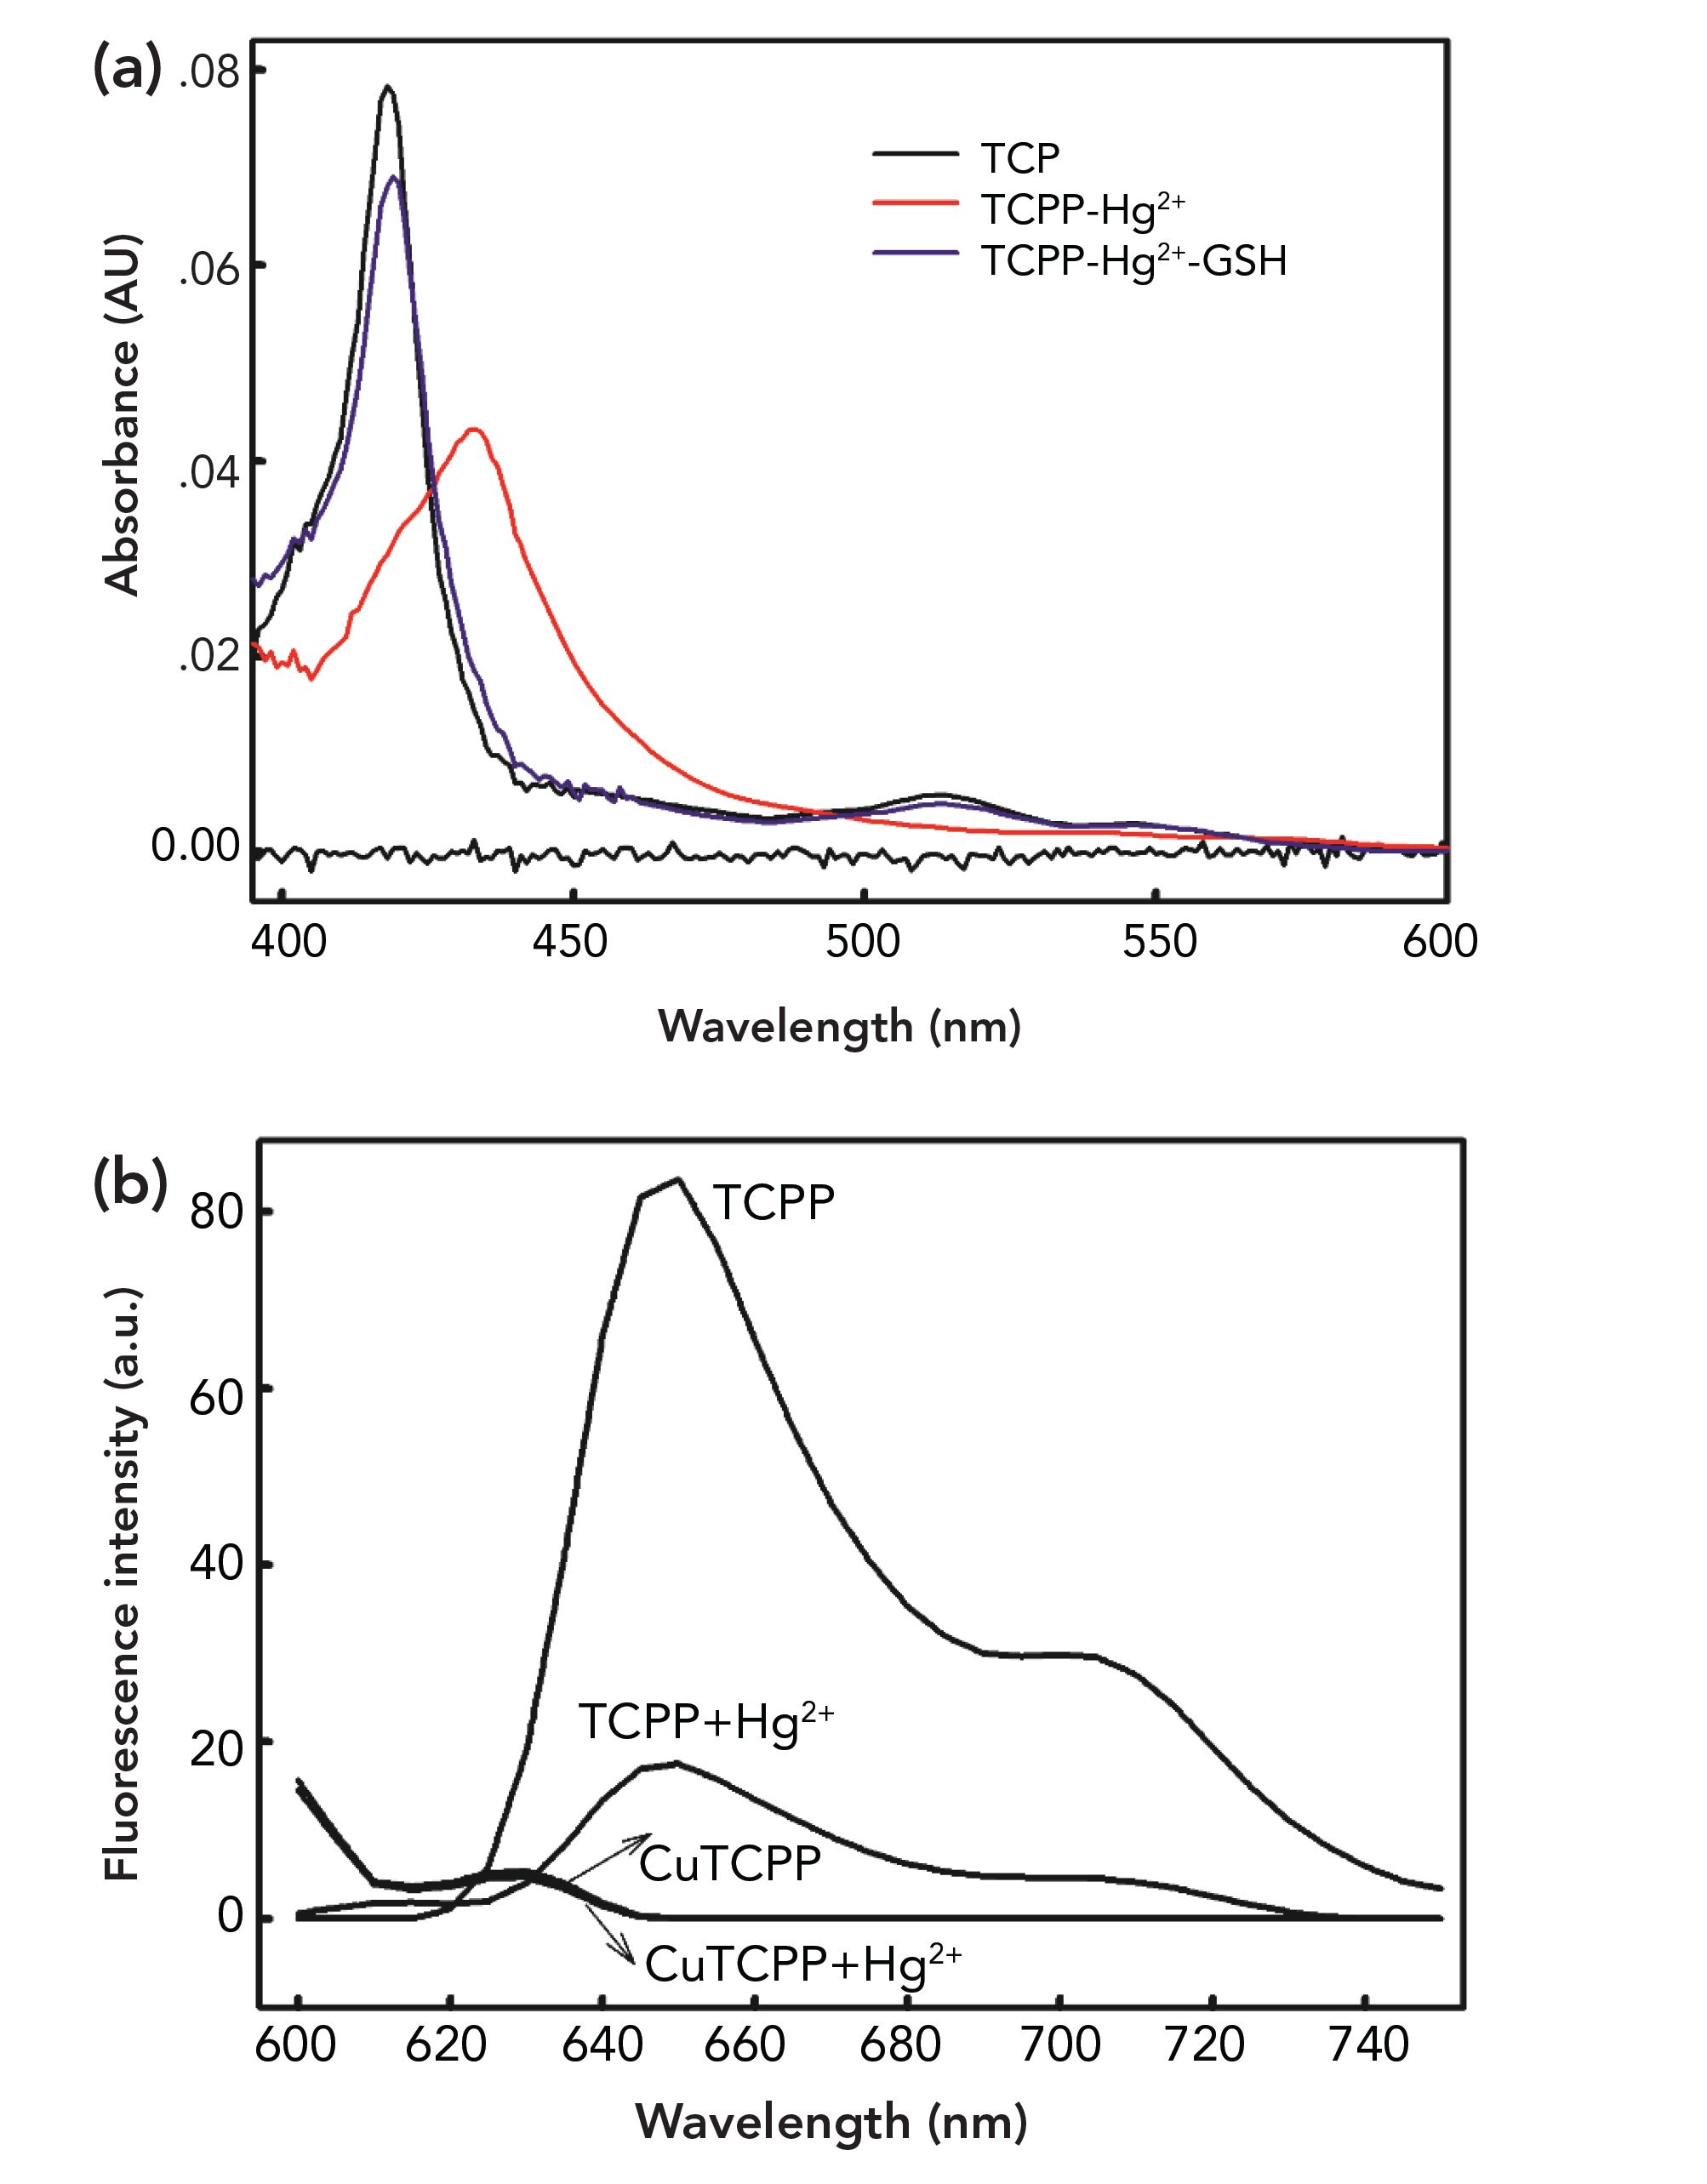
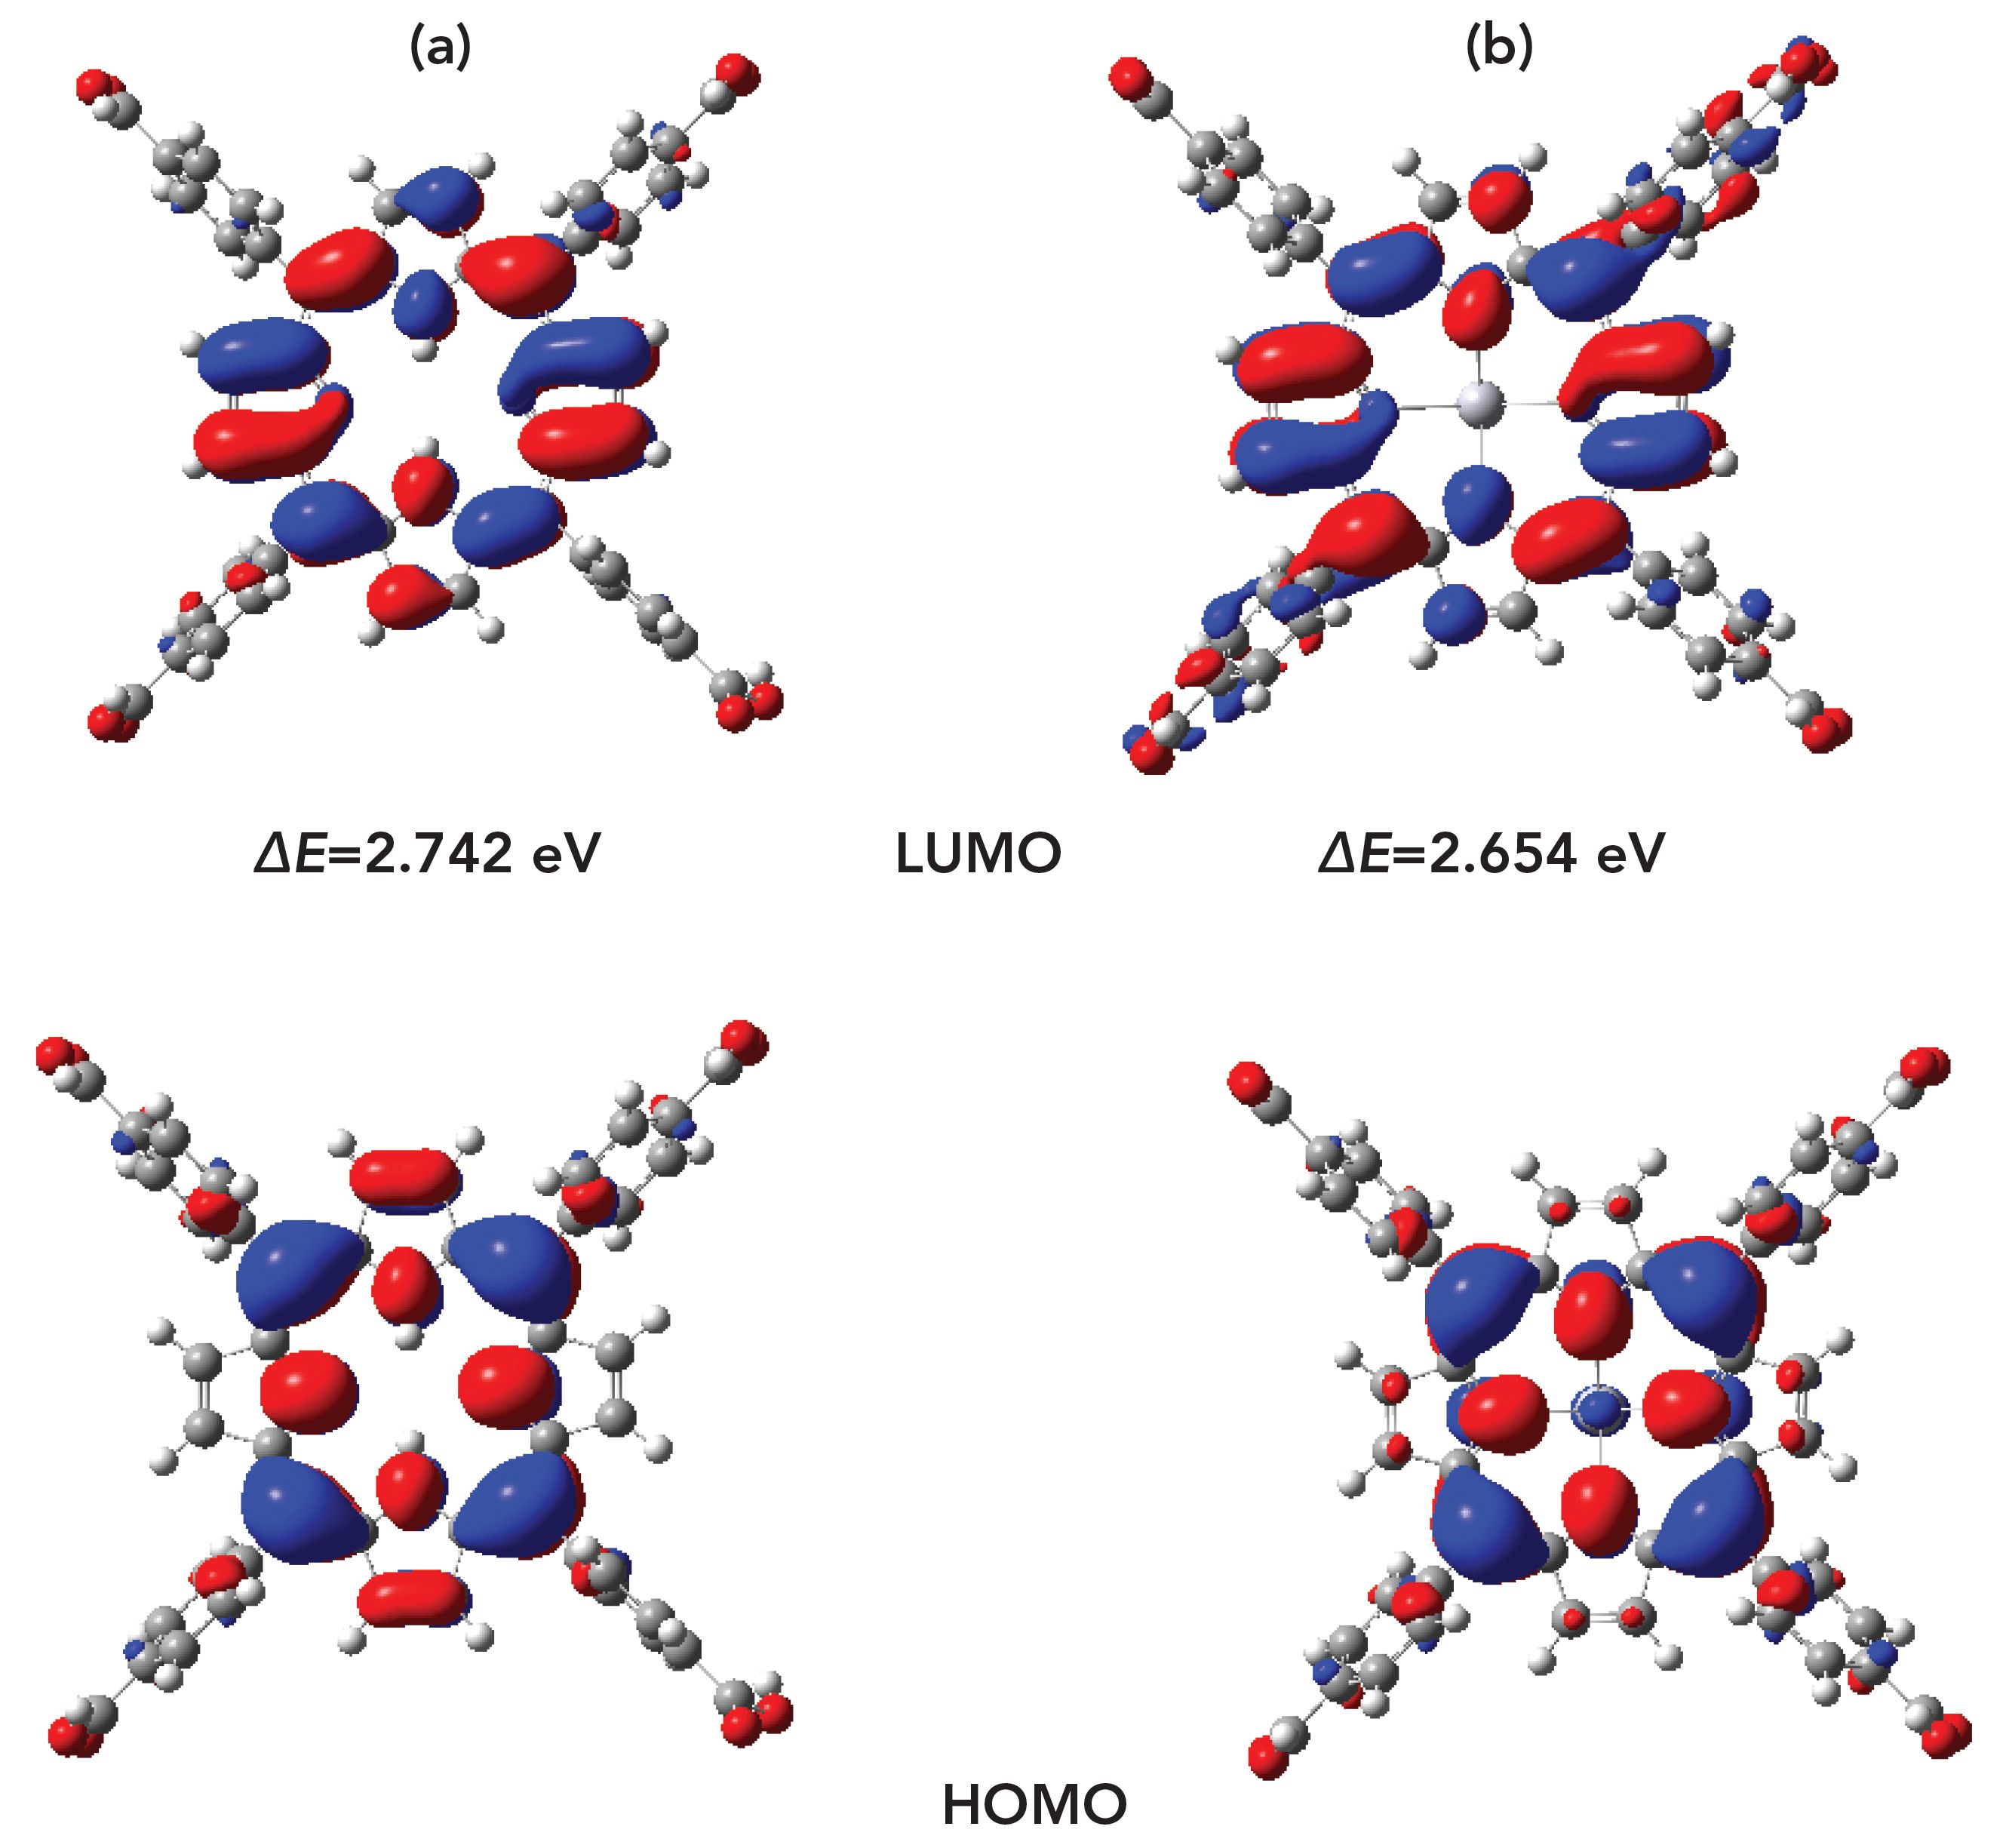
FIGURE 8: The frontier molecular orbital profiles of (a) TCPP and (b) its complex TCPP-Hg2+, both shown in (top) LUMO and (bottom) HOMO configurations. All calculations performed at the DFT/TDDFT/B3LYP/6-311G(d)/LAN- L2DZ/level of theory.
Theoretical Calculations
The density functional theory (DFT) can provide important physical information of molecules and solids, thus helping researchers to understand experiments (31–33). In this work, we used DFT calculation to explain the fluorescence of TCPP quenching by Hg2+. The electronic transition and structure properties of TCPP and TCPP-Hg2+ were the main focus of this investigation. First, geometry optimizations were carried out at the B3LYP/6-311G(d) level for all atoms except Hg2+, for which the LAN-L2DZ basis set was used.
It is generally accepted that the orbital spatial distribution of the frontier molecular orbital (FMO) has an impact on intramolecular charge transfer. In addition, the essence of the interaction of two substances was the interaction between their FMOs. The lowest unoccupied molecular orbital (LUMO) and highest unoccupied molecular orbital (HOMO) of the TCPP and TCPP-Hg2+ are shown in Figure 8. As Figure 8 shows, LUMO and HOMO were localized on the porphyrin ring without Hg2+ and changed with Hg2+. After complexation with Hg2+, HOMO was primarily concentrated over the metal atom and porphyrin ring. This phenomenon indicated that the charge may be transferred completely in the process of electronic excitation. The calculated energies of the LUMOs and HOMOs of TCPP and TCPP-Hg2+ complex are listed in Figure 8. The HOMO and LUMO values are −5.675 eV and −2.933 eV for TCPP. The HOMO and LUMO values for TCPP-Hg2+ complex are −5.204 eV and −2.550 eV respectively. The calculated band gap energies (Eg) are 2.742 eV and 2.654 eV for TCPP and TCPP-Hg2+ (Figure 8).
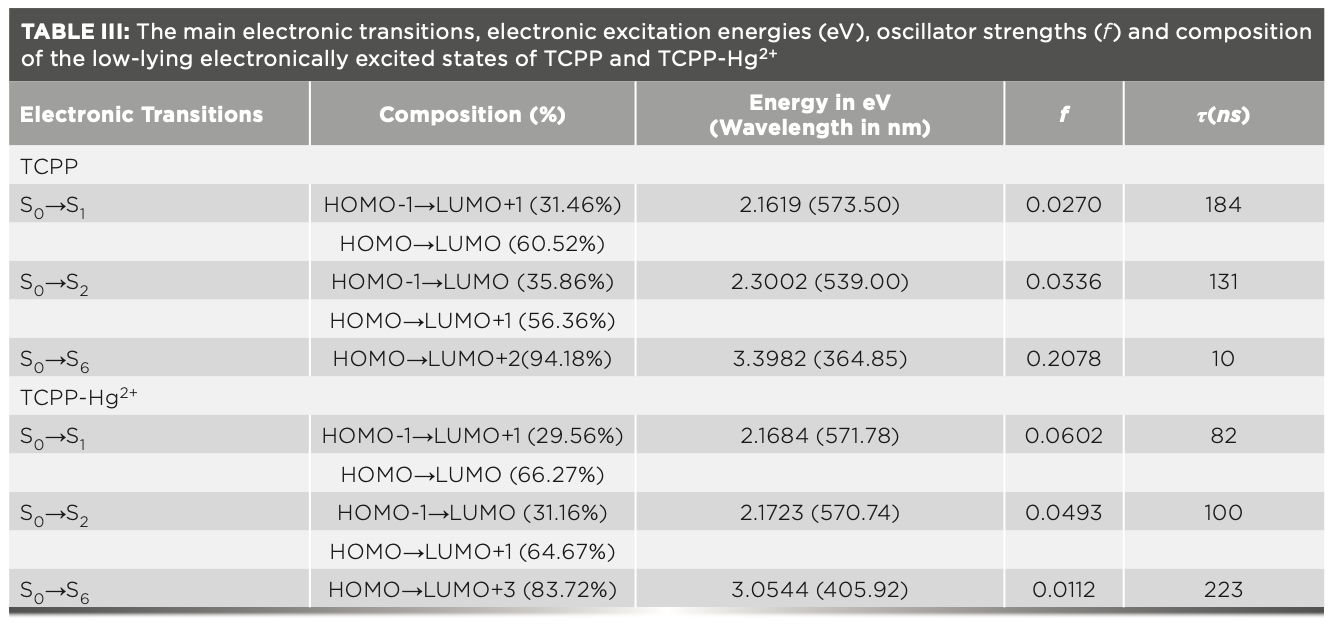
Furthermore, the electronic transitions of TCPP and the TCPP-Hg2+ complex were investigated. The first allowed excited state and the lowest-lying excited state for TCPP and TCPP-Hg2+ were analyzed. The corresponding molecular oscillator strengths (f), transition energies (eV) orbital contributions and fluorescence lifetimes (τ) are listed in Table III. The fluorescence lifetimes of TCPP and TCPP-Hg2+ were obtained from equation 2:

where τ is the fluorescence lifetime, c is the speed of light, f is the oscillator strength and E is the transition energy (all in a unit of a.u.).
From the data listed in Table III, the fluorescence lifetimes of TCPP and TCPP-Hg2+ are 184 and 131 ns, respectively. According to the results in the literature, the lifetimes less than 10 ns correspond to emissive states (19). If the lifetime is greater than 10 ns, the corresponding state suffer from a nonradiative relaxation process becomes dark because of the long relaxation time for the excited electron. Therefore, the emissions listed in Table III are nonradiative. Notably, according to theoretical calculations, the main reason should be the electronic transitions from S0→S6. For TCPP and TCPP-Hg2+, the fluorescence lifetimes (S0→S6) are 9 and 223 ns, respectively. As a result, the fluorescence of TCPP was generated on account of the excited electron, but it was a nonradiative process for TCPP-Hg2+, which might be that the exciting electron relaxed back to the lower-lying excited state by internal conversion. The calculated results were consistent with the results from experiments.
Conclusion
In this work, a novel fluorescence probe based on TCPP was designed for the detection of GSH. The fluorescence response of TCPP was “off” (inactive) because of its conjugation with Hg2+. The fluorescence response of the TCPP-Hg2+ system was “on” (active) with the addition of GSH. The “off–on” process was used to detect GSH with sensitivity and efficiency. In addition, the selectivity and mechanism of the proposed sensor were illustrated. The sensor displayed a good selectivity and high sensitivity for the detection of GSH. The sensor was also applied successfully to the determination of GSH in different real samples.
Acknowledgements
This study is supported by National Natural Science Foundation of China (No. 21701121 and No. 21571117) and the Higher School Science and Technology Innovation Project of Shanxi Province (2019L0809).
References
(1) R. Huang, X. Wang, D. Wang, F. Liu, B. Mei, A. Tang, et al., Anal. Chem. 85, 6203–6207 (2013). https://doi.org/ 10.1021/ ac4014012
(2) Y. Xu, X. Niu, H. Zhang, L. Xu, S. Zhao, H. Chen, and X. Chen, J. Agric. Food Chem. 63, 1747– 1755 (2015). https://doi.org/10.1021/ jf505759z
(3) B. Bayram, G. Rimbach, J. Frank, and T. Esatbeyoglu, J. Agric. Food Chem. 62, 402–408 (2014). https://doi. org/10.1021/jf403857h
(4) S. Sabelle, P.Y. Renard, K. Pecorella, S. Suzzoni-Dezard, C. Creminon, J. Grassi, and C. Mioskowski, J. Am. Chem. Soc. 124, 4874–4880 (2002). https://doi.org/10.1016/j.ccr.2012.03.009
(5) M.H. Lee, J.H. Han, P.S. Kwon, S. Bhuniya, J.Y. Kim, J.L. Sessler, C. Kang, and J.S. Kim, J. Am. Chem. Soc. 134, 1316–1322 (2012). https:// doi.org/10.1021/ja210065g
(6) D.M. Townsend, K.D. Tew, and H. Tapiero, Biomed. Pharmacother. 57, 145–155 (2003). https://doi. org/10.1016/s0753-3322(03)00043-x
(7) H.P. Peng, M.L. Jian, Z.N. Huang, W.J. Wang, H.H. Deng, W.H. Wu, A.L. Liu, X.H. Xia, and W. Chen. Biosens. Bioelectron. 105, 71–76 (2018). https:// doi.org/10.1016/j.bios.2018.01.021
(8) A. I. Oprescu, G. Bikopoulos, A. Naassan, E. M. Allister, C. Tang, E. Park, H. Uchino, G. Lewis, I. Fantas, M. Rozakis-Adcock, M. Wheeler, and A. Giacca. Diabetes 56, 2927–2937 (2007). https:// doi.org/10.2337/db07-0075
(9) P. Zhang, J. Wang, H. Huang, H. Chen, R. Guan, Y. Chen, L. Ji, and H. Chao. Biomaterials 35, 9003–9011 (2014). https://doi.org/10.1016/j.bio- materials.2014.07.021
(10) C.X. Yin, F.J. Huo, J.J. Zhang, R.M. Máñez, Y.T. Yang, H.G. Lv, and S.D. Li. Chem. Soc. Rev. 42, 6032–6059 (2013). https://doi.org/10.1039/ c3cs60055f
(11) C.X. Yin, K.M. Xiong, F.J. Huo, J.C. Salamanca, and R. M. Strongin, Angew. Chem. Int. Ed. 56, 13188–13198 (2017). https://doi.org/10.1002/anie.201704084
(12) H. S. Jung, X. Chen, J. S. Kim, and J. Yoon, Chem. Soc. Rev. 42, 6019–6031 (2013). http://dx.doi.org/10.1039/ c3cs60024f
(13) Y.K. Yue, C.X. Yin, F.J. Huo, J.B. Chao, and Y.B. Zhang. Sensor. Actuator. B. Chem. 223, 496–500 (2016). https://doi.org/10.1016/j.snb.2015.09.127
(14) R.J. Gui, X.Q. An, H.J. Su, W.G. Shen, L.Y. Zhu, X. Y. Ma, Z.Y. Chen, and X.Y. Wang. Talanta 94, 295–300 (2012). http://dx.doi.org/10.1016/j.talanta.2012.03.043
(15) G. G. Huang, X. X. Han, M. K. Hossain, Y. Ozaki, Anal. Chem. 81, 5881–5888 (2009). http://dx.doi. org/10.1021/ac900392s
(16) E. J. Pacsialong, R. L. Mccarley, W. Wang, R. M. Strongin, Anal. Chem. 78, 7577–7581 (2006). http://dx.doi. org/10.1021/ac061451q
(17) P. K. Sudeep, S. T. S. Joseph, K. G. Thomas, J. Am. Chem. Soc. 127, 6516–6517 (2005). http://dx.doi. org/10.1021/ja051145e
(18) L. Yuan, W. Lin, K. Zheng, S. Zhu, Acc. Chem. Res. 46, 1462–1473 (2013). http://dx.doi.org/10.1021/ar300273v
(19) J. Chen, Q. Ma, X.Y. Hu, Y.J. Gao, X.Y. Yan, D.D. Qin, X.Q. Lu, Sensor. Actuator. B. Chem. 254, 475–482 (2018). http://dx.doi.org/10.1016/j. snb.2017.07.125
(20) J. H. Pan, Z. Y. Zheng, J. Y. Yang, Y. Y. Wu, F.S. Lu, Y.W. Chen, and W.H. Gao. Talanta 166, 1–7 (2017). http://dx.doi. org/10.1016/j.talanta.2017.01.033
(21) D.H. Tian, Z.S. Qian, Y.S. Xia, and C.Q. Zhu, Langmuir. 28, 3945–3951 (2012). http://dx.doi.org/10.1021/la204380a
(22) H. Sharma, J.M. White, J.R. Lin, E.J. New, and F.M. Pfeffer, Sensor. Actuator. B. Chem. 300, 126825 (2019). http:// dx.doi.org/10.1016/j.snb.2019.126825
(23) C. Q. Xiao, F. L. Jiang, B. Zhou, R. Lia, and Y. Liu, Photochem. Photobiol. Sci. 10, 1110–1117 (2011). http://dx.doi. org/10.1039/C1PP05008G
(24) M.R. Saboktakin, R.M. Tabatabaie, P. Ostovarazar, A. Maharramov, M. A. Int. J. Biol. Macro. 51, 544–549 (2012). http://dx.doi.org/10.1016/j. ijbiomac.2012.06.024
(25) J. S. Lindsey, Chem. Soc. Rev. 115, 6534–6620 (2015). https://doi. org/10.1021/acs.chemrev.5b00065
(26) Y. Pareek, M. Ravikanth, and T. K. Chandrashekar, Acc. Chem. Res. 45, 1801–1816 (2012). http://dx.doi.org/10.1021/ ar300136s
(27) A. J. Pistner, D. A. Lutterman, M. J. Ghidiu, Y. Z. Ma, and J. Rosenthal, J. Am. Chem. Soc. 135, 6601–6607 (2013). http://dx.doi.org/10.1021/ja401391z
(28) N. Yan, Z. Zhu, N. Ding, L. Zhou, Y. Dong, and X. Chen, J. Chromatogr. A. 1216, 8665–8670 (2009). http://dx.doi. org/10.1016/j.chroma.2009.10.027
(29) M. Frisch, G. Trucks, H. Schlegel, GAUSSIAN03, Revision D. 01, 2004, Gaussian, Inc.; Wallingford, CT, 90, in: Y. Zhao, D.G. Truhlar (Eds.), (MN-GFM 4.3, University of Minnesota, Minneapolis, 2009).
(30) M. Li, L. Kou, L. Diao, Q. Zhang, Z. Li, Q. Wu, et al., J. Phys. Chem. A. 119, 3299–3309 (2015). http://dx.doi. org/10.1021/acs.jpca.5b00798
(31) N. Chiang, N. Jiang, D. V. Chulhai, E. A. Pozzi, M. C. Hersam, L. Jensen, et al., Nano. Lett. 15, 4114–4120 (2015). http://dx.doi.org/10.1021/acs. nanolett.5b01225
(32) C. Adamo and D. Jacquemin, Chem. Soc. Rev. 44, 845–856 (2013). http://dx.doi.org/10.1039/C2CS35394F
(33) R. Improta and V. Barone, J. Am. Chem. Soc. 126, 14320–14321 (2004). http://dx.doi.org/10.1021/ja0460561
(34) X. Wei, Y. Wang, Y. Zhao, and Z. Chen. Biosens. Bioelectron. 97, 332–337 (2017). http://dx.doi.org/10.1016/j. bios.2017.06.020
(35) K.S.Park, M.I.Kim, M.A.Woo, H.G. Park, Biosens. Bioelectron. 45, 65–69 (2013). http://dx.doi.org/10.1016/j. bios.2013.01.047
(36) Z. Zhang, X. Xiang, F. H. Huang, M. M. Zheng, X. Y. Xia, L. Han, Sensors. Actuators. B. Chem. 273, 159–166 (2018). https://doi.org/10.1016/j. snb.2018.06.046
(37) J. Hou, F. S. Zhang, Y. Xu, L. Wang, Y. Yan, H. Ding, L. Ding. Analytica. Chimica. Acta. 859, 72–78 (2015). https:// doi.org/10.1016/j.aca.2014.12.021
Zhen Song, Nvwa Gao, and Qingqing Mou are with the Department of Chemistry at Taiyuan Normal University in Jinzhong, China. Wen Yuan is with China University of Geosciences in Beijing, China. Direct correspondence to: songzhen@tynu.edu.cn.

New Study Reveals Insights into Phenol’s Behavior in Ice
April 16th 2025A new study published in Spectrochimica Acta Part A by Dominik Heger and colleagues at Masaryk University reveals that phenol's photophysical properties change significantly when frozen, potentially enabling its breakdown by sunlight in icy environments.
Tracking Molecular Transport in Chromatographic Particles with Single-Molecule Fluorescence Imaging
May 18th 2012An interview with Justin Cooper, winner of a 2011 FACSS Innovation Award. Part of a new podcast series presented in collaboration with the Federation of Analytical Chemistry and Spectroscopy Societies (FACSS), in connection with SciX 2012 ? the Great Scientific Exchange, the North American conference (39th Annual) of FACSS.
Can Fluorescence Spectroscopy Evaluate Soil Dissolved Organic Matter Dynamics?
February 20th 2025A new study published in Chemical Engineering Journal by researchers from Northeast Agricultural University in China reveals that biochar aging, influenced by environmental factors like UV exposure and wet-dry cycles, alters dissolved organic matter composition and affects its effectiveness in remediating cadmium-contaminated soil.
New Fluorescent Raman Technique Enhances Detection of Microplastics in Seawater
November 19th 2024A novel method using fluorescence labeling and differential Raman spectroscopy claims to offer a more efficient, accurate approach to detect microplastics in seawater. Developed by researchers at the Ocean University of China, this method improves both the speed and precision of microplastic identification, addressing a key environmental issue affecting marine ecosystems.