A Proposal for the Origin of the Near-Ubiquitous Fluorescence in Raman Spectra
Every analyst who has recorded Raman spectra is aware of the difficulties in accessing the information from the spectra when samples fluoresce. From the instrument’s point of view, the fluorescent emission is the same as the Raman emission; that is, there is an excitation laser wavelength and there is emission to the long wavelength side of the laser. If the spectrum exhibits sharp lines, and the lines follow the excitation wavelength, the emission is Raman. If the emission is intense and sharp lines are hidden by the noise from a high background, the emission is fluorescence. And finally, if the laser wavelength is changed, the broad intense emission will remain at the same position in nanometers. In this column, I describe what I believe may be the origin of this fluorescence emission and support my conjecture with some measurements of polycyclic aromatic hydrocarbons (PAHs). Understanding the origin of these interfering backgrounds may enable you to design experiments with less interference, avoid the laser illuminations that make things worse, or both.
Recently, while working on a polymer sample that had been purposely degraded, I observed fluorescence that was unstable and dependent on the laser power. We were trying to confirm the presence of carbon in darkened material, but outside of the black regions, there was significant fluorescence, even when coloration was not visible. It occurred to me that we might be observing the presence of polyaromatic cyclic hydrocarbons (PAHs) that can evolve into carbon. This column is going to document what measurements were done to support this conjecture.
Not being a chemist by trade, I started this project with my intuition and went to “Dr. Google” for more information. There, I found what I was looking for with little difficulty. It turns out that chemists have been studying the formation of soot for decades and have even described the conversion of non-aromatic fuel into the first aromatic rings (1,2)! For the non-chemist, it is not difficult to understand how the aromatic rings can fuse until they become sooty, but how is the first aromatic ring formed? Not to worry, the chemists covered that as well. It turns out that acetylene and polyacetylenes are formed, and from there, the aromatics evolve. It is helpful to see the chemical schemes of how this happens, but the references that I cited are review articles, so getting permission to reproduce the best figure might be challenging. If you are interested, I encourage you to look into references (1) and (2).
The important thing to recognize is that PAHs are highly fluorescent. Figure 1 shows an absorbance-transmittance-excitation-emission (ATEEM) result for a standard PAH mixture; in this case, we are looking at a mixture of benzene, toluene, ethyl benzene, xylenes, and naphthalene (BTEXN).


FIGURE 1: (a) EEM spectra of BTEXN Mixture (500 g/L) in raw water; (b) EEM Spectra of raw water.
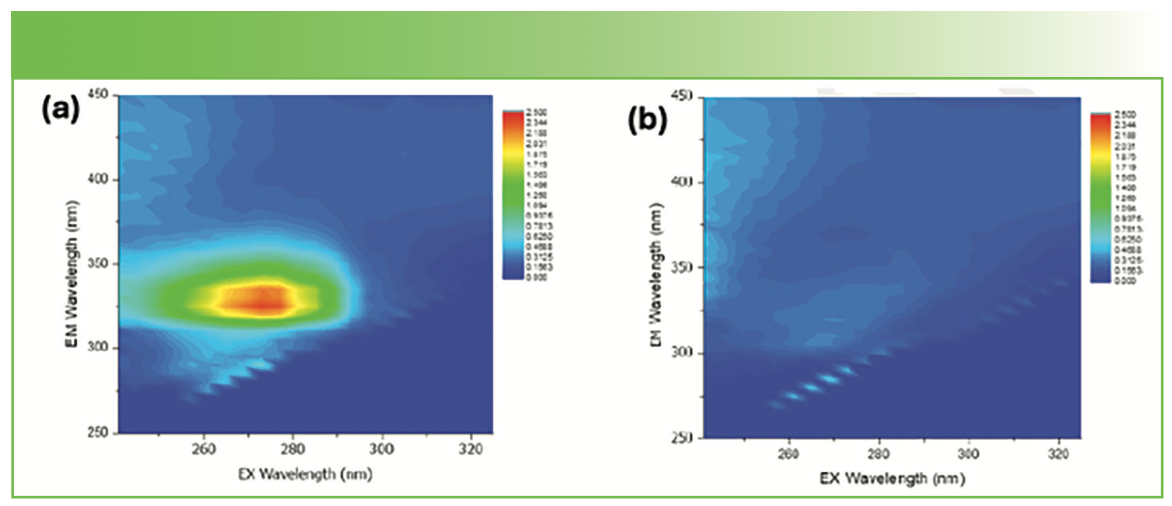
ATEEM is a technology that produces the excitation and emission profiles of compounds, corrected for self-absorption and emission. The figure is reproduced from (3). Because of the volatility and toxicity of these compounds, it is important to know when they are present in the environment. Altogether, the development of the ATEEM technology provides a reliable method to follow their presence.
Benzopyrene
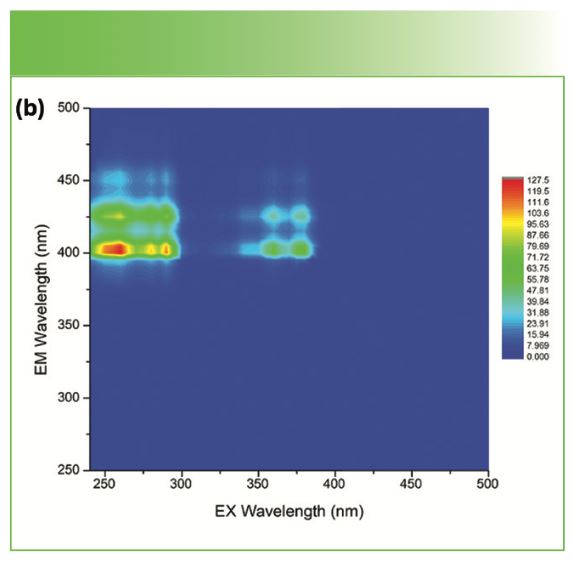
Figure 2a shows our fluorescence spectra recorded from a crystal of benzopyrene using available laser wavelengths: 325, 473, 532, 633 and 785 nm. I have scaled them so that the fluorescent tails between 800 and 900 nm overlap. The major fluorescent band peaks are just above 500 nm. Figure 2b shows the ATEEM pattern recorded by our Fluorescence Group. When comparing Figures 2a and 2b, you can see that the fluorescence spectra in the ATEEM plot (Figure 2b) do not overlap with the spectrum I recorded on a Raman microscope (Figure 2a). At first, this was disturbing, but I later realized that solid-state emission is usually different from that of a solution that was the sample form used for the ATEEM measurement. The wavelength differences between our fluorescence measurement of the solid and that of the ATEEM in solution is rather large. But it is well-known that the electronic structure of the solid state will be drastically different from that in solution (4). Because of intermolecular interactions, the electronic levels are often red-shifted, which is what we observed.


FIGURE 2a: Fluorescence spectra of benzopyrene recorded on the Raman microscope with excitation wavelengths of 325, 473, 532, 633, and 785 nm.
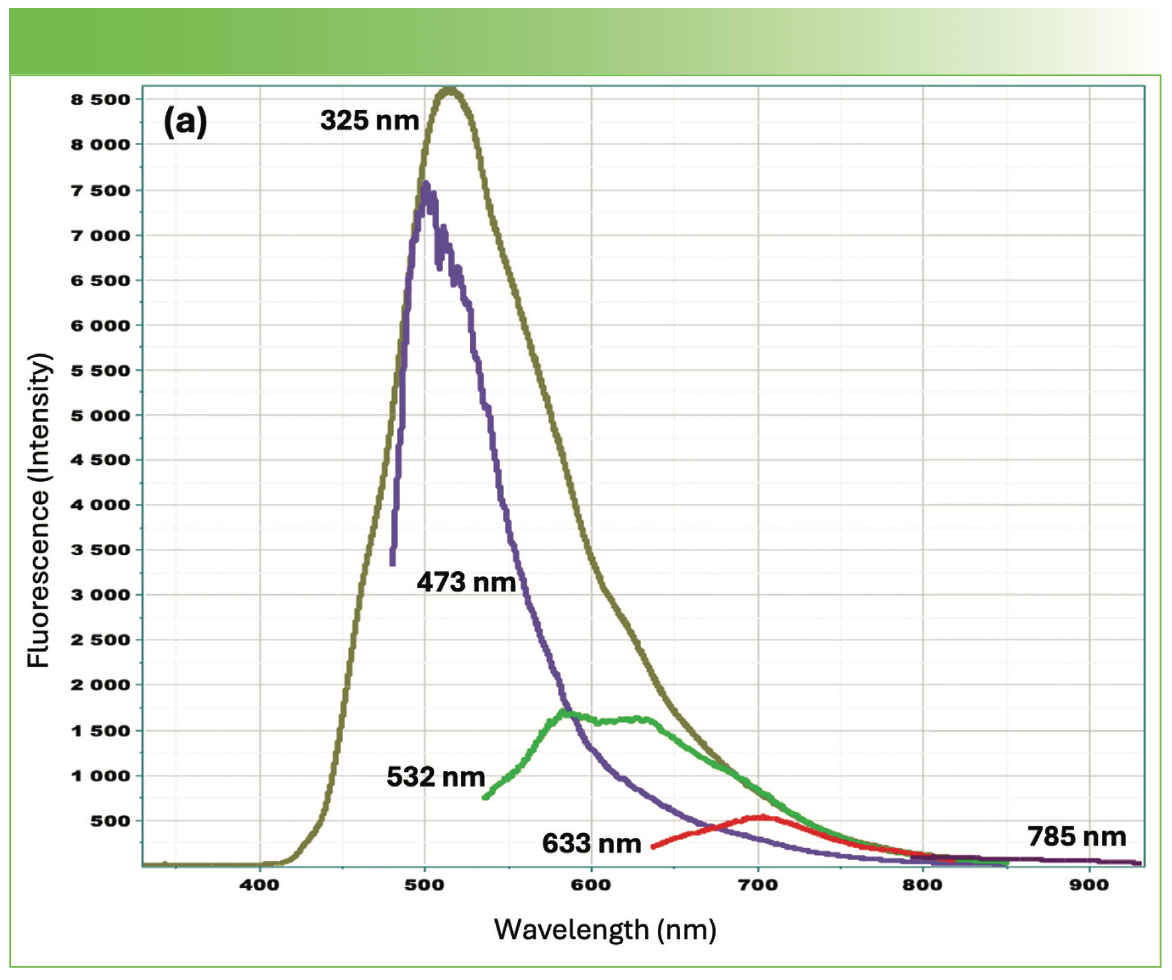


FIGURE 2b: Benzopyrene ATEEM spectra in the solution phase.
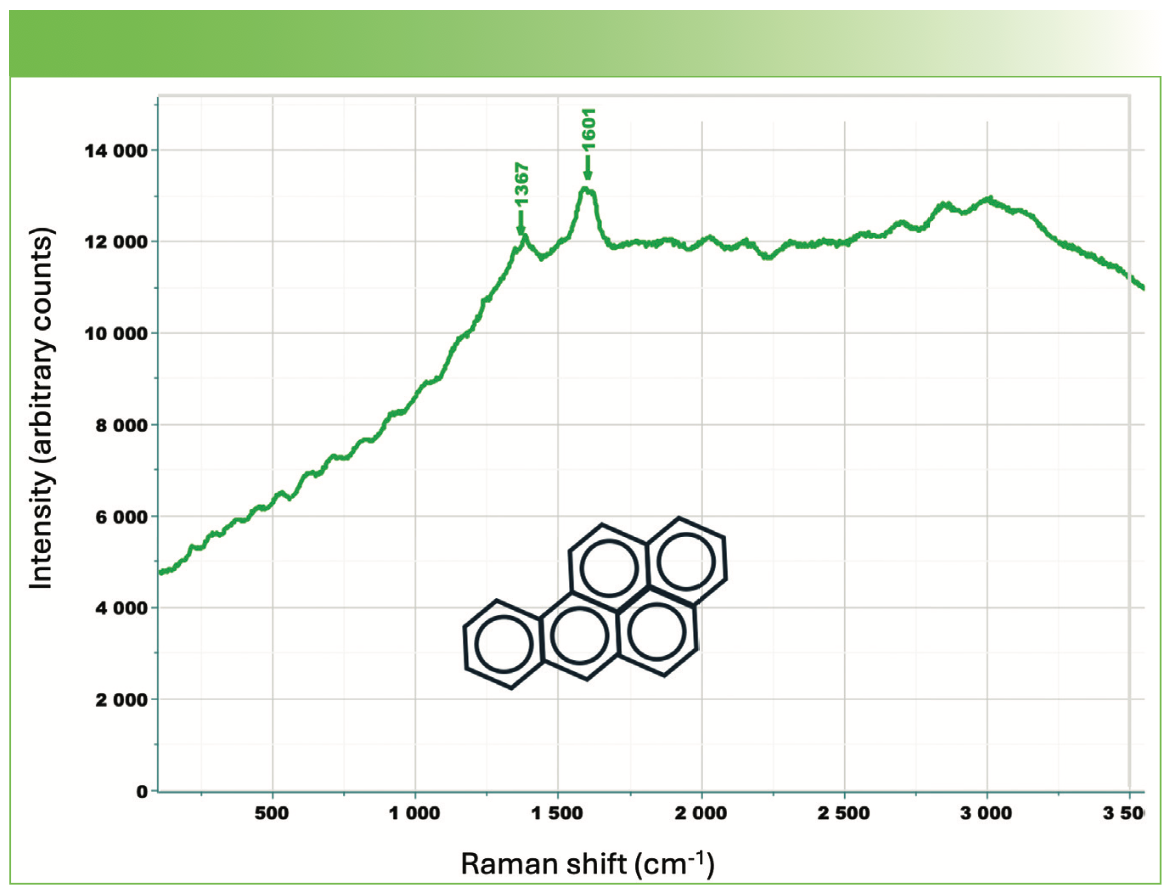
To pursue my conjecture, I want to show that we can get conversion to carbon. Figure 3 shows the fluorescence spectrum of benzopyrene acquired on a Raman instrument after “cooking” it in the laser beam for a while. Examination of the spectrum shows that while there is still a highly fluorescent background present, the carbon bands near 1367 and 1600 cm-1 are clearly visible.


FIGURE 3: Raman and fluorescence spectrum of benzopyrene excited at 532 nm, using 100% power and illumination for a while to convert some of the material in the focus spot to carbon.
PAH Calibration Mixture
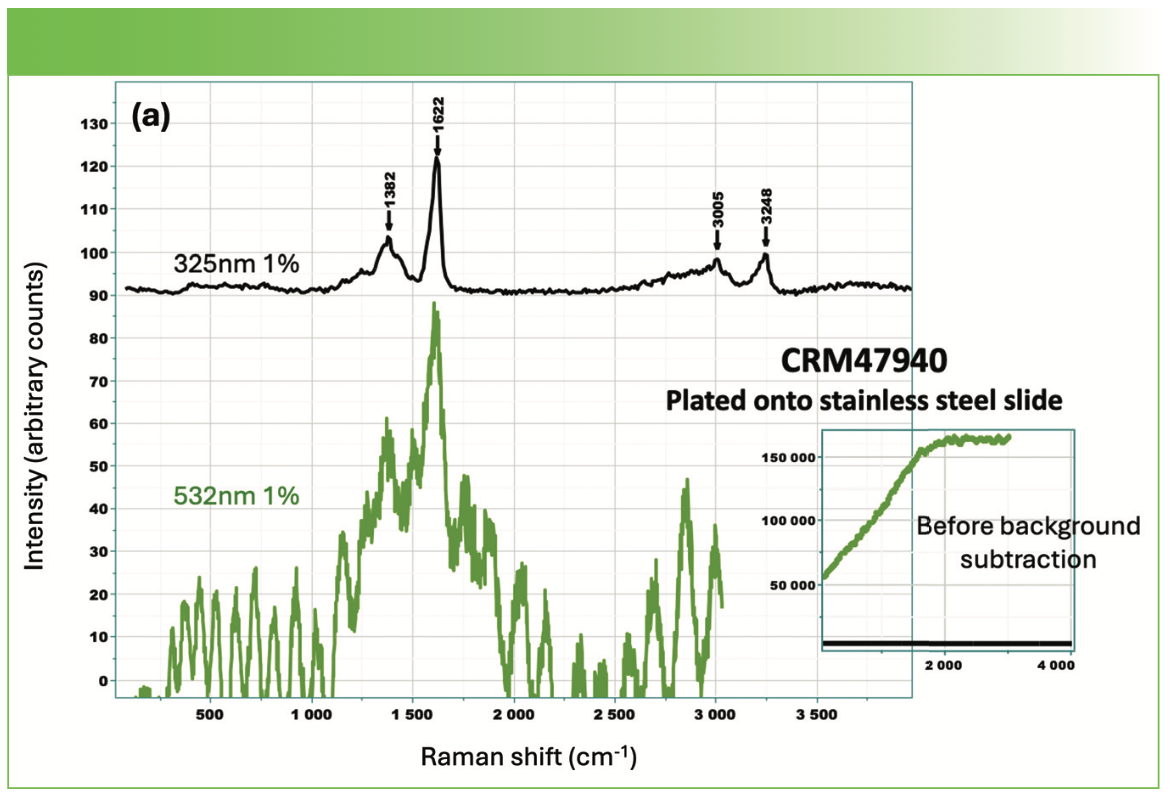
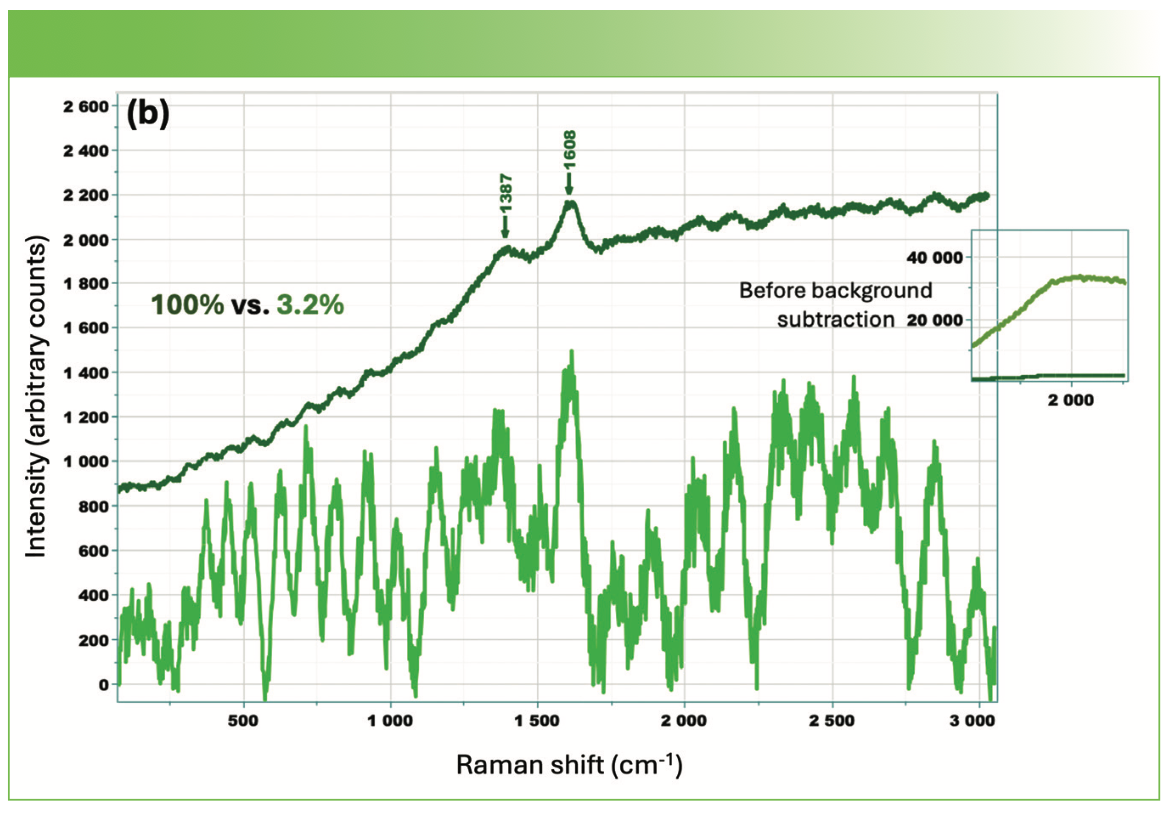
The next material that I used to explore this idea was a PAH calibration mixture for polynuclear aromatic hydrocarbons– CRM47940, from Supelco. It contains 32 PAHs dissolved in acetonitrile. I placed a drop on a stainless steel slide and allowed it to dry. Unless the PAHs self-segregate, we have to assume that the laser is focused on multiple species. Figure 4a shows a spectrum of the dried film excited at 325 and 532 nm, both at 1% laser intensity. Even at this low intensity, we only observe carbon, albeit at somewhat unusual frequencies. The G band, which usually appears near 1600 cm-1, appears at 1622 cm-1 in this spectrum. The D band appears at 1382 cm-1, which is somewhat high, but it is not surprising for an ultraaviolet (UV) excitation. Of course, there is the possibility that these bands represent resonance Raman (RR) bands of the collection of polyaromatics. In fact, Zerbi and others published a study of the Raman spectra of polyconjugated molecules (including aromatics), which clearly shows that a large cluster of fused benzene rings produces spectra with the largest band near 1360 cm-1 and the next largest band near 1600 cm-1 (Figure 10 in reference [5]). Note that in the 325 nm-excited spectrum, 1382 + 1622 = 3004 cm-1, which is quite close to 3005, and 2 x 1622 = 3244 cm-1, which is quite close to 3248 cm-1. This behavior is consistent with RR behavior. The spectrum excited in the green has a very high background that produces interference fringes after background subtraction. That is undoubtedly because of the thin film sample. Figure 4b shows spectra of the same material excited at 532 nm, but with 100% versus 3.2% power. At low power, the fluorescence is much higher than at full power. This means that at high powers, the laser is altering the material so the number of fluorescent compounds goes down as the classical carbon signal is formed.

 versus 532 nm (green spectrum). The small insert shows the results as recorded. The spectrum excited at 532 nm is overwhelmed by fluorescence while the spectrum excited at 325 nm appears to be a straight line on this scale. After background subtraction, the 325 nm-excited spectrum has a flat baseline and clear evidence for Raman bands. The background-subtracted spectrum excited at 532 nm is dominated by interference ripples from the dried film and the presence of carbon-like bands between 1300 and 1700 cm-1.")
FIGURE 4a: Comparison of spectra of CRM47940 plated onto a stainless steel slide and excited at 325 nm (black spectrum) versus 532 nm (green spectrum). The small insert shows the results as recorded. The spectrum excited at 532 nm is overwhelmed by fluorescence while the spectrum excited at 325 nm appears to be a straight line on this scale. After background subtraction, the 325 nm-excited spectrum has a flat baseline and clear evidence for Raman bands. The background-subtracted spectrum excited at 532 nm is dominated by interference ripples from the dried film and the presence of carbon-like bands between 1300 and 1700 cm-1.

. The small insert shows the results as recorded before background subtraction. The spectra are shown after background subtraction in the larger part of the figure. The spectrum excited with full-laser power shown in dark green on top shows clear evidence for carbon-like bands. The spectrum recorded at 3.2% laser power elsewhere is dominated by interference fringes as in Figure 4a with less evidence for carbon formation.")
FIGURE 4b: Comparison of spectra of CRM47940 plated onto a stainless steel slide and excited at 532 nm at 100% versus 3.2% laser intensity (two shades of green). The small insert shows the results as recorded before background subtraction. The spectra are shown after background subtraction in the larger part of the figure. The spectrum excited with full-laser power shown in dark green on top shows clear evidence for carbon-like bands. The spectrum recorded at 3.2% laser power elsewhere is dominated by interference fringes as in Figure 4a with less evidence for carbon formation.
Asphalt
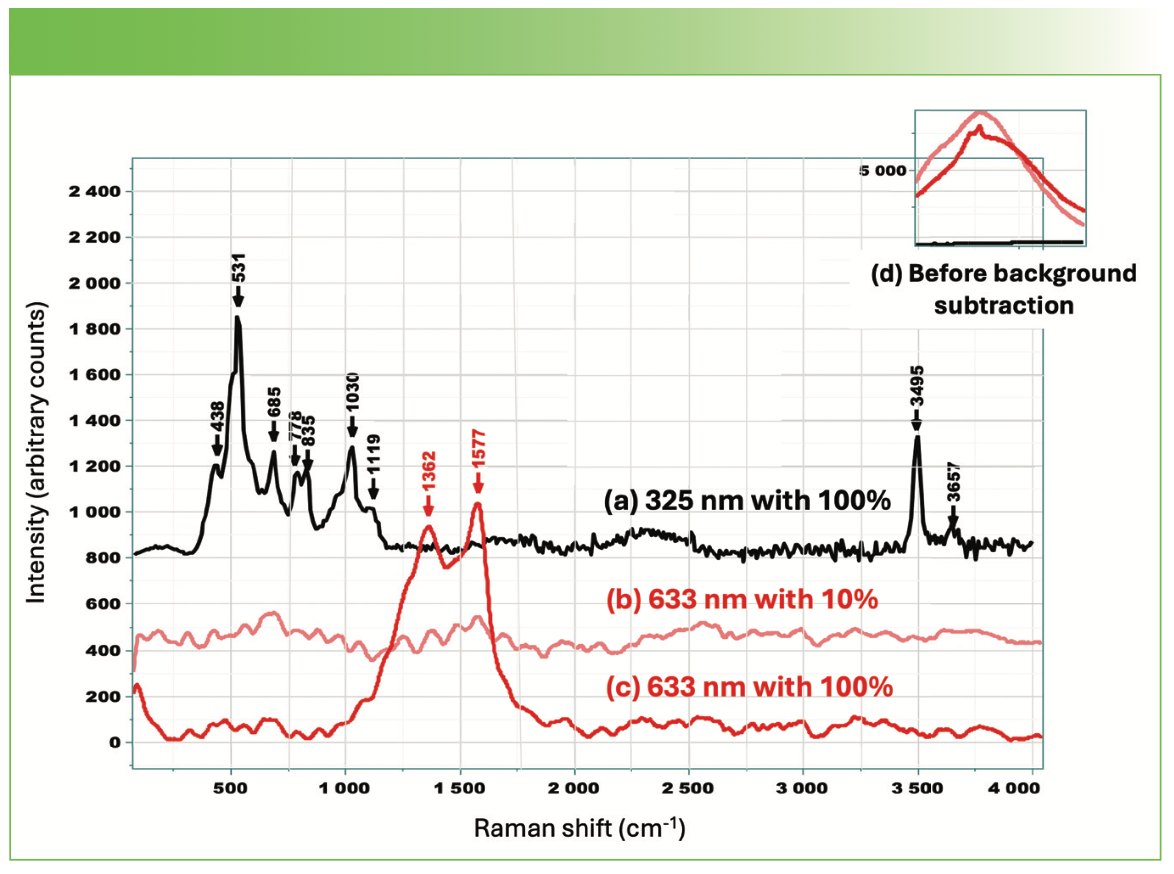
I also examined asphalt to determine what its fluorescent behavior is and whether there is evidence for carbon. The insert in Figure 5 shows its spectra excited at 325 nm with full power, and then with 10 and 100% power at 633 nm; the enlarged spectra show the behavior after background subtraction. Note that for many years, Professor Sandy Asher of the University of Pittsburgh has been saying that by exciting in the UV, one can avoid the fluorescence that is emitted in the visible, and the Figure 5 insert supports his argument (6). But these spectra reveal even more. Even full power at 325 nm did not carbonize the asphalt material whose Raman spectrum is shown in Figure 5 (actually, the spectrum excited at 325 nm may represent a mineral in the gravel that is combined with the asphalt; note that the sharp OH band at 3495 cm-1 is consistent with a hydroxyl group in a mineral). Because there is neither fluorescence nor carbon in this spectrum, it is possible that the high power laser drove off all the PAHs. On the other hand, the spectra generated at 633 nm show that at low power there is only fluorescence, but at 100% power at this long wavelength, the material converts to carbon. I actually ran a power series, varying the laser intensity between 1 and 100%. The fluorescence peaked at 25% where the carbon just began to appear; while the fluorescence signal was approximately the same at 10 and 100%, though only at 100% did the carbon appear clearly (these data are not shown here). The same power series was run at 325 nm. Although the carbon never appears with this excitation (even at the highest power), the Raman bands of the unknown species grew more rapidly than the fluorescent background, as if the laser was driving off the material that coats the mineral and enables the signal of the mineral to grow without the attenuation of the PAHs.

 excited at (a) 325 nm with 100% laser power; (b) 633 nm excitation with 10%; and (c) 633 nm with 100% laser power. The major spectra in the figure are after the fluorescence background is subtracted. (d) Insert shows the spectra dominated by the fluorescence before background subtraction.")
FIGURE 5: Fluorescence and Raman spectra of asphalt (after background subtraction) excited at (a) 325 nm with 100% laser power; (b) 633 nm excitation with 10%; and (c) 633 nm with 100% laser power. The major spectra in the figure are after the fluorescence background is subtracted. (d) Insert shows the spectra dominated by the fluorescence before background subtraction.
Summary
I am sure that this discussion will not help you avoid a fluorescent background on a particular sample. What I am hoping is that by providing you insight, there may be ways to design your experiment that will avoid the fluorescence. This may be as simple as changing the excitation wavelength. Keep in mind that 785 nm is not always the best choice. Especially when working on a Raman microscope, there are cases where red or green work better, especially for clean industrial products like pharmaceuticals. For this reason, when selecting a system’s components, I like to suggest that a red laser be purchased with green and near-infrared, if there is a way to come up with the funds. There is no way of predicting what wavelength will be best.
Before closing, I want to make another point. All carbons are not alike, and people are finding that the Raman characteristics are useful in identifying which type of carbon is present. My colleague Peng Miao and I will provide a simplified summary of this in my next column. Whether the carbon is graphitic, graphitizable or not, or amorphous with lots of sp3 bonds connecting sp2 clusters, the Raman spectrum can provide information on the structure. We hope to provide valuable insights into this active area.
References
(1) Richter, H.; Howard, J. B. Formation of Polycyclic Aromatic Hydrocarbons and Their Growth to Soot – A Review of Chemical Reaction Pathways. Progress in Energy and Combustion Science 2000, 26, 565–608. DOI: 10.1016/S0360-1285(00)00009-5
(2) Reizer, E.; Viskolcz, B.; Fiser, B. Formation and Growth Mechanisms of Polycyclic Aromatic Hydrocarbons: A Mini Review. Chemosphere 2022, 291, 132793. DOI: 10.1016/j.chemosphere.2021.132793
(3) ASTM Standard Test Method for Detection of Water-soluble Petroleum Oils by A-TEEM Optical Spectroscopy and Multivariate Analysis D8431-22, and A. Gilmore and L. Chen, Optical Early Warning Detection of Aromatic Hydrocarbons in Drinking Water Sources with Absorbance, Transmission, and Fluorescence Excitation-Emission Mapping (A-TEEM) Instrument Technology. Proc. SPIE 2019, 10983, Next-Generation Spectroscopic Technologies XII.
(4) Mcclure, D. S. Electronic Spectra of Molecules and Ions in Crystals Part I. Molecular Crystals Solid State Physics 1959, 1–47. DOI: 10.1016/S0081-1947(08)60478-6
(5) Castiglion, C.; Tommasini, M.; Zerbi, G. Raman Spectroscopy of Polyconjugated Molecules and Material: Confinement Effect in One and Two Dimensions. Phil. Trans. R. Soc. Lond. A 2004, 362, 2415–2459. DOI: 10.1098/rsta.2004.1448
(6) Asher, S. A.; Johnson, C. R. Raman Spectroscopy of a Coal Liquid Shows that Fluorescence Interference is Minimized with Ultraviolet Excitation. Science 1984, 225, 311–313. DOI: 10.1126/science.6740313


Fran Adar is the Principal Raman Applications Scientist for Horiba Scientific in Edison, New Jersey. Direct correspondence to: SpectroscopyEdit@mmhgroup.com. ●


AI-Powered SERS Spectroscopy Breakthrough Boosts Safety of Medicinal Food Products
April 16th 2025A new deep learning-enhanced spectroscopic platform—SERSome—developed by researchers in China and Finland, identifies medicinal and edible homologs (MEHs) with 98% accuracy. This innovation could revolutionize safety and quality control in the growing MEH market.


New Raman Spectroscopy Method Enhances Real-Time Monitoring Across Fermentation Processes
April 15th 2025Researchers at Delft University of Technology have developed a novel method using single compound spectra to enhance the transferability and accuracy of Raman spectroscopy models for real-time fermentation monitoring.

Nanometer-Scale Studies Using Tip Enhanced Raman Spectroscopy
February 8th 2013Volker Deckert, the winner of the 2013 Charles Mann Award, is advancing the use of tip enhanced Raman spectroscopy (TERS) to push the lateral resolution of vibrational spectroscopy well below the Abbe limit, to achieve single-molecule sensitivity. Because the tip can be moved with sub-nanometer precision, structural information with unmatched spatial resolution can be achieved without the need of specific labels.


