FT-IR Microscopy, Part 2: Mid-IR Sampling with DRIFTS, IRRAS, and ATR
Fourier transform infrared (FT-IR) microscopy using reflection methods (diffuse reflection, reflection/reflection-absorption, or attenuated total reflectance) typically requires less sample preparation than transmission. However, optimal results will depend upon the sample and, in particular, the sample surface.
Practical Considerations
Reflection methods are generally less efficient than transmission measurements due to sample and instrument limitations, although large objectives help overcome some of the latter (collecting a large cone of light). The advantage is that sample preparation is generally simpler and quicker.
Reflection
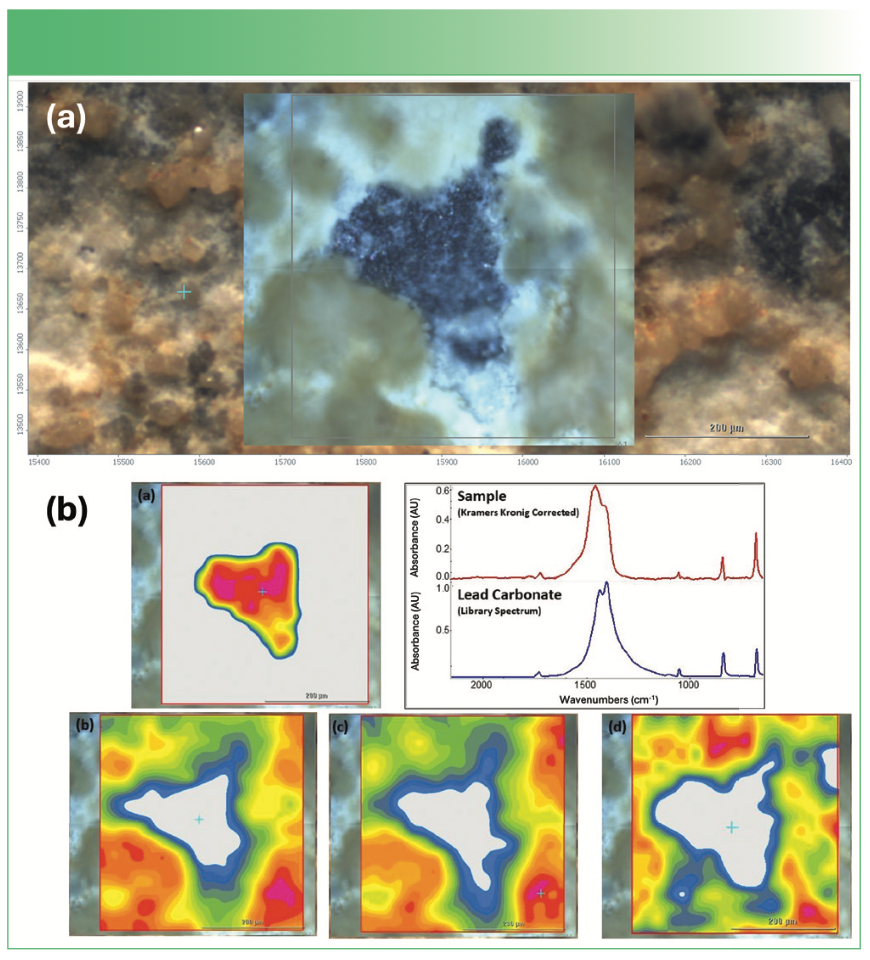
In bulk diffuse reflection spectroscopy, the infrared (IR) radiation illuminates a large sample area. The sample is therefore mixed with a non-absorbing diluent (like potassium bromide [KBr]) to alleviate excess absorption. In microscopic reflection, the light can be directed onto a single crystal or domain, as in a tablet, resulting in localized specular reflection, so no diluent is needed. Reflection works well with white tablets or materials with low absorption; strongly absorbing samples, however, can be problematic. Ink on paper and fabrics is effectively analyzed with no further sample preparation; a substrate spectrum (paper, fabric) is normally subtracted to yield the spectrum of the ink. This is shown in Figure 1 (using attenuated total reflectance [ATR]) where a numeral was altered using a second ink. Figure 2 shows a mining sample of lead ore with profiles showing different compositions in the ore. The only preparation for most samples (such as pharmaceutical tablets) involves ensuring there is no coating, like titanium dioxide. Tablets and other small samples can be attached to a glass slide via double stick tape or blu-tack to prevent movement during positioning or mapping.

 The visual image appears to be an “8”, but the (b) IR data reveals two different inks are present. We note the original ink reveals a “3” and the additional added ink falsely alters the visual image to appear as an “8.”")
FIGURE 1: ATR map of an altered ink printing. (a) The visual image appears to be an “8”, but the (b) IR data reveals two different inks are present. We note the original ink reveals a “3” and the additional added ink falsely alters the visual image to appear as an “8.”


. (a) Visible image of the sample positioned in the microscope, (b) profiles of various lead compounds within the sample (from a lead mine in Wisconsin).")
FIGURE 2: Specular reflection from a geologic sample. The IR data reveals different lead compounds. The sample was analyzed as received (no polishing). (a) Visible image of the sample positioned in the microscope, (b) profiles of various lead compounds within the sample (from a lead mine in Wisconsin).
IRRAS (Reflection-Absorption)
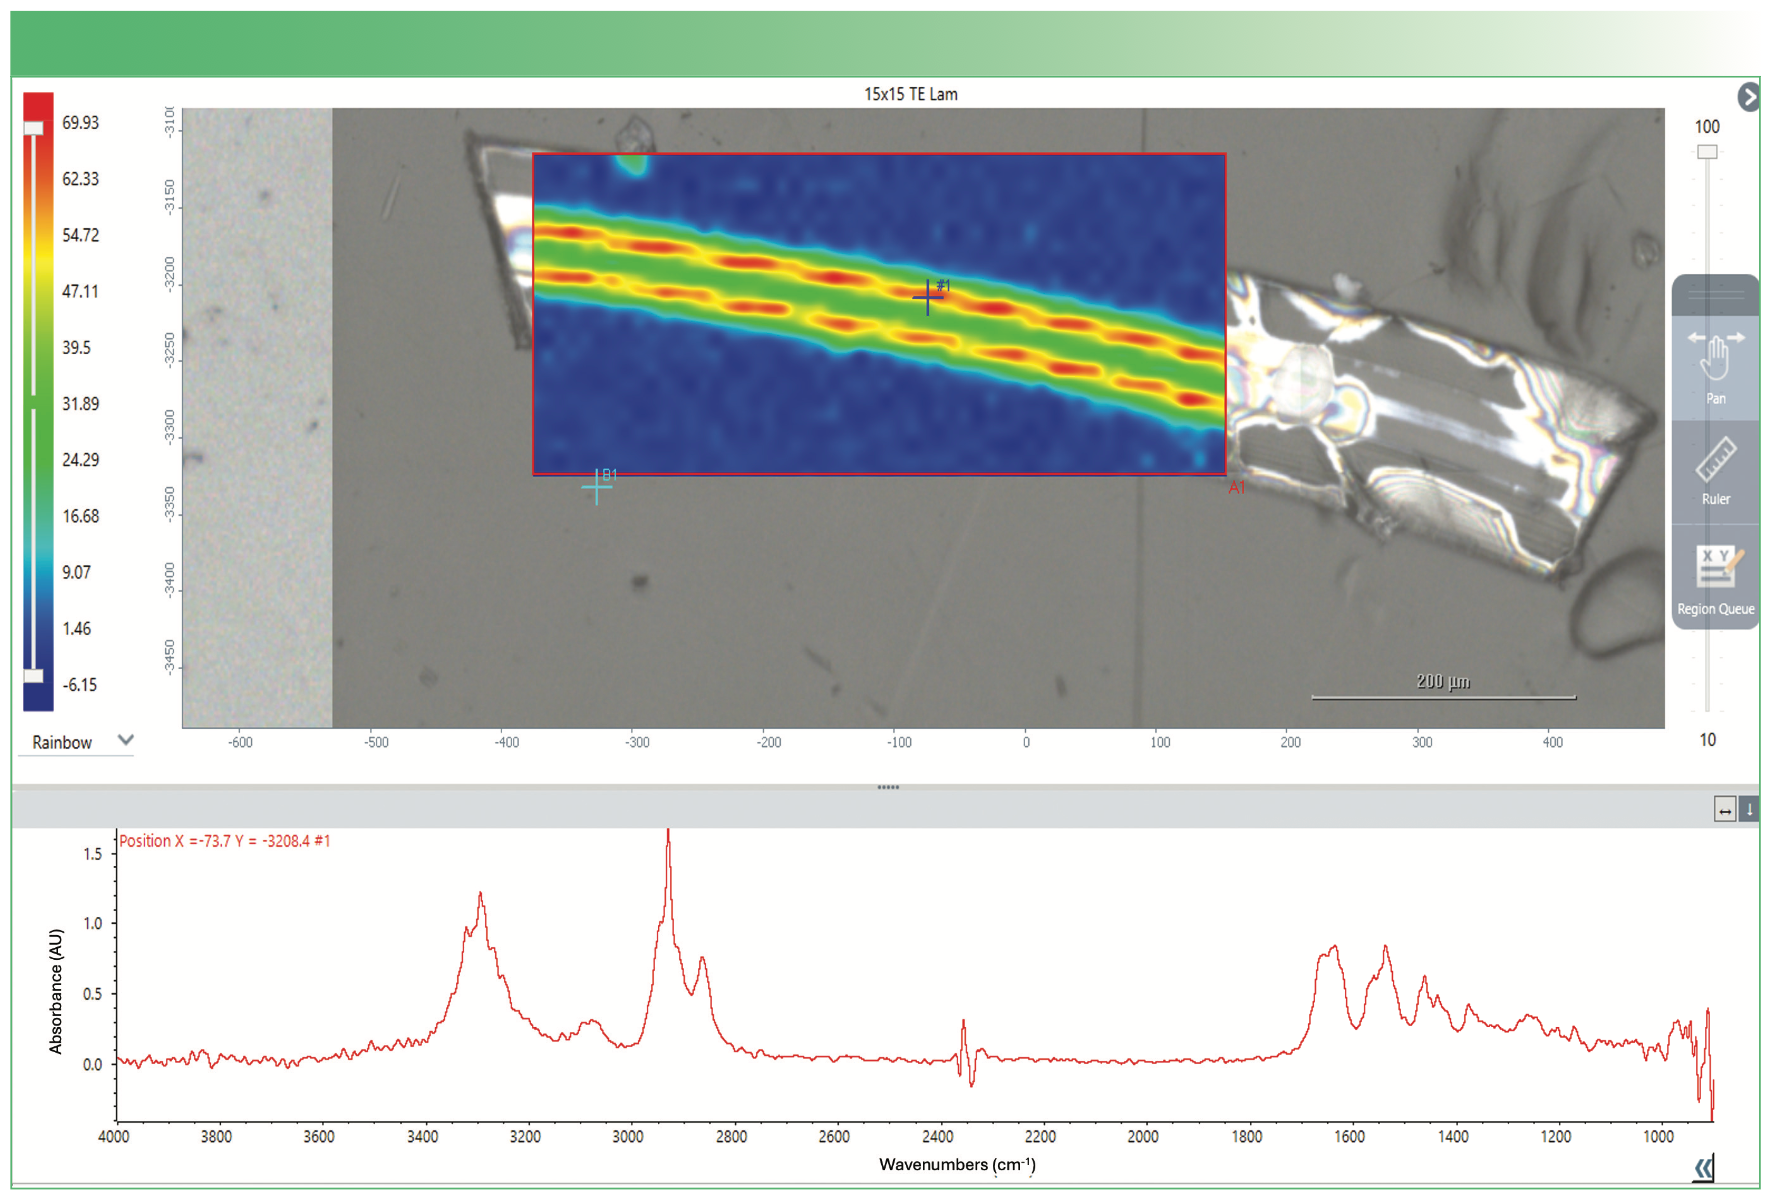
For infrared reflection absorption spectroscopy (IRRAS), the sample is mounted on a reflective substrate, such as a gold slide. The IR beam will penetrate the sample, reflect off the substrate, and pass through the sample a second time. As with transmission (1), the sample must be thin, typically under 20 µm, to prevent excess absorption (depending upon composition). A multilayer film mounted on a gold-coated slide is shown in Figure 3; excellent data and spatial resolution were achieved. The two-slide cutting method (used to prepare the sample in Figure 3) and the microtome techniques discussed previously are excellent for obtaining thin samples. Cast films and coatings on metal (like lubricant residue) are excellent samples, where no additional treatment of the sample is needed.

, 20 μm thick, with polypropylene and polyethylene and transition regions (green). The spectrum displayed is from the point with the crosshair.")
FIGURE 3: High-resolution IR map of a polymer multilayer film using IRRAS. The IR data shows two nylon layers (in red), 20 μm thick, with polypropylene and polyethylene and transition regions (green). The spectrum displayed is from the point with the crosshair.
ATR (Tip)
The microscope ATR crystals commonly available vary in diameter from 100–350 µm and may be zinc selenide (ZnSe), diamond, or germanium (Ge, the most common). The spectrum obtained depends upon the size and shape of the aperture image on the ATR tip, the intimate contact of the crystal with the sample, and the depth of penetration of the IR beam into the sample.
The ATR crystal acts as a magnifier, reducing the aperture size as set mechanically by a factor of one over the crystal’s index of refraction. For diamond and ZnSe, this is 2.4, so setting an aperture of 80 µm results in an effective target aperture of 33.3 µm. For Ge, the index is 4, so the 80-µm aperture is now effectively 20 µm at the sample. This enables the very high resolutions reported by many microscopes; with a mechanical aperture setting of 10, the effective aperture is under 3 µm.
As with bulk ATR, the crystal must make intimate contact with the sample. The instrument sets the downward force through either software or manual control. The pressure at the sample is a result of this force divided by the contact area. When using a 100-µm tip, this can result in sample damage or penetration, as the pressure is huge at the tip. Insufficient force will result in poor spectra, but high force must be avoided to prevent damage (to the sample or the ATR crystal). Figure 1 shows the effective use of ATR on a paper and ink sample.
The IR beam penetrates into the sample from the tip of the crystal. The depth of this penetration will affect the intensity and shape of the IR peaks. This is discussed in detail elsewhere (2). In microscopy, the Ge crystal has strong advantages (high index, good hardness, non-reactive) and is most common.
ATR mapping involves successive lifting of the tip, stage movement, and contact re-establishment. This allows an area to be probed but risks contamination if the tip picks up a residue and then moves it around (like an oil or adhesive). This may require frequent cleaning of the tip. The lift-move-contact steps also make this a time-consuming experiment.
ATR Imaging
This specialized technique uses a large Ge crystal (around 500 µm) which is placed in contact with the sample once. Images (area maps) are collected by moving the IR beam across the face of the crystal. Frequently, an imaging (array) detector is used for efficiency. The area to be imaged lies fully under the crystal; since no move is needed, contamination is not an issue. Also, large maps or images can be obtained quickly since the time needed for lift-move-contact is eliminated.
The key sampling concern is the sample contact, as mentioned above. Since the crystal is large, the sample must be soft enough to permit good contact or perfectly flat to match the crystal surface. This was the case for the cottonseed shown in Figure 4, where the sample was soft enough to “mold” to the crystal surface. Profiling of the imaging spectra provided evidence for the spatial distribution of desirable and undesirable components. Extremely hard samples (like ceramics or rocks) can be analyzed if the sample is polished to a fine finish; any surface irregularities will result in holes in the data.

 cottonseed oil; (b) cellulose, (c) proteins, (d) gossypol; shown to be concentrated in the inclusions in the seed.")
FIGURE 4: Imaging ATR data from a cottonseed intended for dairy cattle feed. The key concern was the gossypol, a constituent that causes mild to severe issues with milk production. The spectra shown are single-point spectra from within the circled regions in each profile. (a) cottonseed oil; (b) cellulose, (c) proteins, (d) gossypol; shown to be concentrated in the inclusions in the seed.

Conclusion
Reflection offers many advantages in terms of time and effort, although some loss in efficiency relative to transmission provides a trade-off. In a busy laboratory, the ability to simple place a sample and collect data makes reflection the go-to method of choice.
Acknowledgments
The author would like to acknowledge and thank Robert Heinz for his assistance in the preparation of this manuscript.
References
(1) Bradley, M. FT-IR Microscopy: Sampling by Transmission. Spectroscopy 2024, 39 (6), 22–24. DOI: 10.56530/spectroscopy.pt3476i8
(2) Bradley, M. Pathlength Considerations with ATR Sampling in FTIR. American Laboratory 2018, 50 (7), 20–22. https://www.labcompare.com/10-Featured-Articles/352695-Pathlength-Considerations-With-ATR-Sampling-in-FTIR/
Michael S. Bradley serves on Spectroscopy’s Editorial Advisory Board and is a former Product Manager with Thermo Fisher Scientific in Madison, Wisconsin. Direct correspondence to: mike.s.bradley@gmail.com ●


AI Shakes Up Spectroscopy as New Tools Reveal the Secret Life of Molecules
April 14th 2025A leading-edge review led by researchers at Oak Ridge National Laboratory and MIT explores how artificial intelligence is revolutionizing the study of molecular vibrations and phonon dynamics. From infrared and Raman spectroscopy to neutron and X-ray scattering, AI is transforming how scientists interpret vibrational spectra and predict material behaviors.


Real-Time Battery Health Tracking Using Fiber-Optic Sensors
April 9th 2025A new study by researchers from Palo Alto Research Center (PARC, a Xerox Company) and LG Chem Power presents a novel method for real-time battery monitoring using embedded fiber-optic sensors. This approach enhances state-of-charge (SOC) and state-of-health (SOH) estimations, potentially improving the efficiency and lifespan of lithium-ion batteries in electric vehicles (xEVs).


New Study Provides Insights into Chiral Smectic Phases
March 31st 2025Researchers from the Institute of Nuclear Physics Polish Academy of Sciences have unveiled new insights into the molecular arrangement of the 7HH6 compound’s smectic phases using X-ray diffraction (XRD) and infrared (IR) spectroscopy.

