An Accurate Mass Database for the Analysis of Pesticides and Veterinary Drugs using Liquid Chromatography-High-Resolution Mass Spectrometry
Here, the process to build an accurate mass database is thoroughly described and applications are commented on.
An accurate mass database, which includes retention time, ionization mode, and characteristic ions of the target compounds (including possible adducts), has been created for the screening of more than 350 pesticides and veterinary drugs by ultrahigh-pressure liquid chromatography (UHPLC)–orbital trap MS. The database allows the automated search of the analytes, and then, the confirmation and quantification of the detected compounds, all in one injection. Here, the entire process to build the database is thoroughly described and applications are commented on.
Pesticides and veterinary drugs are widely used in agriculture or farming to increase production and to fight against pests and infection (1). The occurrence of pesticide and veterinary drug residues in food and the subsequent risk for consumers is cause for concern in the field of food and animal feed safety (2). Thus, extensive legislation related to residue monitoring entails a steady increase in the number of analytes to be monitored in food and feed because of the large number of permitted and commercially available substances (3). Therefore, there is a significant challenge in the development and application of generic methodologies to reduce the work involved in this monitoring. Emerging multiresidue methods are capable of monitoring a large number of compounds using a single analytical method (4). Despite the difficulty of analyzing compounds belonging to different families because of their different physicochemical properties, their determination is feasible (5,6). The next step is the combination of these methods with generic extraction procedures to cover the widest possible range of analyzed compounds (7). To maintain sample throughput and cost-effectiveness, an interesting alternative is the development of generic liquid chromatography–mass spectrometry (LC–MS) screening methods for the simultaneous detection and identification of a wide range of these compounds and their metabolites (8). Despite the fact that triple-quadrupole MS has been conventionally used (9), it presents some limitations (see Figure 1) when a huge number of contaminants must be analyzed simultaneously. These drawbacks can be overcome by the use of high-resolution mass spectrometry (HRMS) instruments, such as an orbital trap system, which operates in the full-scan mode (theoretically, there are no limitations for the number of monitored compounds) (5) and provides accurate mass measurements. Furthermore, isotopic patterns and accurate mass measurements are tools that facilitate the confirmation process (10). The utility of full scan ultrahigh-pressure liquid chromatography (UHPLC)–orbital trap MS (11) is sufficient to enable detection and accurate mass measurement of a wide range of residues at low concentration levels in complex sample matrices.
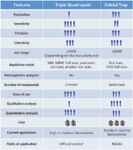
Figure 1: Comparison of the analytical performance of low-resolution (triple-quadrupole) and high-resolution (orbital trap) mass spectrometry instrumentation.
This article reports on the development of a database used as a screening method for more than 350 pesticides and veterinary drugs detected using UHPLC–orbital trap-MS. The created database includes accurate masses of the target ions and retention time (tR) data. New compounds can be included, which allows the database to be upgraded easily.
Materials and Methods
Reagents and Chemicals
Veterinary drugs and pesticide analytical standards were purchased from Riedel-de-Haën, Dr. Ehrenstorfer GmbH, Sigma-Aldrich, Fluka, Santa Cruz, European Pharmacopoeia, Witega, and LGC Standards. Individual stock standards solutions (200–400 mg/L) were prepared in methanol, acetonitrile, or acetone, and they were stored at 5 °C or –18 °C (veterinary drugs). LC-grade methanol, acetonitrile, and acetone were obtained from Fluka. A solution for each family of veterinary drugs was prepared from corresponding individual stock standard solutions in methanol or acetonitrile, and two multipesticide solutions were prepared in methanol and acetone. The solutions of the families of compounds showing a low stability (that is, tetracyclines or penicillins) were renewed monthly. Then, a multicompound working solution was prepared by combining suitable aliquots of each individual standard stock solution and diluting them with LC–MS-grade methanol. This solution was kept at –18 °C. Formic acid (purity >98%) and ammonium formate (purity >99%) were obtained from Panreac. LC–MS water was purchased from Scharlau. For accurate mass calibration, a mixture of caffeine, Met-Arg-Phe-Ala acetate salt (MRFA) and Ultramark 1600 (ProteoMass LTQ/FT-Hybrid ESI positive mode calibration mix) from Sigma-Aldrich was used in the orbital trap analyzer.
UHPLC–Orbital Trap MS Analysis
The separation of the analytes was carried out using a Transcend 600 LC system (Thermo Fisher Scientific). The LC parameters are shown in Figure 2. Aliquots of 10 μL of the sample extract were injected into the chromatographic system.
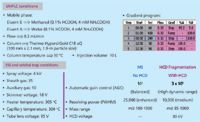
Figure 2: Operational parameters used in the UHPLCâorbital trap MS method developed.
The UHPLC system was coupled to a single-stage orbital trap mass spectrometer (Exactive Orbitrap, Thermo Fisher Scientific) operating with a heated electrospray ionization (ESI) interface (HESI-II, Thermo Fisher Scientific), in positive (ESI+) and negative ionization mode (ESI-) using the operational parameters shown in Figure 2. All of the analyses were performed without lock mass. Mass accuracy was carefully monitored by checking with multicompound standards every day, evaluating (once a week), and calibrating when necessary (every two weeks at least) with mass accuracy standards (see "Reagents and Chemicals" section). Data were acquired using the external calibration mode. All data were processed using Xcalibur version 2.2.1 software (Thermo Fisher Scientific) with Qual and Quanbrowser. Genesis peak detection was applied. Automated compound screening software (ToxID 2.1.1, Thermo Fisher Scientific) was used for screening and LCQuan 2.6 software (Thermo Fisher Scientific) was used for quantification.
Results and Discussion
Development of the Database and Analysis Method
In the present study, a high number of compounds (>350) of the main families of veterinary drugs and pesticides was selected (Table I). To develop a database of target compounds, it is essential to perform a previous characterization to obtain important parameters such as tR, ionization mode, characteristic ions, and possible adducts (that is, with Na+ or NH4+). For that, an aliquot of each individual standard solution (250 μg/L) was injected into the UHPLC–orbital trap MS system. Generic atmospheric pressure ionization (API) source conditions (12) were applied. Generic chromatographic (13) conditions were also used, with a mobile phase consisting of water and methanol containing ammonium formate and formic acid (7,12,13). MS acquisition in positive and negative ion modes was performed without and with fragmentation in the higher energy collisional dissociation (HCD) collision cell. Although the elution gradient used in this method is not as fast as other UHPLC gradients (total running time = 14 min), it is adequate for a generic method for several reasons:
- The high number of monitored compounds in a single injection is already an effective and real reduction of analysis time;
- Matrix effects can be diminished by the early elution of matrix components.
- The coelution of compounds is reduced, which improves identification and confirmation processes.
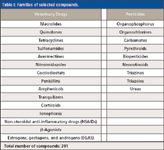
Table I: Families of selected compounds.
The basic procedure to identify the analytes included in the database was based on the use of tR and mass accuracy. Thus, identification was carried out by retention-time windows, defined as tR ± 3 standard deviation (SD), using spiked samples (50 μg/kg, n = 5). Then, the measurement of the accurate mass and the estimation of the mass error were used to confirm the identity of the compound and identify it, setting mass tolerance at 5 ppm.
Most of the analytes formed the protonated molecule ([M+H+]), but some compounds form the sodium adduct [M+Na]+ (that is, diphenylamine, monensin, narasin, prosulfuron, and salinomycin) or the ammonium adduct [M+NH4]+ (acrinathrin, deltamethrin, esfenvalerate, etofenprox, famoxadone, fenpropathrin, fenvalerate, flucythrinate, isocarbofos, ivermectin B1a, oxamyl, penicillin G, penicillin V, permethrin, propargite, salinomycin, silafluofen, tefluthrin, and tetrachlorvinphos). Only 20 compounds were monitored in the negative mode, including carprofen, chloramphenicol, and dichlorprop. Furthermore, in this type of comprehensive method that uses the full-scan mode, it is important to ensure that isobaric compounds are not coeluted. Otherwise, the results will be inaccurate. This is the case of ketoprofen and fenbufen, as well as methiocarb and ethiofencarb, among others, which show identical formulas (and accurate mass) but different retention times. Therefore, it is possible to provide a suitable identification of these analytes.
Average mass accuracy also was estimated by injecting matrix-matched standards (n = 10) at 100 μg/L of the selected compounds. In general, the average mass error was <3 ppm, except for febantel, malathion, silafluofen, and tefluthrin, which presented mass errors ranging from 3 to 5 ppm. Furthermore, the RSD values associated with this parameter were always <25%.
For the automatic screening method, characteristic information already registered in the database and related to each compound, such as molecular formula, theoretical exact mass, and tR was required to build an Excel (Microsoft) spreadsheet compatible with the automatic screening software (ToxID). This Excel file was then saved as a ".csv" file to be used by the ToxID software, which generated a ".pdf" report for each sample file, showing the identified compounds from the database according to the fixed search criteria (mass tolerance = 5 ppm, retention-time window = 1 min). Then, if no signal was found within the retention-time window of the target compounds, or the accurate mass of a compound had a mass error >5 ppm, the sample was considered negative and was not reprocessed by the confirmation method. On the contrary, if a signal within the retention-time window showing a mass error < 5 ppm was found, the sample was considered as a non-negative sample and it was reprocessed to confirm the results by the confirmation method.
The confirmation of the non-negative samples was carried out using criteria such as isotopic pattern and characteristic fragments. The relative intensity of the A+1 isotope peak (A being the corresponding [M+H]+), which is mainly a result of the presence of 13C, was useful to confirm compounds with a high number of carbon atoms. When characteristic atoms such as Cl, Br, or S were present in the molecule, A+2 obtained for the isotopic profile of the accurate mass spectra and the abundance of the chlorine isotope 37Cl, bromine isotope 71Br, or sulfur isotope 34S, were used for confirmation purposes. Nevertheless, halogens are not always present in thei type of molecules (especially in veterinary drugs) because of the fact that C, H, O, and N are the main elements; the confirmation by isotopic patterns was based only on 13C/12C ratios (A+1). It is important to indicate that this information was obtained in the same injection and therefore, non-negative samples were not reanalyzed, but they were reprocessed using the data already registered. For instance, Figure 3 shows the extracted ion chromatogram and the experimental and theoretical spectra of rotenone in a matrix-matched standard (10 μg/kg). It can be observed that both spectra are similar and A+1 ion can be used for confirmation purposes.
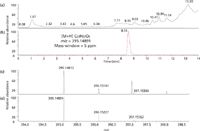
Figure 3: (a) Total ion chromatogram (TIC); (b) extracted ion chromatogram (XIC); and (c) experimental and (d) theoretical spectrum of rotenone (biopesticide) in a spiked honey sample (10 μg/kg).
Furthermore, fragment ions obtained applying HCD fragmentation could be monitored for each compound for confirmation. It is important to notice that the fragments were monitored in HRMS. These ions or fragments were generated in the collision cell (a straight multipole mounted inside a metal tube) without selection of a precursor ion, and all of the ions generated in the ion source were fragmented. In this sense, the analytes identified by the screening method could be then confirmed by the accurate masses of the two fragment ions showing the same tR and elution profile as the molecular ion, and accurate mass errors <5 ppm. In general, two fragments were included in the database for reliable confirmation. These fragments should have an m/z > 90 when possible. Additionally, preliminary fragment information obtained from triple-quadrupole MS or bibliography sources can be used to search for accurate mass fragments. Software designed for mass spectral information also can be used for this purpose. In any case, all this work is part of a laborious and time consuming task, but it is necessary for a better confirmation because one fragment can be insufficient for some compounds.
In summary, Figure 4 shows the workflow followed to identify and confirm the positive samples using the database.

Figure 4: Workflow scheme used to identify and confirm the analytes in the samples.
Advantages and Disadvantages of the Use of a Full-Scan Database
The benefits of using this method of analysis can be summarized as follows:
- A large number of compounds can be simultaneously analyzed using a generic extraction method and generic conditions of analysis.
- Only one injection is needed to provide enough information for screening and confirmation purposes.
- Several criteria such as isotopic pattern and fragments can be used for confirmation purposes.
- Retrospective analysis for the determination of nontarget compounds can be performed.
However, this methodology also has certain disadvantages, as indicated below:
- The initial investment in standards is high.
- The information is not supported in a single software platform.
- Adjustments must be performed in each matrix.
- It is difficult to maintain a high quality system because of the high number of analytes.
- A lot of time is required to validate the method because of the high number of compounds.
- The raw data files obtained are very large (often >50 MB).
Application of the Database
To demonstrate the effectiveness of the method, the method was applied to the analysis of matrices such as feed, vegetables, and honey, among others. For that purpose, approaches such as the QuEChERS (quick, easy, cheap, effective, rugged, and safe) methodology (14,15) and "dilute and shoot" methods (7) have shown their suitability for the extraction of a wide range of compounds, minimizing sample handling and increasing sample throughput. Some compounds were detected in several samples; Figure 5 shows the extracted ion chromatograms as well as the theoretical and experimental spectra of some positive results The results show ethoxyquin (m/z 218.15394) in a positive feed sample (extraction procedure applied: QuEChERS [15]); carbendazim (m/z 192.07675) in a positive pepper sample (extraction procedure applied: QuEChERS [14]); and azoxystrobin (m/z 404.12410) in a positive honey sample (extraction procedure applied: "dilute and shoot" [7]). Furthermore, several characteristic fragments for each compound were monitored and the same chromatographic profiles were observed in relation to the characteristic ion of these compounds, confirming the presence of the compounds in the analyzed samples.

Figure 5: Extracted ion chromatograms and theoretical and experimental spectra of matrix matched standards and positive samples containing (a) ethoxyquin, (b) carbendazim, and (c) azoxystrobin.
Conclusions
A database has been developed for screening more than 350 compounds by UHPLC–orbital trap MS. This database includes tR and characteristic ions of the target compounds. The proposed database allows for the automated search of the analytes, and then, the confirmation and quantification of the detected compounds can be carried out within the same injection. The full-scan mode permits the acquisition of all the ions produced in the source and thus, the number of analytes is (theoretically) unlimited in the selected m/z range. On the other hand, the HRMS instruments can improve the identification or confirmation process with the information provided by accurate mass measurements. Then, UHPLC–orbital trap MS allows efficient performance for screening purposes and also can provide adequate quantification or confirmation values of pesticides and veterinary drug residues in the positive samples. Generic instrumental and extraction conditions have been used, which facilitates the determination of a wide range of compounds. New compounds can be included and therefore, the database can be easily upgraded. On the contrary, the determination of fragments is a complex task.
Acknowledgments
We gratefully acknowledge the Spanish Ministry of Science and Innovation (SMSI)-FEDER (AGL2010-21370) for financial support. M.L.G.P. acknowledges her grant (F.P.I.) from the SMSI (Ref. AGL2010-21370). R.R.G. is also grateful for personal funding through the Ramón y Cajal Program (SMSI-European Social Fund, ESF). P.P.B. is grateful for personal funding through the Juan de la Cierva Program (SMSI-ESF).
María Luz Gómez-Pérez, Patricia Plaza-Bolaños, Roberto Romero-González, Antonia Garrido Frenich, and José Luis Martínez Vidal are with the "Analytical Chemistry of Contaminants" research group in the Department of Hydro-Geology and Analytical Chemistry at the Research Centre for Agricultural and Food Biotechnology (BITAL), at the University of Almeria, Agrifood Campus of International Excellence in Almeria, Spain. Patricia Plaza-Bolaños is also with the department of analytical chemistry at the University of Granada in Granada, Spain. with the department of analytical chemistry at the University of Granada in Granada, Spain. Please direct correspondence to: agarrido@ual.es.
References
(1) M.M. Aguilera-Luiz, P. Plaza-Bolaños, R. Romero-González, J.L. Martínez Vidal, and A. Garrido Frenich, Anal. Bioanal. Chem. 399, 2863–2875 (2011).
(2) M. Kellmann, H. Muenster, P. Zomer, and H. Mol, J. Am. Soc. Mass. Spectrom. 20, 1464–1476 (2009).
(3) A. Kaufmann, P. Butcher, K. Maden, S. Walker, and M. Widmer, Anal. Chim. Acta 700, 86–94 (2011).
(4) A. Kaufmann, P. Butcher, K. Maden, S. Walker, and M. Widmer, The Analyst 136, 1898–1909 (2011).
(5) M. Mezcua, O. Malato, J.F. García-Reyes, A. Molina-Díaz, and A.R. Fernández-Alba, Anal. Chem. 81, 913–929 (2009).
(6) M.I. Ramón Díaz, J.V. Sancho, and F. Hernández, Rapid Commun. Mass Spectrom. 25, 355–369 (2011).
(7) H.G. Mol, P. Plaza-Bolaños, P. Zomer, T.C. de Rijk, A.A.M. Stolker, and P.P.J. Mulder, Anal. Chem. 80, 9450–9459 (2008).
(8) E. van der Heeft, Y.J.C. Bolck, B. Beumer, A.W.J.M. Nijrolder, A.A.M. Stolker, and M.W.F. Nielen, J. Am. Soc. Mass. Spectrom. 20, 451–463 (2009).
(9) J.L. Martínez Vidal, M.M. Aguilera-Luiz, R. Romero-González, and A. Garrido Frenich, J. Agric. Food Chem. 57, 1760–1767 (2009).
(10) F. Hernández, J.V. Sancho, M. Ibáñez, and S. Grimalt, Trends Anal. Chem. 27, 862–872 (2008).
(11) A. Makarov, E. Denisov, A. Kholomeev, W. Balschun, O. Lange, K. Strupat, and S. Horning, Anal. Chem. 78, 2113–2120 (2006).
(12) R. Romero-González, M.M. Aguilera-Luiz, P. Plaza-Bolaños, A. Garrido Frenich, and J.L. Martínez Vidal, J. Chromatogr. A 1218, 9353–9365 (2011).
(13) A. Zhang, J.S. Chang, C. Gu, and M. Sanders, Thermo Application Note 51878.
(14) M. Anastassiades, S.J. Lehotay, D. Stajnbaher, and F.J. Schenck, J. AOAC Int. 86, 412–431 (2003).
(15) R. Romero-González, A. Garrido-Frenich, J.L. Martínez Vidal, O.D. Prestes, and S.L. Grio, J. Chromatogr. A 1218, 1477–1485 (2011).
High-Speed Laser MS for Precise, Prep-Free Environmental Particle Tracking
April 21st 2025Scientists at Oak Ridge National Laboratory have demonstrated that a fast, laser-based mass spectrometry method—LA-ICP-TOF-MS—can accurately detect and identify airborne environmental particles, including toxic metal particles like ruthenium, without the need for complex sample preparation. The work offers a breakthrough in rapid, high-resolution analysis of environmental pollutants.
The Fundamental Role of Advanced Hyphenated Techniques in Lithium-Ion Battery Research
December 4th 2024Spectroscopy spoke with Uwe Karst, a full professor at the University of Münster in the Institute of Inorganic and Analytical Chemistry, to discuss his research on hyphenated analytical techniques in battery research.
Mass Spectrometry for Forensic Analysis: An Interview with Glen Jackson
November 27th 2024As part of “The Future of Forensic Analysis” content series, Spectroscopy sat down with Glen P. Jackson of West Virginia University to talk about the historical development of mass spectrometry in forensic analysis.
Detecting Cancer Biomarkers in Canines: An Interview with Landulfo Silveira Jr.
November 5th 2024Spectroscopy sat down with Landulfo Silveira Jr. of Universidade Anhembi Morumbi-UAM and Center for Innovation, Technology and Education-CITÉ (São Paulo, Brazil) to talk about his team’s latest research using Raman spectroscopy to detect biomarkers of cancer in canine sera.