Aggregate and Fragment Analysis in Therapeutic Monoclonal Antibodies Using On-Line Size-Exclusion Chromatography with Native Mass Spectrometry
Special Issues
Size-exclusion chromatography (SEC), with the use of ammonium acetate buffer, can be coupled on-line to electrospray ionization MS for the characterization of size variants of therapeutic monoclonal antibodies (mAbs). A quadrupole time-of-flight (QTOF) MS system was employed, and the MS method was optimized to achieve favorable sensitivity for high-mass detection, while maintaining the structural integrity of the aggregates (or high molecular weight species) and fragments (or low molecular weight species).
Aggregates and fragments are common product-related impurities in biopharmaceuticals that have impact on efficacy, safety, and stability. Identification of these low-level impurities may involve labor-intensive chromatographic fraction collection and follow-up experiments. In addition, a significant part of the total protein aggregates can be caused by non-covalent molecular interactions, which are dissociable in denaturing buffers, and cannot be characterized by conventional mass spectrometry (MS). With the use of ammonium acetate buffer, size-exclusion chromatography (SEC) can be coupled on-line to electrospray ionization MS for the characterization of size variants of therapeutical monoclonal antibodies (mAbs). A quadrupole time-of-flight (QTOF) MS system was employed, and the MS method was optimized to achieve favorable sensitivity for high-mass detection, while maintaining the structural integrity of the aggregates. As a result, high quality native MS spectra could be acquired for drug substance samples containing as low as 0.4% of these species, with the molecular masses of all relevant size variants obtained using 10-min SEC–MS runs. It is expected that this method will have significant potential to be implemented in routine analysis of mAbs for the characterization of the aggregation mechanisms and degradation pathways.
Recombinant monoclonal antibodies (mAbs), as the most common modality among protein therapeutics, have achieved great success in multiple disease areas, including immunology, oncology, and blood diseases, and potentially could provide therapies for neurodegenerative diseases such as Alzheimer’s disease (1–5). MAbs are large tetrameric molecules (approximately 146 kDa) composed of two heavy chains (~50 kDa) and two light chains (~23 kDa). The four chains are connected through interchain disulfide bonds. During manufacturing and storage, mAbs can form aggregates (or high molecular weight species [HMWs]) and fragments (or low molecular weight species [LMWs])(6). MAb aggregation can be formed through various mechanisms, such as molecular interactions and chemical cross-linking (6–9). The aggregates can be potentially immunogenic, and possibly promote the formation of particulates (10). MAb fragmentation can occur through several pathways, such as hydrolysis, free radical induced fragmentation, and enzymatic cleavage (11). The fragmented mAb may have reduced biological activity and pharmacokinetic compared to the intact mAb (12). Both aggregates and fragments are usually the critical quality attributes that need to be controlled to very low levels to ensure the efficacy, safety, and stability of mAb drugs.
Characterization of aggregates and fragments is important to understand mAb degradation pathways and to establish an effective control strategy. Conventional characterization methods often include size-exclusion chromatography (SEC) with UV or multi-angle light scattering (MALS) detection, analytical ultracentrifugation, and capillary electrophoresis with sodium dodecyl sulfate (6,7,9). In-depth characterization and identification of these low-level species may involve labor-intensive fraction collection and mass spectrometric analyses. In addition, noncovalent aggregates formed by molecular interactions can be a significant portion of the total aggregates, but are dissociable, and cannot be characterized by conventional denaturing liquid chromatography–mass spectrometry (LC–MS) methods (7, 9).
Native mass spectrometry has been an emerging technique in the past two decades for the study of protein complex assemblies (13,14), protein–protein interactions (15,16), protein–ligand interactions (15), glycoform analysis in mAbs (17,18), antibody–drug conjugates (19,20), bispecific antibodies (21), and mAb aggregates (22,23). For example, it has been specifically used for characterization of antibody–drug conjugates to determine the drug to antibody ratio (24,25), the study of product-related impurities and variants in bispecific antibodies (26), and study of aggregate formation in a coformulated drug containing two mAbs (27).
There are two special features of native MS: The need to use non-denaturing MS-compatible buffer and gentle ionization conditions to preserve protein complexes; and the need to use MS with high m/z ranges, because protein complexes have higher molecular weights, and are in native states carrying fewer charges compared to conventional denaturing states. In theory, time-of-flight (TOF) instruments have unlimited mass ranges, and thus are a natural fit for native MS. Some orbital ion trap instruments also have native MS capability, due to their extended mass ranges.
Apart from direct injection experiments, native MS can be coupled on-line to separation methods with the use of native or “near native” MS-compatible buffers, such as SEC (22,23,28), cation exchange chromatography (29), and capillary zone electrophoresis (30,31).
Early work in native MS has been described using a QTOF system (32). Recently, we used a TripleTOF QTOF instruments from Sciex to establish a native MS method for mAbs, and results are described in this paper. The method couples size-exclusion chromatography on-line with native MS using a MS-compatible SEC running buffer. The applications for the direct analysis of drug substance samples of therapeutic mAbs to obtain the molecular mass information of all the relevant size variants, including monomer, aggregates (in most cases the dimers), and fragments are demonstrated.
Materials and Methods
Antibodies
MAb-1 is the NIST mAb. MAb-2, mAb-3, mAb-4, and mAb-5 are humanized mAbs expressed in Chinese hamster ovary (CHO) cells at Biogen. For native SEC-MS analyses, the mAbs were diluted to final concentrations of 10 mg/mL using their formulation buffers.
Chemicals
Ammonium acetate (mass spectrometry grade) was purchase from Sigma. Milli Q water (18.2 MΩ) was used to prepare the ammonium acetate aqueous solutions.
Online Native SEC-MS Conditions
SEC separation was performed on a Shimadzu ultrahigh-pressure liquid chromatography (UHPLC) system with a Waters BEH200 SEC column (2.1 or 4.6 mm × 150 mm, 1.7-μm) heated to 30 °C. Typically, 50 or 100 μg mAb (50 µg for the 2.1 mm column; 100 µg for the 4.6 mm column) was loaded onto the column and eluted by a 25 mM ammonium acetate solution delivered at 100–200 μL/min (100 or 125 μL/min for the 2.1 mm column; 200 μL/min for the 4.6 mm column). The eluates were monitored sequentially by a PDA detector and a QTOF mass spectrometer.
Unless otherwise mentioned, the native MS data were acquired on a Sciex TripleTOF 6600 QTOF mass spectrometer, and the instrument parameters are summarized in Table I. Data analysis was performed using PeakView 2.2 software (Sciex). Protein deconvolution was achieved using Bayesian algorithm in the Bio Tool Kit (Sciex).

Results and Discussion
Native and Denatured Mass Spectra of a Monoclonal Antibody
Shown in Figure 1 are the electrospray ionization mass spectra of mAb-1, acquired under native (Figure 1a) and denatured conditions (Figure 1b). In Figure 1b, as mAb-1 has been denatured by the organic solvent and the acidifier, more of the surface is exposed to the solvent, so that it takes on additional charges compared to the native state in a neutral aqueous solution (Figure 1a). As a result, the center charge states of the denatured and native mAb are 51 and 27, and their upper mass to charge ratio (m/z) ranges are approximately 4000 and 6000, respectively.
Figure 1: (a) Native and (b) denatured mass spectra of mAb-1 obtained on a QTOF instrument (Reprinted from a presentation slide of Sciex with permission).
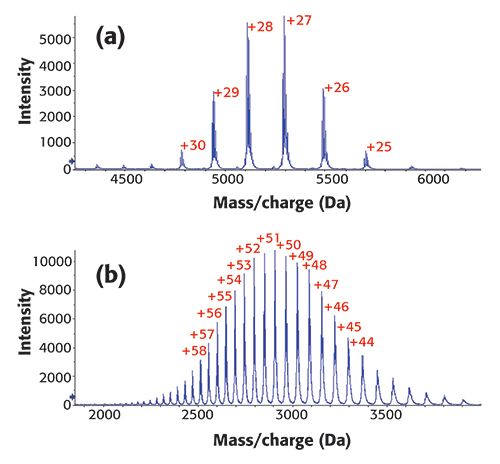
Moreover, the native mass spectrum appears to have a narrower charge state distribution, and reveals a simplified spectrum compared to the one under denaturing conditions. In the native spectrum, there are more spaces between nearby charge states, which increase the chance to detect and quantitate post-translational modifications when their signals fall in these regions. This could be a major reason that native MS has been increasingly popular for the analysis of antibody–drug conjugates (20).
Instrument Parameters for Native Mass Spectrometric Analysis of Monoclonal Antibodies
Native SEC–MS method optimization was based on the mass spectra of both the monomer and dimer peaks of mAbs after SEC separation on a 2.1 mm x 150 mm BEH200 column with 25 mM ammonium acetate buffer delivered at 0.125 mL/min. Multiple instrument parameters, including gas settings, source temperature, and declustering potential (DP) were evaluated. Right levels of source temperature and declustering potential are critical for removing solvent-related adducts and enhancing resolution and sensitivity. However, the excess levels of source temperature or declustering potential could induce denaturation and fragmentation of the analytes, which are not desirable.
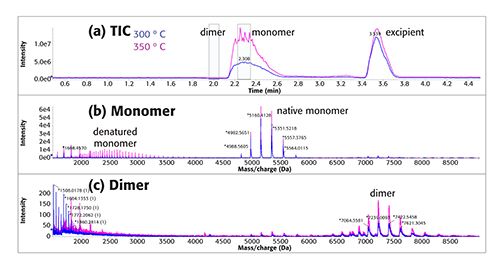
Figure 2 shows the impact of source temperature on native SEC–MS analysis of mAb-2. Figure 2a shows the total ion chromatograms (TICs) under source temperature of 300 °C (blue trace) and 350 °C (purple trace), respectively. Two major analytes, the dimer and monomer, eluted at 2.0 min and 2.3 min, and their mass spectra are shown in Figure 2b and 2c, respectively. The MS signals of denatured monomer, native monomer, and dimer are in m/z windows of 1500–4000, 4500–6000, and 6500–8000, respectively. Compared to 300 °C, the higher source temperature doubled the sensitivity of the both the dimer and the monomer; however, it also denatured a significant portion of monomer. If we focus on dimer characterization, 350 °C could be chosen, otherwise, 300 °C or a temperature in between might be better choices to minimize monomer denaturation. Source temperature of 400 °C was also evaluated (data not shown). Under this elevated temperature, the recovery of dimer was not as good as that of 350 °C, since it became unstable and a portion of it decomposed into monomer and fragments.
Figure 2: SEC-MS of mAb-2 with source temperature of 300 °C (blue trace) and 350 °C (purple trace). (a) total ion chromatogram (TIC); (b) Monomer mass spectrum; (c) Dimer mass spectrum.
SEC Separation is Critical for Native MS Analysis of MAb Dimer
In Figure 2b, there are a few low-level signals in the 6500–8500 m/z range, which align exactly to the mass spectrum of the dimer in Figure 2c. The dimer in Figure 2b was believed to be an artifact formed in-source. It can be postulated that, in direct injection experiments, the signals of artifactual in-source dimer could mask the signals of in-solution dimer. Therefore, SEC separation is beneficial in differentiating in-source dimer from in-solution dimer based on their different SEC retention times. Additionally, in direct injection experiments mAbs often need to be buffer-exchanged into mass-spectrometry compatible native buffers. During extended storage in native buffers, some mAbs may have a tendency toward concentration-dependent self-association, resulting in the formation of new aggregates that would not have been formed (or formed at much lower rates) when stored in formulation buffers. With native on-line SEC–MS, mAbs remain in their formulation buffers prior to injection, thus minimizing this risk.
Moreover, SEC provides separation and enrichment of the dimer peak, whose ionization could otherwise be suppressed by the monomer. The levels of dimer in drug substance samples are often very low, and so are their native MS signals. Overloading in SEC could be an approach used to enhance the signals of the dimer peaks. As shown in Figure 3a, 160 µg drug substance (DS) material, instead of a typical 50 µg material, was loaded on a 2.1 mm x 150 mm SEC column. Because the dimer is the first peak and a minor peak, overloading would not significantly impact its peak width and its separation from the monomer, and in theory the dimer response could be increased by approximately two- to threefold.
Figure 3: (a) TIC of native SEC-MS of mAb-3 under sample overloading conditions; (b) species detected in the monomer peak. Apart from the expected monomer signals, in-source artifacts including denatured monomer, dimer, trimer, and tetramer were observed at significantly lower levels.
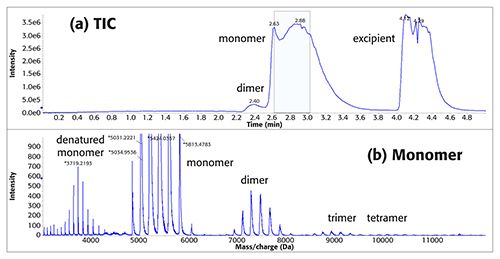
Shown in Figure 3b, however, in addition to the monomer peak, many in-source artifacts are also detected, such as the denatured monomer, dimer, trimer, and tetramer. Although these artifacts are undesirable, the detection of trimer and tetramer suggests that the TOF analyzer can cover a wide range of aggregates including but not limited to the dimer.
Sensitive Detection of MAb Dimer by Native SEC-MS
Even without sample overloading, the native SEC–MS method can achieve impressive sensitivity for the detection of mAb dimers. Shown in Figure 4, 100 µg DS sample of mAb-4 containing 0.4% dimer was analyzed by native SEC–UV-MS, with the use of a 4.6 mm x 150 mm SEC column. Figure 4a and 4b are the UV (280 nm) and TIC chromatograms of the DS sample, respectively. Figure 4c and 4d are the mass spectra of the monomer and dimer, respectively.
Figure 4: Native SEC-UV-MS of an mAb-4 drug substance sample. (a) UV chromatogram; (b) TIC chromatogram; (c) monomer mass spectrum; (d) dimer mass spectrum.
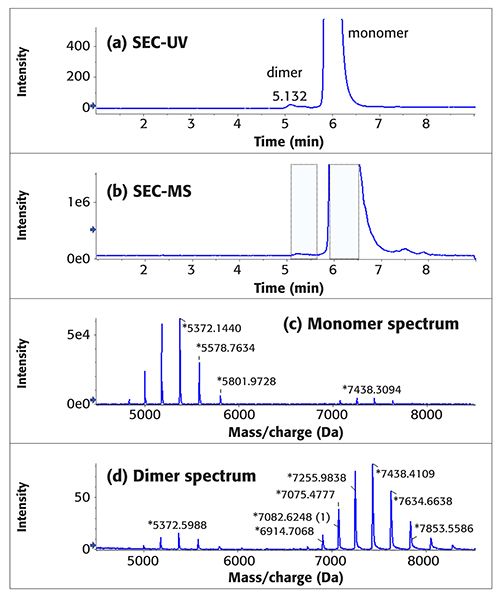
The 0.4 µg dimer on column generated a high-quality native mass spectrum with base peak intensity of approximately 80 (Figure 4d). From these data, it is likely that this SEC–MS method could be applied to a DS sample containing 0.1% dimer. The 0.1 ug (0.1%) dimer from 100 µg DS would generate a mass spectrum with base peak intensity of approximately 20, which is close to the quantitation limit (10–20 ion counts) of the mass detector.
MAb Size Variant Characterization by Native SEC-MS
Size variants, including aggregates and fragments, are product-related impurities that are critical to the quality of protein drugs. Characterization of size variants is important for the understanding of the stability profiles and degradation pathways in the mAbs.
To analyze the size variants in mAb-5, 100 µg of DS sample containing 1.6% dimer was analyzed by the native SEC–UV-MS method (Figure 5). Three major peaks were detected, including the monomer, dimer, and a low molecular weight (LWM) peak. Their raw mass spectra and deconvoluted mass spectra are shown in Figure 5c, 5e, 5g, and Figure 5d, 5f, 5h, respectively.
Figure 5: Native SEC–UV/MS of a mAb-5 drug substance sample. (a) TIC chromatogram; (b) UV chromatogram; (c), (e) and (g): raw mass spectra of the monomer, dimer and LMW peak, respectively; (d), (f) and (h): deconvoluted mass spectra of adjacent peaks (to the left in column one).
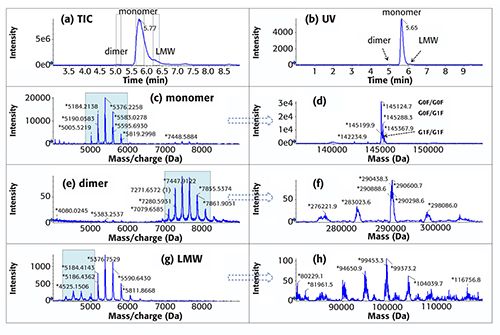
In Figure 5d, the deconvoluted native mass spectrum supports the identification of major glycoforms of mAb-5. Deconvoluted mass spectrum of the dimer is shown in Figure 5f. Deconvoluted mass spectrum of the LMW-containing mAb missing a single Fab due to commonly observed hinge cleavage is shown in Figure 5h (33). The mass accuracies are generally about 200 ppm (Table II), which are typically considered to be low but acceptable for the purpose of analysis presented here. For the dimer and LMW species, due to their low abundances and high levels of heterogeneities, the deconvoluted spectra (Figure 5f and 5h) contain a few additional harmonic peaks. It appears that the deconvolution algorithm has not been fully optimized for native spectra analysis. Nevertheless, the base peaks in the deconvoluted spectra accurately report the molecular masses of these analytes.

The assignments of the glycoforms in the monomer, as well as the identification of dimer and LMW peaks, are summarized in Table II. From this data, all the major size variants in the mAb-5 DS sample can be identified using a 10-min native SEC–MS run.
Conclusion
Native SEC–MS conditions were optimized for the analysis of mAb size variants, with the use of ammonium acetate SEC buffer and a TOF mass spectrometer. This method is fast and sensitive for direct size variant characterization of mAbs at levels as low as 0.4%. The method was successfully applied to characterize all the relevant size variants detected in various mAbs. Native SEC–MS has been demonstrated to be a useful technique for mAb aggregate characterization. It has significant potential to be routinely applied to study mAb aggregation mechanisms and degradation pathways, thus provides valuable information to guide purification and formulation process development, and supports the risk assessment of product-related impurities.
Acknowledgment
The authors thank Sean McCarthy, Fan Zhang, Esme Candish, and Elliott Jones at Sciex for the technical support of this work.
References
- M. Trikha, L. Yan, and M.T. Nakada, Curr. Opin. Biotechnol.13, 609–614 (2002).
- A.L. Nelson, E. Dhimolea, and J.M. Reichert, Nat. Rev. Drug Discov.9, 767–774 (2010).
- N.A.P.S. Buss, S.J. Henderson, M. McFarlane, J.M. Shenton, and L. de Haan, Curr. Opin. Pharmacol.12, 615–622 (2012).
- Y.J. Yu and R.J. Watts. Neurotherapeutics10, 459–472 (2013).
- J. Sevigny, P. Chiao, T. Bussière, P.H. Weinreb, L. Williams, M. Maier, R. Dunstan, S. Salloway, T. Chen, Y. Ling, J. O’Gorman, F. Qian, M. Arastu, M. Li, S. Chollate, M.S. Brennan, O. Quintero-Monzon, R.H. Scannevin, H.M. Arnold, T. Engber, K. Rhodes, J. Ferrero, Y. Hang, A. Mikulskis, J. Grimm, C. Hock, R.M. Nitsch, and A. Sandrock, Nature537, 50–56 (2016).
- A. Beck, E. Wagner-Rousset, D. Ayoub, A. Van Dorsselaer, and S. Sanglier-Cianférani, Anal. Chem. 85, 715–736 (2013).
- M. Vázquez-Rey and D.A. Lang, Biotechnol. Bioeng. 108, 1494–1508 (2011).
- C.-F. Xu, Y. Chen, L. Yi, T. Brantley, B. Stanley, Z. Sosic, and L. Zang, Anal. Chem. 89, 7915–7923 (2017).
- C.J. Roberts, Trends Biotechnol.32, 372–380 (2014).
- K.D. Ratanji, J.P. Derrick, R.J. Dearman, and I. Kimber, J. Immunotoxicol.11, 99–109 (2014).
- J. Vlasak and R. Ionescu, mAbs3, 253–263 (2011).
- A.L. Nelson and J. M. Reichert, Nat. Biotechnol. 27, 331–337 (2009).
- R.H.H. v.d. Heuvel and A.J.R. Heck, Curr. Opin. Chem. Biol. 8, 519–526 (2004).
- M. Sharon and C.V. Robinson, Annu. Rev. Biochem.76, 167–193 (2007).
- A.J.R. Heck and R.H.H. v.d. Heuvel, Mass Spectrom. Rev.23, 368–389 (2004).
- A.J.R. Heck, Nat. Methods5, 927–933 (2008).
- S. Rosati, Y. Yang, A. Barendregt, and A.J.R. Heck, Nat. Protoco.9, 967–976 (2014).
- S. Rosati, E.T.J. v.d. Bremer, J. Schuurman, P.W.H.I. Parren, JP. Kamerling, and A.J.R. Heck, mAbs5, 917–924 (2013).
- R.Y.C. Huang and G. Chen, Drug Discov. Today21, 850–855 (2016).
- A. Beck, V. D’Atri, A. Ehkirch, S. Fekete, O. Hernandez-Alba, R. Gahoual, E. Leize-Wagner, Y. François, D. Guillarme, and S. Cianférani, Expert Rev. Proteomic.16, 337–362 (2019).
- G. Terral, A. Beck, and S. Cianférani, J. Chromatogr. B 1032, 79–90 (2016).
- B. Kükrer, V. Filipe, E. van Duijn, P.T. Kasper, R.J. Vreeken, A.J.R. Heck, and W. Jiskoot, Pharm. Res.27, 2197–2204 (2010).
- M. Haberger, M. Leiss, A.-K. Heidenreich, O. Pester, G. Hafenmair, M. Hook, L. Bonnington, H. Wegele, M. Haindl, D. Reusch, and P. Bulau, mAbs 8, 331–339 (2016).
- J. Chen, S. Yin, Y. Wu, and J. Ouyang, Anal. Chem.85, 1699–1704 (2013).
- F. Debaene, A. Bœuf, E. Wagner-Rousset, O. Colas, D. Ayoub, N. Corvaïa, A. Van Dorsselaer, A. Beck, and S. Cianférani, Anal. Chem.86, 10674–10683 (2014).
- Y.-T Yan, T. Xing, S.-H. Wang, T.J. Daly, and N. Li, Anal. Chem.91, 11417–11424 (2019).
- T. Xing, Y.-T. Yan, S.-H. Wang, T J. Daly, and N. Li, “Identification and quantitation of heterodimer species in co-formulated protein drugs by lc-ms-based approaches” 67TH ASMS Conference on Mass Spectrometry and Allied Topics; June 6th; Atlanta, Georgia 2019.
- K. Muneeruddin, J.J. Thomas, P.A. Salinas, and I.A. Kaltashov, Anal. Chem. 86, 10692–10699 (2014).
- Y. Leblanc, V. Faid, M.A. Lauber, Q. Wang, N. Bihoreau, and G. Chevreux, J. Chromatogr. B 1133, 121814 (2019).
- A.M. Belov, R. Viner, M.R. Santos, D.M. Horn, M. Bern, B.L. Karger, and A.R Ivanov, J. Am. Soc. Mass Spectrom. 28, 2614–2634 (2017).
- E.A. Redman, J.S. Mellors, J.A. Starkey, and J.M. Ramsey, Anal. Chem. 88, 2220–2226 (2016).
- N.J. Thompson, S. Rosati, and A.J.R. Heck, Methods65, 11–17 (2014).
- C-F. Xu, L. Zang, and A. Weiskopf, J. Chromatogr. B960, 230–238 (2014).
Chong-Feng Xu, Jing Xu,Zoran Sosic, and Bernice Yeung are with the Department of Analytical Development at Biogen, in Cambridge, Massachussetts. Direct correspondence to chongfeng.xu@biogen.com
High-Speed Laser MS for Precise, Prep-Free Environmental Particle Tracking
April 21st 2025Scientists at Oak Ridge National Laboratory have demonstrated that a fast, laser-based mass spectrometry method—LA-ICP-TOF-MS—can accurately detect and identify airborne environmental particles, including toxic metal particles like ruthenium, without the need for complex sample preparation. The work offers a breakthrough in rapid, high-resolution analysis of environmental pollutants.
The Fundamental Role of Advanced Hyphenated Techniques in Lithium-Ion Battery Research
December 4th 2024Spectroscopy spoke with Uwe Karst, a full professor at the University of Münster in the Institute of Inorganic and Analytical Chemistry, to discuss his research on hyphenated analytical techniques in battery research.
Mass Spectrometry for Forensic Analysis: An Interview with Glen Jackson
November 27th 2024As part of “The Future of Forensic Analysis” content series, Spectroscopy sat down with Glen P. Jackson of West Virginia University to talk about the historical development of mass spectrometry in forensic analysis.
Detecting Cancer Biomarkers in Canines: An Interview with Landulfo Silveira Jr.
November 5th 2024Spectroscopy sat down with Landulfo Silveira Jr. of Universidade Anhembi Morumbi-UAM and Center for Innovation, Technology and Education-CITÉ (São Paulo, Brazil) to talk about his team’s latest research using Raman spectroscopy to detect biomarkers of cancer in canine sera.