Nontargeted Screening as an Essential Tool for Drinking Water Quality Monitoring
Special Issues
Liquid chromatography coupled with high-resolution mass spectrometry (LC–HRMS) is used in combination with a comprehensive data analysis workflow to screen water samples for potentially hazardous transformation products from organic micropollutants to determine the efficacy of different water treatment methods.
The treatment of water for human use and consumption can lead to the generation of potentially hazardous transformation products (TPs) from organic micropollutants (OMPs), a group of synthetic chemicals present in water sources at very low concentrations. Despite the potential toxicity of TPs, they are not measured routinely, due to the analytical challenges associated with their identification. One of the major challenges is confidently identifying OMPs and their TPs given the plethora of possible compounds known to exist. With advances in analytical methodology, a combination of targeted and nontargeted screening can be applied to identify the “known,” “known unknown,” and “unknown unknown” contaminants present within a sample. In this article, we present a study performed using liquid chromatography coupled with high-resolution mass spectrometry (LC–HRMS), in combination with a comprehensive data analysis workflow, to screen water samples for TPs to determine the efficacy of different water treatment methods.
Organic micropollutants (OMPs) are synthetic chemicals found in water sources and treated water at microgram-per-liter concentrations, or below (1). These persistent contaminants may be hazardous in themselves, and can also give rise to a wide variety of transformation products (TPs) (2,3,4). Potentially hazardous TPs may be formed from OMPs during drinking water treatment, but are not routinely measured, because of the lack of standards and significant analytical challenges involved in their identification. Ascertaining what TPs are removed or created during drinking water treatment is important for public health, as is determining their identity and toxicity. Advanced analytical methods based on liquid chromatography coupled with high- resolution mass spectrometry (LC–HRMS) are now being applied to aid in monitoring drinking water treatment steps, and to support a better understanding of these compounds.
A major issue in measuring OMPs and their TPs is the large number of possible compounds that can exist. OMPs and TPs can be considered as “knowns,” “known unknowns,” or “unknown unknowns.” “Knowns” are, for example, those regulated priority pollutants that are actively screened for and which can be detected through liquid chromatography–mass spectrometry (LC–MS) based target analyses (5). However, target analyses do not seek to identify new or emerging contaminants; they solely focus on looking for what is known. For the “known unknowns,” a suspect screening approach enables the detection of already described compounds that are present in chemical databases (6,7). Finally, screening for TPs means dealing with many millions of potential compounds, and for these “unknown unknowns,” a reliable nontargeted screening (NTS) approach is essential. LC–HRMS is highly relevant here, enabling NTS that is fundamental to broader detection and accurate identification of TPs (8).
NTS identifies all measurable features (accurate mass-retention time pairs) within water samples (8). Features can be clustered based on feature intensity trend profiles from treatment processes, and can then be further categorized by risk. This approach facilitates the investigation of the identified clusters and their respective responses to relevant bioassays, making it possible to relate the chemistry to biological processes and fully assess the risks these compounds pose.
This study used LC–HRMS in combination with a novel data analysis workflow to screen water samples for OMPs and their TPs to examine the effectiveness of different water treatment methods, using bioassays to relate toxic effects to the detected compounds.
Overall Analytical Approach
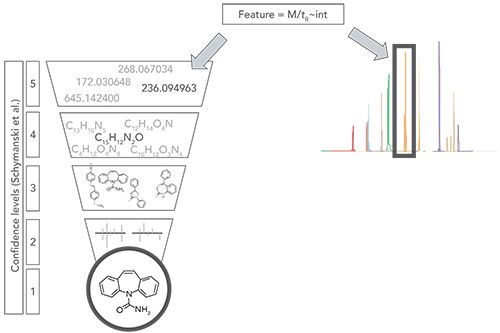
The focus of this study was to detect and identify OMPs and their TPs at different stages of the water treatment processes using NTS. Figure 1 illustrates the overall NTS identification approach used, which involved moving from a confidence level of 5, representing all the features identified in a sample (based on mass, retention time, and intensity), to a confidence level of 1, where the unique structure of an individual TP is determined, and its identity confirmed (9). The process includes looking at molecular formula and structure, based on multiple different possible structures, the examination of spectral similarity, and final confirmation with a reference standard. Because NTS generates large numbers of features, prioritization criteria were applied to reduce the number requiring identification.
Figure 1: Non-targeted screening (NTS) identification approach.
Methodology
Spiking and Sampling
Three different drinking water treatment pilot installations were studied, each of which employed a different treatment protocol (Table I). To assess the effectiveness of each water treatment approach, 48 different OMPs, selected based on their presence in surface water, toxicity, available knowledge of treatment options, chemical properties, detectability, and availability, were spiked into the source water of each installation.
Pre- and post-treatment samples (with sampling after each treatment stage for installations 1 and 2) were analyzed using LC–HRMS. Targeted analysis and NTS workflows were applied to determine OMP removal rates, the presence of parent compounds, and formation of TPs.
Following preparation in flasks pre-rinsed with acetone and petroleum ether, and containing internal standards, each sample was filtered and split into three separate vials. From each vial, 100 µL of the sample was injected per LC–HRMS analysis. A range of predefined bioassays were used to examine compound toxicity, to help prioritize the identification of unknowns.
LC–HRMS Conditions
Chromatographic separations were performed on a Thermo Scientific Vanquish ultrahigh-pressure liquid chromatography (UHPLC) system, using an XBridge BEH C18 XP reversed-phase column (Waters Corporation) operating at 25 °C with an acetonitrile gradient.
Mass spectrometric data were collected on a Thermo Scientific Orbitrap Fusion Tribrid mass spectrometer, with a heated electrospray ionization source, using 120,000 FWHM resolution in full scan acquisition over the range of 50–1000 m/z. This was followed by data-dependent tandem mass spectrometry acquisition (DDA), selecting the top eight most intense peaks for fragmentation using stepped higher-energy collisional dissociation (HCD) energies of 20, 35, 50, and 15,000 FWHM resolution. Samples were measured in triplicate, with blank samples run every 5–10 samples to check for any carryover or contamination, as well as system performance through checking internal standards (IS).
Data Analysis
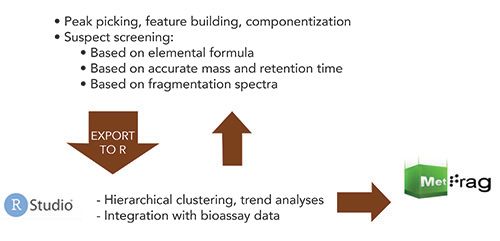
A mix of commercial software, open-source packages, and R-scripts were used for data analysis. The NTS data analysis workflow utilized Thermo Scientific Compound Discoverer software for peak picking, feature building, componentization, and identification of “knowns,” “known unknowns,” and elucidation of “unknown unknowns.” Suspect screening was based on elemental formula, accurate mass and retention time, and fragmentation spectra via tandem mass spectrometry (MS/MS) data searching, using the Thermo Scientific mzCloud mass spectral fragment library and Thermo Scientific mzLogic data analysis algorithm to rank suspect candidates when there were no library matches. Data were then exported to the “R” programming language for hierarchical clustering, trend analyses, and integration with bioassay data (Figure 2).
Figure 2: Non-targeted screening (NTS) data analysis workflow.
Results and Discussion
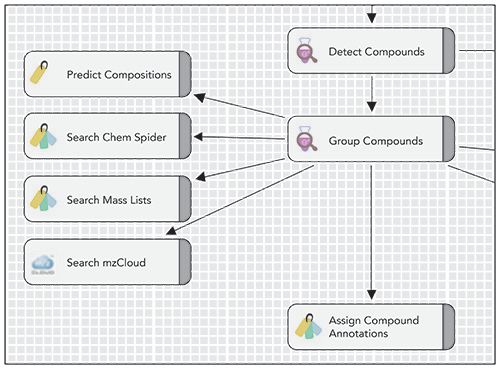
LC–HRMS was used to assess different water treatments for their effects on TP formation and degradation. Data analysis enabled compound detection followed by suspect screening using a variety of approaches (Figure 3). These approaches included taking predicted compositions and searching molecular formulas in compound databases, and screening acquired spectra against spectral libraries of environmentally relevant compounds. Suspect screening was also conducted based on accurate mass, using the NORMAN SusDat database (10) of around 40,000 environmentally relevant compounds with their structures, which were imported into Compound Discoverer, as well as tailored lists of experimentally detected and predicted TP suspects.
Figure 3: Software-enabled suspect screening using a variety of approaches.
For compounds that do not exist in any databases, the “unknown unknowns,” there is a need to predict TPs, for which a range of tools were used based on rules for biotic and abiotic transformation processes (11,12) and metabolic logic (13). Fragmentation spectra were assessed against the experimental spectra in mzCloud with the application of mzLogic to rank order the suspect candidates retrieved from the multiple data sources used facilitating identification of compounds not in a spectral library.
Figure 4 shows the results of assessing influent and effluent samples for feature count and suspect versus parent (spiked in compounds) matches. Notably, advanced oxidation treatment resulted in 144 features in the final effluent, 28 of which were suspect matches and 12 were parent matches. Ultrafiltration, in combination with reverse osmosis, resulted in 37 features, of which 11 were suspect matches and 9 were parent matches. The overall high number of features across all three treatments meant that some form of prioritization would be required. Data also showed that degradation of the parent compounds and TP formation were water-source specific, that ultrafiltration reverse osmosis (UFRO) removed most compounds, and in cluster analysis, UFRO samples aligned with the experimental blanks (Figure 5).
Figure 4: The results of assessing influent and effluent samples for feature count and suspect vs. parent.
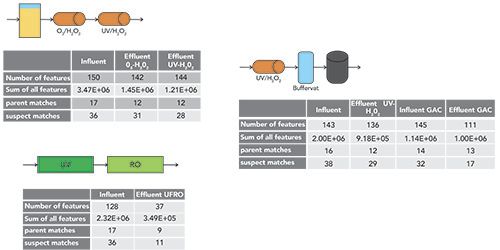
Figure 5: Degradation of the parent compounds and TP formation were water-source
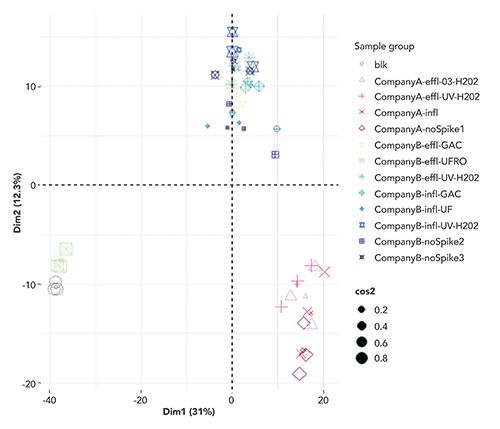
Ahead of any prioritization, these data were processed with mzCloud, which allowed immediate identification of some OMPs, but many more were not present in the database. The first step in prioritizing the identification of the remaining features was to apply hierarchical clustering analysis to the data from all the samples. This enabled the detection of feature intensity trend profiles. Compounds clustered depending on whether they were removed or formed by a particular water treatment step.
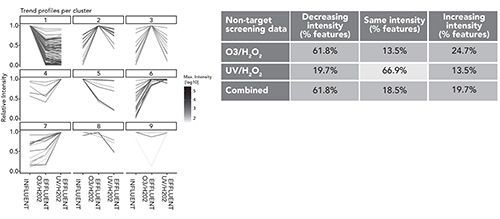
The profiles for the advanced oxidation treatment steps O3/H2O2, followed by UV/H2O2, are visualized in Figure 6. These show the influent for the process and effluent after O3/H2O2, and again after UV/H2O2. Nine clusters emerged where the features either increased or decreased. Clusters 2, 4, 6, 7, and 9 showed an increase in features indicating these should be identified as a priority. An alternative approach to assessing the effectiveness of treatment is to look at the overall increase, reduction, or no change in features. The combined value in this treatment indicates that about 20% of features increase, and although this means identifying a fifth of features, it also represents a fivefold reduction in features through the treatment process.
Figure 6: Trend profiles for the advanced oxidation treatment steps O3/H2O2 followed by UV/H2O2 (15).
Further prioritization can be achieved by including effect-based data. Here, NTS data were integrated with the results of bioassays, in this case, the standard Ames test for mutagenicity and a range of chemical activated luciferase expression (CALUX) bioassays to identify toxic endpoints for substances, such as hormone disruption and anti-estrogenic receptors (14).
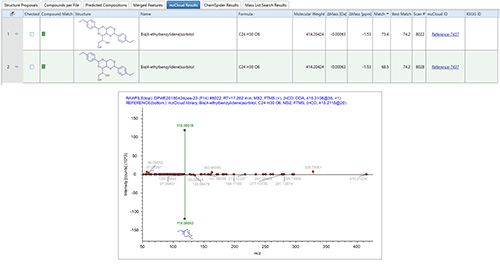
Integration of the data highlighted the presence of compounds that have potentially harmful effects, with correlation between the bioassay results and clusters 4, 7, and 9. The features occurring in clusters 4, 7, and 9 were therefore revisited in Compound Discoverer to try to identify them, with the associated data including peak shape, MS1 spectrum, isotopic pattern, and whether it provided a hit on the mass list (NORMAN SusDat). Suspect TP candidates were then ranked and identified based on spectral similarity. For one such TP with a molecular formula of C24H30O6, the search results returned two possible compounds with differing mzLogic scores of 67 and 21 (Figure 7), providing insights as to the potential structural characteristics and putative structure for this unknown. Figure 8 indicates the acquired sample spectrum compared with the library spectrum for bis(4-ethybenzylidene)sorbitol, demonstrating that NTS can facilitate the confident identification of TPs, something that would not have been possible through other established means.
Figure 7: For one potentially hazardous TP the mass list gave two different compounds.
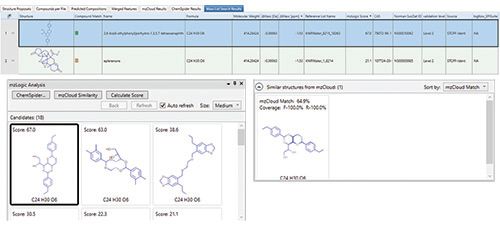
Figure 8: The TP spectrum compared with the library spectrum for bis(4-ethybenzylidene) sorbitol.
Conclusion
Increasing chemical use, and the discharge of industrial and personal waste into watercourses, are responsible for the growing presence of OMPs and their TPs in drinking water sources. This increase is driving the need to detect and remove these hazardous contaminants from water to ensure it is safe for human consumption. The large number of potential compounds, along with their extensive chemical diversity, poses significant challenges, and means targeted chemical analysis alone is no longer sufficient to determine drinking water quality and assessing the effects of treatment processes.
The data from this study demonstrate the utility of NTS in enabling a more complete analysis of samples, ensuring higher standards of water quality. Incorporating powerful NTS methods, using high-resolution accurate mass spectrometry into water quality assessment workflows, supports the development of an optimized, risk-based water monitoring strategy. This approach identifies features that potentially pose a risk to human health or the environment, and improves the identification of “unknown unknowns,” allowing decisions to be made in relation to water treatment processes. It also provides the opportunity to monitor water treatment steps and improve drinking water monitoring for known and unknown contaminants to protect public health.
Consequently, NTS using high-resolution accurate mass spectrometry is becoming an essential tool for water quality monitoring due to the increased presence of emerging contaminants with water sources. With the ability to rapidly provide in-depth, high-quality MSn data, and comprehensively triangulate multiple data sources and cheminformatics tools to determine contaminants and identify the compounds, HRAM MS will continue to facilitate the detection of established and emerging contaminants in water sources.
Acknowledgments
The author acknowledges Dennis Vughs, Annemieke Kolkman, Thomas ter Laak, Milou Dingemans, Cheryl Bertelkamp, Bas Wols, Danny Harmsen, Wolter Siegers (KWR), Bram J.Martijn (PWN), Wim A.Oorthuizen (Dunea), Camilla di Marcantonio (Sapienza University of Rome) and the Dutch drinking water utilities Dunea, PWN, Evides and Waternet for funding.
References
- Access Science Briefing, Removing Organic Micropollutants from Wastewater. Last reviewed 2016. https://www.accessscience.com/content/removing-organic-micropollutants-from-wastewater/BR0927161 (Accessed 9 December 2019)
- A.C. Belfroid, M. van Drunen, M.A. Beek, S.M. Schrap, C.A. van Gestel, and B. van Hattum, Sci. Total Environ.222, 167–183 (1998).
- C.J. Sinclair and A.B.A. Boxall, Environ. Sci. Technol. 37, 4617–4625 (2003).
- C.M. de Jongh, P.J.F. Kooij, P. de Voogt, T.L. ter Laak, Sci. Total Environ. 427–428, 70–77 (2012).
- W. Brack, J. Hollender, M.L. de Alda, C. Müller, T. Schulze, E. Schymanski, J. Slobodnik, and M. Krauss, Environ. Sci. Eur.31, 62 (2019).
- A.D. McEachran, J.R. Sobus, and A.J. Williams, Anal. Bioanal. Chem. 409, 1729–1735 (2017).
- E.L. Schymanski, and A.J. Williams, Chemicals Environmental Science & Technology 51, 5357–5359 (2017).
- J. Hollender, E.L. Schymanski, H.P. Singer, and P.L. Ferguson, Environ. Sci. Tech. 51(20), 11505–11512 (2017) DOI: 10.1021/acs.est.7b02184.
- E.L. Schymanski, J. Jeon, R. Gulde, K. Fenner, M. Ruff, H.P. Singer, and J. Hollender, Environ. Sci. Tech. 48(4), 2097–2098 (2014).
- Network of reference laboratories, research centres and related organisations for monitoring of emerging environmental substances. NORMAN Suspect List Exchange. https://www.norman-network.com/?q=suspect-list-exchange (Accessed 9 December 2019).
- K. Fenner, J. Gao, S. Kramer, L. Ellis, and L. Wackett, Bioinformatics 24, 2079–2085 (2008).
- L. Blum, L.C. Schmid, E. Fenner, and K. von Gunten, Environ Sci Process Impacts19, 465–476 (2017).
- J. Schollee, Linking Influent and Effluent Peaks from Biological Wastewater Treatment to Detect Relevant Nontarget Compounds, SETAC Europe, Barcelona, Spain (2015), p. 2.
- M.B. Heringa, D.J.H. Harmsen, E.F. Beerendonk, A.A. Reus, C.A.M. Krul, D.H. Metz, and G.F. Ijpelaar, Water Research45, 366–374 (2011).
- A.M. Brunner, C. Bertelkamp, M.M.L. Dingemans, A. Kolkman, B. Wols, D. Harmsen, W. Siegers, B.J. Martijn, W.A. Oorthuizen, and T.L. ter Laak, Sci. Total Environ. 705(135779), (2019), DOI: 10.1016/j.scitotenv.2019.135779.
Andrea Mizzi Brunner is the deputy team leader of the Chemical Water Quality and Health team at KWR Water Research Institute, in Nieuwegein, in the Netherlands. Direct correspondence to: andrea.brunner@kwrwater.nl

High-Speed Laser MS for Precise, Prep-Free Environmental Particle Tracking
April 21st 2025Scientists at Oak Ridge National Laboratory have demonstrated that a fast, laser-based mass spectrometry method—LA-ICP-TOF-MS—can accurately detect and identify airborne environmental particles, including toxic metal particles like ruthenium, without the need for complex sample preparation. The work offers a breakthrough in rapid, high-resolution analysis of environmental pollutants.
The Fundamental Role of Advanced Hyphenated Techniques in Lithium-Ion Battery Research
December 4th 2024Spectroscopy spoke with Uwe Karst, a full professor at the University of Münster in the Institute of Inorganic and Analytical Chemistry, to discuss his research on hyphenated analytical techniques in battery research.
Mass Spectrometry for Forensic Analysis: An Interview with Glen Jackson
November 27th 2024As part of “The Future of Forensic Analysis” content series, Spectroscopy sat down with Glen P. Jackson of West Virginia University to talk about the historical development of mass spectrometry in forensic analysis.
Detecting Cancer Biomarkers in Canines: An Interview with Landulfo Silveira Jr.
November 5th 2024Spectroscopy sat down with Landulfo Silveira Jr. of Universidade Anhembi Morumbi-UAM and Center for Innovation, Technology and Education-CITÉ (São Paulo, Brazil) to talk about his team’s latest research using Raman spectroscopy to detect biomarkers of cancer in canine sera.