Application of Unique Software Tools Dedicated to Multiline Analysis by CCD-Based ICP-AES for Geological Samples
Special Issues
Multiline analysis, which consists of using several lines per element to detect positive or negative bias caused by spectral interferences, is an ideal way to use all the information emitted by the plasma and collected by a charge-coupled device detector. However, method development and validation become more complex. Dedicated software has been developed to overcome it, and analysis of geological samples will illustrate their benefit in achieving high reliability of results.
The classical way to determine an element in inductively coupled plasma–atomic emission spectroscopy (ICP-AES) is to select a single line with an adequate sensitivity that is free from spectral interferences. When the nature and the concentration of the matrix elements are more or less constant, there is no risk of unexpected spectral interferences, and the selection of a single line per element is appropriate. In marked contrast, when the matrix exhibits changes, the risk of observing unexpected spectral interferences becomes significant, and the concentration deduced from the use of a single line can be wrong. When the analyte peak is affected, a positive bias will be generated, whereas the bias can be negative when the matrix influences the background correction.
With the use of multichannel detection such as charge-coupled-device (CCD) detectors, the amount of spectral information has increased significantly, and it is possible to acquire the full UV–vis spectra for each element and to use multiple lines per element. Multiline analysis makes the detection of outliers possible, thereby coping with unexpected spectral interferences and consequently improving the reliability of the results.
Multiline analysis was one of the major specifications of an ICP-AES instrument, and dedicated software was developed for optimum use. The description of the instrument was detailed in a previous issue of Spectroscopy (1), as was the concept of multiline analysis with description of the software along with an example (2). The combination of the hardware, particularly the constant resolution and the large dynamic range, and of the software with dedicated tools for multiline analysis, was optimized to provide more than just an instrument. It is a system that is able to perform a total analytical process.
Multiline Software
When the multiline concept is used, method development and its validation become even more complex, particularly for line selection. MASTER (Multiline Analysis, Selection Tool for Enhanced Reliability, Horiba) software, based upon the user's input with the list of elements and their expected concentration range, will propose the appropriate lines for each element, taking into account the concentration range of all samples and possible spectral interferences. The software performs the selection thanks to algorithms based upon a proprietary ICP-based database, the S3-base (single-element spectra, spectroscopic data). The S3-base is a double-access database, including spectroscopic data (wavelength, ionization state, limit of detection, line width, dynamic), that will be used for line filtering, and single-element spectra used to display the lines proposed by MASTER, without requiring tedious solution profiling by the user. Final line selection is validated by the user.
In a final step, when the analysis of the series of samples is realized using the validated lines, the statistical outlier survey (SOS) tool, based upon ANOVA data processing, will detect the presence of outliers, and, after their rejection, will provide a single reliable concentration per element.
The use of this multiline dedicated software will be illustrated with a geological application in which the nature of the samples can be inherently variable.
Operating Conditions
The example focuses on three rare earth elements (europium, neodymium, and scandium) because these elements are highly challenging in terms of appropriate line selection resulting from the richness of their spectra.
To compensate for the variability of the nature of the samples, various certified reference materials (CRMs) for software selection and for the calibration procedure were selected: AC-E granite, AN-G anorthosite, DR-N diorite, and GS-N granite, all geostandards being from CRPG (Centre de Recherche Pétrographiques et Géochimiques) (France). The basalt BE-N geostandard was selected as the sample.
The sample preparation was based upon an acid digestion classically used for rare earth elements in nonrefractory samples: 0.5 g of sample, dissolved slowly with 15 mL of hydrofluoric acid combined with 4 mL of perchloric acid (Pure Grade, VWR, West Chester, Pennsylvania) using a hot plate, evaporated to dryness, completed with 4 mL of hydrochloric acid (Pure Grade, VWR) and warmed, and finally completed with deionized water to 250 mL.
Method Development
The concentration range was defined according to the four CRM samples used for calibration (AC-E, AN-G, DR-N, and GS-N samples), as listed in Table I. The software then operated line selection according to sensitivity and interference criteria.
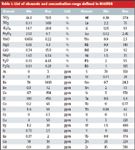
Table I: List of elements and concentration range defined in MASTER
To perform optimum multiline analysis, a minimum of three lines per element and five replicate measurements are required. Following the software filtering, the display procedure allows us to validate or reject the proposed lines. Finally, the useful lines for the determination of Eu, Nd, and Sc are summarized in Table II.

Table II: Lines (in nm) selected for multiline analysis of Eu, Nd, and Sc.
Figures 1, 2, and 3 illustrate the benefit of the display, thanks to the single-element spectra stored in the S3-base. The analyte and the influence of all the concomitant elements can be seen when present at their maximum level. Figure 1 shows the Eu 372.494-nm line, which has been validated. In the samples, if Nd or Ti do not exceed the maximum concentration that was defined in the software, this line will provide correct results. If not, the SOS tool should detect a positive bias and would reject this Eu line value. Figures 1 and 2 also show how useful and efficient the display is for the selection of the ideal positions for background corrections.
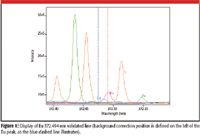
Figure 1: Display of Eu 372.494-nm validated line (background correction position is defined on the left of the Eu peak, as the blue dashed line illustrates).
At any time, the analyst can visualize all lines available in the S3-base for each element, making it possible to understand why some lines have been rejected by the software. Figure 3 is an example of a line that has not been selected because of a severe interference from titanium, although its sensitivity was adequate.
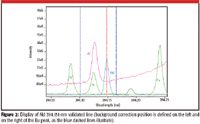
Figure 2: Display of Nd 394.151-nm validated line (background correction position is defined on the left and on the right of the Eu peak, as the blue dashed lines illustrate).
Analytical Results
Once the calibration is performed and validated, a series of samples can be analyzed using five replicate measurements, and results will be processed automatically through the SOS function to detect whether biases are present. This data processing is illustrated here with another certified sample, the BE-N basalt used as an unknown sample. A 95% level of confidence was applied in SOS.
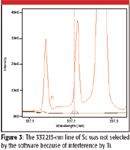
Figure 3: The 337.215-nm line of Sc was not selected by the software because of interference by Ti.
For some elements, the concentration range of this basalt sample might be different from that specified in the software. For example, Ti oxide, with a certified concentration of 2.61%, exceeds the maximum concentration defined in the software (1.09%). The sample results in Table III demonstrate that the Eu 372-nm line value was actually an outlier (positive bias), as anticipated previously in Figure 2 with the Ti influence. It was similar for the Sc 353.373-nm line, as confirmed by a postvisualization in the software with a Ti interference when its highest concentration was set up at 3%. Actually, other lines of Sc have been rejected because the statistics detected too high a variation in the replicates for the 357.634-nm line, and too high a dispersion from the mean for the others. No outlier was found for Nd, and the multiline result obtained was excellent, with a recovery of 100.2%.
The final element concentration value is the mean of the remaining concentration values after outlier rejection, and the corresponding standard deviation is corrected with the Student's coefficient. Results obtained for Eu, Nd, and Sc were of high reliability, as proved by the recovery values (Table III).
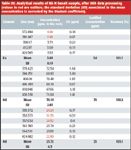
Table III: Analytical results of BE-N basalt sample, after SOS data processing (values in red are outliers; the standard deviation (SD) associated to the mean concentration is corrected by the Student coefficient).
This example based upon challenging matrices shows that the software for new application development gives the opportunity to analyze samples with an interactive display. Full benefit of the software can only be obtained in conjunction with the SOS tool, which copes with unexpected spectral interferences. As a whole, reliable results can be achieved with a minimum of user operations.
Jean-Michel Mermet is with Spectroscopy Forever, France. E-mail: jeanmichel.mermet@wanadoo.fr
Agnès Cosnier, Sébastien Vélasquez, and Sophie Lebouil are with HORIBA Jobin Yvon, and based in Longjumeau, France. E-mail: agnes.cosnier@jobinyvon.frn
References
(1) J.-M. Mermet, A. Cosnier, Y. Danthez, C. Dubuisson, E. Fretel, O. Rogérieux, and S. Vélasquez, Spectroscopy 20(2), 60–68 (2005).
(2) J.-M. Mermet, A. Cosnier, E. Fretel, S. Vélasquez, A. Grigoriev, and C. Dubuisson, Spectroscopy, Special issue, Applications of ICP and ICP-MS Techniques for Today's Spectroscopist, 34–41 (2006).
High-Speed Laser MS for Precise, Prep-Free Environmental Particle Tracking
April 21st 2025Scientists at Oak Ridge National Laboratory have demonstrated that a fast, laser-based mass spectrometry method—LA-ICP-TOF-MS—can accurately detect and identify airborne environmental particles, including toxic metal particles like ruthenium, without the need for complex sample preparation. The work offers a breakthrough in rapid, high-resolution analysis of environmental pollutants.
Trending on Spectroscopy: The Top Content of 2024
December 30th 2024In 2024, we launched multiple content series, covered major conferences, presented two awards, and continued our monthly Analytically Speaking episodes. Below, you'll find a selection of the most popular content from Spectroscopy over the past year.