Automated Flow Injection Coupled with ICP-MS for the Online Determination of Trace Silver in Seawater
Spectroscopy
Measuring silver (Ag) in seawater is challenging. A sensitive analytical procedure, using a simple automated flow injection system online coupled with ICP-MS, which is easy to be installed in an ordinary ICP-MS lab, is reported in this paper. Parameters including flow rate and duration, and the effects of the pH and dissolved organic matter (DOM) concentration and salinity were investigated. The standard addition method was used for the quantification. The linear range of the method was up to 1000 ng kg-1. For samples with various salinities the RSDs were
This article reports a sensitive analytical procedure for the analysis of silver (Ag) in seawater, using a simple automated flow injection system coupled online with inductively coupled plasma–mass spectrometry (ICP–MS). Parameters including flow rate and duration, and the effects of the pH and dissolved organic matter (DOM) concentration and salinity were investigated. The standard addition method was used for the quantification. The linear range of the method was up to 1000 ng/kg. For samples with various salinities the relative standard deviations were <3% (n = 5), and the recoveries were 98.88–101.67%. Silver concentrations of SLEW-3 and CASS-4 certified reference materials obtained in this work agreed with results in other studies. The limit of detection was 0.06 ng/kg with a sample volume of 7.5 mL, and the sample throughput was 7 h-1. This method was successfullyused for the determination of Ag in samples from the Jiulong River Estuary.
With the rapid increase in the usage of silver (Ag) products, the risks of Ag release into seawater is increasing. However, Ag is one of the most toxic elements, surpassed only by mercury (1–3). Therefore, the European Commission has entered Ag into the biocidal productive directive and the U.S. Environmental Protection Agency regards it as a preferential pollutant in natural water (4). Furthermore, Ag has served as a classical geological tracer of anthropogenic eolian contamination (5–7) and wastewater discharges (8–16), and Ag/Cu can be used as a tracer of water-mass in the ocean (6,17–19).
Compared to the soaring usage of Ag and its promising application in tracing, there is a paucity of data on Ag in seawater (20). One of the reasons is the challenge of establishing an analytical method to detect Ag at sub-nanogram-per-kilogram levels in seawater. Solvent extraction with ammonium 1-pyrrolidine dithiocarbamate–diethylammonium diethyldithiocarbamate, as detailed by Bruland and others (21), is a classic matrix removal method and can achieve a high concentration factor (>100) and an excellent limit of detection (LOD) with offline detection using graphite furnace atomic absorption spectrometry (GFAAS) (0.25–0.92 ng/kg, (9); 0.04 ng/kg, (22); 0.05 ng/kg, (23)) or inductively coupled plasma-mass spectroscopy (ICP-MS) (0.08–0.1 ng/kg, (24)). However, large volumes of samples (>100 mL) are required for solvent extraction and several procedures are involved, making it labor intensive and increasing the risk of contamination (25). Other separation techniques, including solid-phase extraction (SPE) using silica-immobilized 8-hydroxyquinoline (26), poly-group (acrylaminophosphonic-dithiocarbamate) chelating fiber (27), chitosan-based chelating resin (28), alumina modified with polyethylenimine (29), and hollow fiber liquid membrane (30), were also used for the detection of Ag in seawater. Although satisfactory LODs and easier operation are provided, time (labor) is the main drawback for large-scale application. Directly detecting Ag in seawater is not recommended since the high level of total dissolved solid will cause serious instrumental interference (25,31–34).
The availability of ICP-MS has made ultratrace analysis possible, while flow injection (FI) as the pretreatment when coupled with ICP-MS achieves fast sample throughout, low risk of contamination and sensitive response, and it has increased in use for the measurement of trace metals in seawater (35). Furthermore, FI-ICP-MS has been successfully used for Ag determination in seawater (34,36,37). In these FI-ICP-MS systems, a minicolumn packed with anion-exchange resin is used, since Ag exists in its anion form in Ag chlorocomplexes (26% [AgCl2]- and 66% [AgCl3]2-) in seawater (2).
The purpose of this study is to develop an easily constructed FI system and establish a robust FI-ICP-MS method to determine Ag in seawater, making the daily measurement of Ag in seawater a possibility in an ordinary ICP-MS laboratory. An eight-position selection valve and a six-way valve were adopted in the construction of the FI system, and its simplicity was ensured together with a control program. Various parameters affecting the determination of Ag in seawater, including pH and salinity as well as the linear range (which have not been probed in previous studies), were investigated and optimized. The method proposed was subsequently used for the determination of Ag in estuarine and sea waters.
Experimental
Reagents and Solutions
All solutions were prepared with water purified using a Milli-Q system (18.20 MΩ-cm, Millipore). Nitric acid (Merck) was sub-boiling distilled before use. A standard stock solution of silver (1000 mg/kg) was purchased from the National Institute of Metrology (China). Working standards were prepared by several dilutions of the stock solution with Milli-Q water containing proper concentrations of HNO3. Certified reference materials (CRMs) SLEW-3 and CASS-4 were provided by National Research Council Canada. Dowex 1X8 anion-exchange resin (200–400 mesh, chloric form) was supplied by Sigma Aldrich.
Apparatus
All labware used in this study was cleaned to meet trace metal analysis, as detailed in reference 38.
The FI system (Figure 1) in this study contained the following parts: two peristaltic pumps (BT–100–1L, Baoding Longer Precision Pump Co.) equipped with PharMed BPT tubing (1.02-mm i.d., Cole-Parmer); an eight-position valve (Cheminert C25Z-3I88EMH, VICI) and a six-way valve (Cheminert C22Z-3186EH, VICI); and a minicolumn assembly (MC-1CNME, Global FIA), containing a minicolumn with a tapered inner chamber (1-cm long with an 18-µL internal volume) packed with Dowex 1X8 resin slurry and the ends sealed with polyethylene frits (20-µm pore size). All connections were ¼–28 flangeless fittings for polytetrafluoroethylene tubing (0.75 mm i.d., VICI). The FI system was controlled using a LabVIEW program (National Instruments).
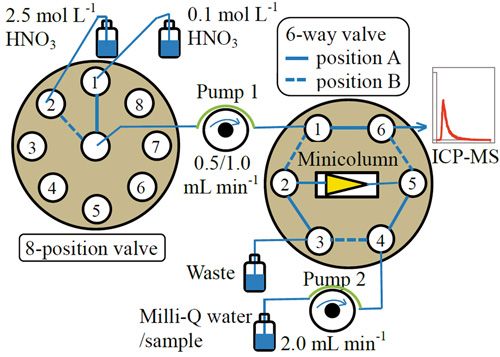
Figure 1: The schematic of the flow injection system.
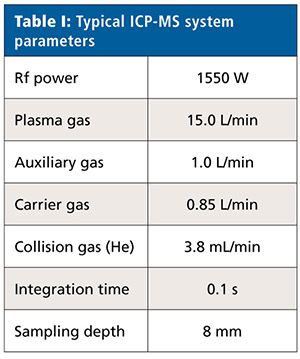
The FI system was directly connected with the nebulizer (Micromist, Glass Expansion) of the ICP-MS system (model 7700x, Agilent), which was equipped with a Scott-style quartz spray chamber. The detection mode of ICP-MS was set as time-resolved analysis. The operating parameters (for example, carrier gas flow rate, sampling depth, and helium flow rate) for 107Ag were optimized daily with a 1-µg/L tuning solution in the eluting acid. Table I shows the typical ICP-MS system parameters.
Sample Collection and Analysis
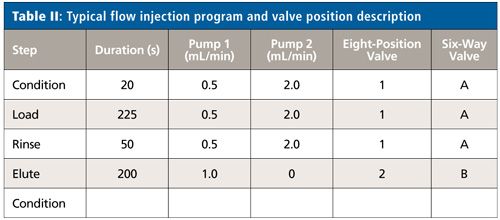
Figure 1 presents the schematic of the FI system used in this work, and the FI program is shown in Table II. There are four steps involved in a full analytical cycle of FI-ICP-MS:
- Condition: The resin is prerinsed with Milli-Q water and the ICP-MS system is on standby (with 0.1 mol/L HNO3 feeding in at 0.5 mL min-1).
- Load: Sample is passed through the minicolumn and the ICP-MS system is on standby.
- Rinse: Milli-Q water is passed through the minicolumn to wash out salts and the ICP-MS system is still on standby.
- Elute: Eluent is passed through the minicolumn in reverse direction to elute Ag into the ICP-MS system and the detection window is activated.
After acquisition, the Ag peak area is integrated using Agilent MassHunter Workstation software for quantification using standard addition calibration method.
Results and Discussion
Absorption Performance of the Anion-Exchange Resin
Before optimizing the FI-ICP-MS system, the absorption capacity of the resin for Ag and the effect of pH were investigated. For the effect of pH, the distribution coefficient Kd (39) was used and measured under different sample pH values (pH 0–9). Briefly, 50 mL of seawater of different pH with a Ag concentration of 2.5 mg/L and mixed with 0.3 g of dry anion-exchange resin were placed in bottles that were then put on an orbital shaker for 12 h to reach equilibrium. Then the mixture was filtered and the Ag concentrations of the filtrate were measured using ICP–MS. The Kd was calculated based on the following equation: Kd = mrAg × Vs/(msAg × mr), where mrAg was the amount of Ag on the resin (in micrograms); Vs was the volume of the solution (50 mL); msAg was the amount of Ag in the solution (in micrograms); and mr was the mass of the resin (0.3 g).
From the equation, the larger the value of Kd, the larger the amount of Ag was absorbed on the resin. The result showed that the Kd values were all significantly larger than 10, meaning that the Ag could be strongly absorbed on the anion-exchange resin over the whole pH range (39,40). An experiment involving determination of the capacity of the resin was conducted, and the capacity was found to be 2000 µg of Ag for 1 g of dry resin in seawater.
Effect of DOM
Studies have noted that additional Ag is released with those samples treated with ultraviolet (UV) digestion and recommend that before pretreatment using anion-exchange resin the sample should be UV oxidized to diminish the influence of DOM (16,25,37). Similar results were found in our study. More importantly, when rich DOM samples were analyzed without UV oxidation, the pressure of the minicolumn was increased dramatically and leakage was induced because many DOM samples are negatively charged and are retained by the resin. In this event, the minicolumn could not be regenerated and had to be repacked. To eliminate the effect of DOM, a test sample with Ag and dissolved organic carbon (DOC) concentration of 1 ng/kg and 115 µmol/L was UV digested and every 10 h was sampled for FI-ICP-MS and DOC (Shimadzu TOC-VCPH) analysis. The results are presented in Figure 2, and since the peak area of Ag remained around 800 after 20 h, samples in this study were UV digested for at least 20 h, while samples with DOM concentration less than 80 µmol/L can be exempted from the UV digestion. However, the detailed mechanisms for the DOM interference are still not understood (37).
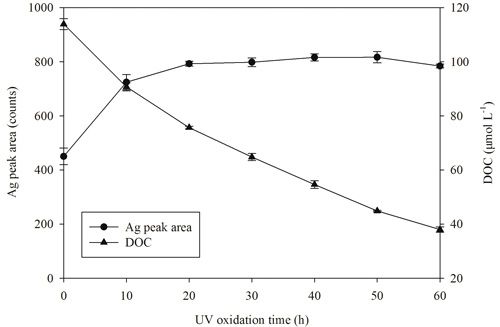
Figure 2: Effect of DOM concentration (DOC) on the absorption of Ag by Dowex 1X8 resin, the concentration of Ag and DOC was 1 ng/kg and 115 µmol/L.
Optimization of the FI System
Effect of Loading Rate and Time
The sample volume passed through the minicolumn was selected based on the sample loading rate and time. Although Ag exists at sub-nanogram-per-kilogram levels in seawater, other anions could also be retained by the anion-exchange resin. To achieve fast analyses and avoid overloading, in this study, 7 mL of seawater (with a salinity of 30 ‰ and Ag concentration of 2 ng/kg) was pumped through the minicolumn at various flow rates (1.0–3.0 mL/min) and the peak of Ag was obtained, as shown in Figure 3. A sample loading rate of 2.0 mL/min was chosen by considering the peak, analysis time, and pump-tube lifetime.
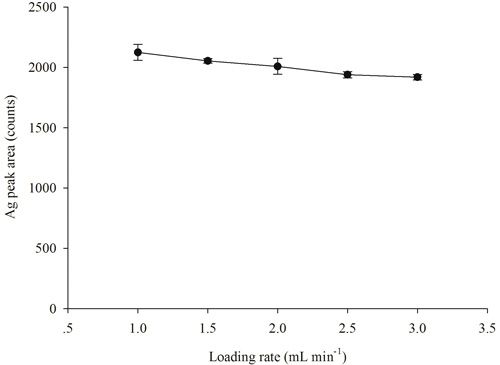
Figure 3: Effect of sample loading rate on Ag peak area. Sample salinity = 30 ‰, Ag concentration = 2 ng/kg.
Three samples with different salinities were selected to investigate the loading capacity for samples with various matrices. For the sample with a high matrix level (with a salinity of 30 ‰ and Ag concentration of 1.5 ng/kg), the linear relationship became worse (decreased from 0.9998 to 0.9843) when the loading time was extended from 5 to 6 min; for samples with a moderate matrix level (salinity of 15 ‰, Ag concentration of 2 ng/kg) and a low matrix level (salinity of 2 ‰, Ag concentration of 1 ng/kg), the loading times could be 6 and 7 min. To prevent overloading and shorten the analysis time, the loading time was set as 3.75 min (225 s) for all samples, which resulted in a sample consumption of 7.5 mL per running cycle.
Effect of Rinsing Rate and Time
Silver (107Ag) detection using ICP-MS may be affected by polyatomic interferences, such as 91Zr16O+, 90Zr16OH+. In the analysis of seawater, these polyatomic interferences are negligible since the concentration of Zr is very low; also, use of the collision mode can help to reduce the polyatomic interferences. However, Ag detection may also be influenced by physical interference caused by salt deposition (Na+, Ca2+, Cl-, and so on) on the torch and cones of the ICP-MS system. In this study, a rinsing step was employed to overcome the interference caused by the major ions. To prevent the flow pulse in the minicolumn, the rinsing rate was chosen to be the same as the loading rate-that is, 2.0 mL/min. A test sample (salinity 33 ‰, and Ag and Na concentration 2 ng/kg and 10 g/kg, respectively) was analyzed by FI-ICP-MS and the rinsing time was set in the 30–70 s range. The Na concentration was monitored to indicate the rinse efficiency. As shown in Figure 4, the peak area of Na was reduced almost seven times when the rinsing time was increased from 30 to 50 s but was not further significantly reduced by further increases in rinsing time. The Ag peak area did not change dramatically during the whole range of rinsing time, with a relative standard deviation (RSD) of 2.43%. Therefore, 50 s was selected as the rinsing time.
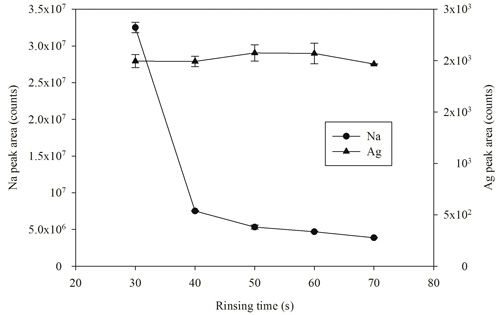
Figure 4: Effect of rinsing time on Ag and Na peak area. Sample salinity was 33 ‰, and Ag and Na concentrations were 2 ng/kg and 10 g/kg, respectively.
Effect of Elution Rate and Time
A sample with salinity of 33 ‰ and Ag concentration of 5 ng/kg was analyzed to optimize the elution conditions. Nitric acid with concentrations ranging from 1.0 to 3.0 mol/L was prepared to elute retained Ag at flow rates ranging from 0.6 to 1.0 mL/min, and the optimal condition was determined by the peak shape and retention time of the Ag. As shown in Figure 5, when the concentration of HNO3 increased, the peak height increased while the peak width narrowed, and the retention time decreased. Therefore 2.5 mol/L HNO3 was selected as the eluent, and more-concentrated HNO3 was not used because of safety concerns about the ICP-MS system. As for elution rate, Ag could not be eluted completely within 200 s at an elution rate of 0.6 mL/min and, compared to 0.8 mL/min, an elution rate of 1.0 mL/min could achieve a better peak shape and a shorter retention time (Figure 6). Since a larger elution rate could damage the ICP-MS system, 1.0 mL/min was chosen for the elution rate and 200 s for the elution time.
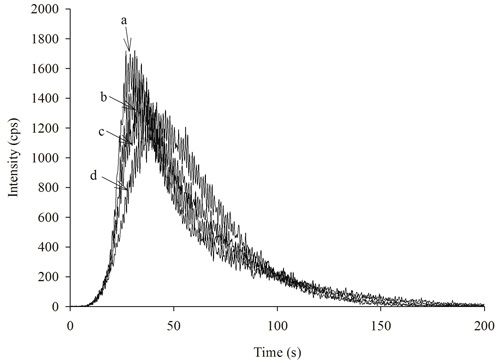
Figure 5: Elution profiles for Ag eluted with different HNO3 concentrations: (a) 2.5 mol/L, (b) 2.0 mol/L, (c) 1.5 mol/L, and (d) 1.0 mol/L. Sample salinity = 33 ‰, Ag concentration = 5.0 ng/kg.
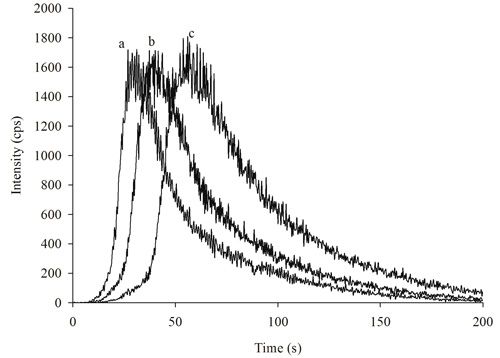
Figure 6: Elution profiles for the Ag eluted with different elution rates: (a) 1.0 mL/min, (b) 0.8 mL/min, and (c) 0.6 mL/min. Sample salinity = 33 ‰, Ag concentration = 5.0 ng/kg.
Effect of Salinity
To obtain matrix matching, the standard addition method was used for the quantification of Ag (13,25). Briefly, Ag working standards were added to separate aliquots of a sample, and then the sample plus three standards containing samples were analyzed and the Ag concentration of the sample was obtained from extrapolation of the standard addition calibration curve. Three samples with differing salinities (2, 15, and 30 ‰) were used to investigate the effect of salinity. The results showed that the slope (1064, 897.9, and 735.8 for salinity of 2, 15, and 30 ‰, respectively) of three curves varied greatly, demonstrating that for analyzing estuarine samples with differing salinities, each sample should be analyzed through extrapolation, whereas for samples with similar salinity, the Ag concentration can be acquired through interpolation from one standard addition calibration curve.
Analytical Figures of Merit
Using the optimized conditions given in Tables I and II, 8.25 min and 7.5 mL of sample were required for a running cycle, allowing a sample throughput of seven samples per hour. A standard addition curve for a seawater sample (salinity of 33 ‰, Ag concentration of 2 ng/kg) was obtained by adding Ag concentrations ranging between 0 and 1000 ng/kg to investigate the linear range of the method. The three equations were regressed within 0–600 ng/kg (R2 = 0.9996), 0–800 ng/kg (R2 = 0.9996), and 0–1000 ng/kg (R2 = 0.9983), and the average slope of the three curves was 1179.12 ± 21.4 (RSD = 1.8%). The the Ag concentration of the sample was calculated to be 2.08 ± 0.04 ng/kg (RSD = 1.8%), showing that the linearity did not change significantly. The slopes of the three curves were also tested for significant difference using covariance analysis (SPSS, IBM SPSS Statistics), and a σ score of 0.354>0.05 was obtained, indicating that there were not statistical differences among the three curves. Therefore the proposed analytical system was capable of accurate measurements for seawater samples with Ag concentrations below 1000 ng/kg, which is suitable for almost all seawater analysis.
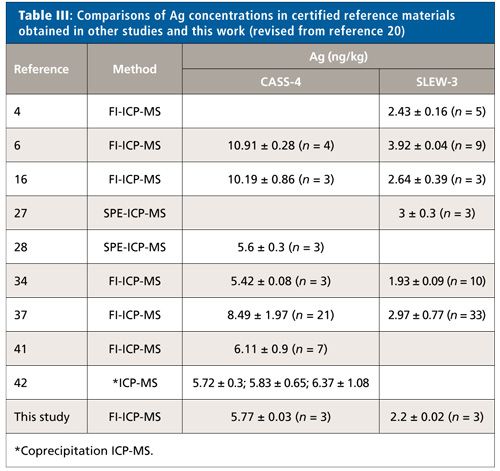
Three samples with different salinities (2.4, 15.3, and 33.5 ‰) were spiked with working standards and analyzed five times to calculate the RSD and recovery, and to evaluate the precision and accuracy of this FI-ICP-MS system. The results showed that all RSDs were <3% and the recoveries were in the range of 98.88–101.67%. The results of SLEW-3 and CASS-4 certified reference materials measured in this study as well as other work are presented in Table III. Although there are no certified Ag concentrations in SLEW-3 and CASS-4, the Ag concentrations obtained in our study were in the range of those in other work. The Ag concentrations in SLEW-3 was determined on a different day and gave a RSD < 2.74% (4 d), showing good reproducibility.
The procedure blank was prepared by acidifying Milli-Q water to a pH value of <2 with HNO3. The blanks (<0.03 ng/kg) were all below the LOD. The LOD of this FI-ICP-MS approach for Ag in seawater was 0.06 ng/kg, as calculated from the following equation (43): LOD = 3 × SE/S, where SE and S were the standard error and slope of the standard addition calibration curve fit. The LOD was sufficiently low to determine Ag in most seawater.
Comparison with Other FI-ICP-MS Methods
As can be seen from Table IV, compared with other FI methods, the FI method in this work had both low load and elution rate and comparable LOD. The lower pump rate should ensure longer time reproducibility, lengthen the life of the pump tubing and cause less damage to the ICP-MS system. The minicolumn internal volume in our work was the smallest (18 µL), and only 0.01 g of anion-exchange resin was packed, resulting in only a 7.5-mL sample being required.

Application
The method established in this study has successfully been used for the determination of Ag in samples collected from the Jiulong River Estuary (Fujian, China). As shown in Figure 7, the distribution of Ag showed a non-conservative behavior in the Jiulong River Estuary and the variation of Ag concentrations with salinity was similar to the variation of total solid materials (TSM), indicating that the absorption and de-absorption of Ag by the TSM were influenced by the salinity. However, the geochemistry of Ag in the Jiulong River Estuary remained to be further probed and will be the main focus in our future works.
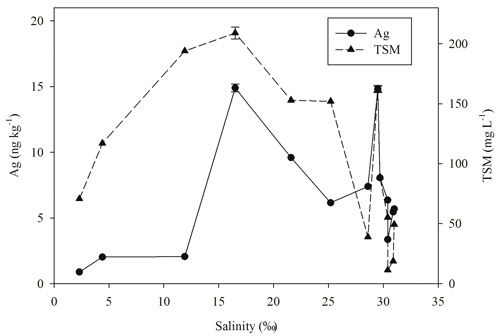
Figure 7: Ag and TSM concentrations versus salinity in the Jiulong River Estuary where water samples were collected in April 2015. The water samples were collected using a trace metal clean process. Error bars show one standard deviation away from the mean of the concentration for duplicate analysis (n=2).
Conclusions
A method of automated sample pretreatment and online detection of Ag in seawater using a new and simple FI system coupled online with ICP-MS was established. The FI-ICP-MS system in this work is applicable for the daily monitoring of Ag in seawater in a general ICP-MS laboratory. The method achieved an accurate and fast sample analysis (7 h-1), consumed a small amount of sample (7.5 mL), had a low risk of contamination, and was eco-friendly. The detection limit (0.06 ng/kg) was low for the determination of Ag in most seawater samples. This FI-ICP-MS approach has the potential to be easily improved to detect multiple elements in seawater.
Acknowledgments
This study was supported by the State Oceanic Administration of China “Special Fund for Marine Scientific Research in the Public Interest - A Nearshore of Micro/Nano Particles Biological Ecological Effect Assessment Techniques and Demonstration Application” (No. 201505034). Professor John Hodgkiss of The University of Hong Kong is thanked for his help with English.
References
- S.N. Luoma, Y.B. Ho, and G.W. Bryan, Mar. Pollut. Bull. 31, 44–54 (1995).
- J.R. Reinfelder, and S.I. Chang, Environ. Sci. Technol.33, 1860–1863 (1999).
- J. Wang and W. Wang, Environ. Toxicol. Chem.33, 632–640 (2014).
- K. Ndung’u, Environ. Res.111, 45–49 (2011).
- I. Rivera-Duarte, A.R. Flegal, S.A. Sañudo-Wilhelmy, and A.J. Veron, Deep-Sea Res. Part II 46, 979–990 (1999).
- M.A. Ranville and A.R. Flegal, Geochem. Geophys. Geosys.6, Q03M01 (2005).
- M.A. Ranville, G.A. Cutter, C.S. Buck, W.M. Landing, L.S. Cutter, J.A. Resing, and A.R. Flegal, Environ. Sci. Technol.44, 1587–1593 (2010).
- S.A. Sañudo-Wilhelmy and A.R. Flegal, Environ. Sci. Technol. 26, 2147–2151 (1992).
- G.J. Smith and A.R. Flegal, Estuaries16, 547–558 (1993).
- M.M. Shafer, J.T. Overdier, and D.E. Armstong, Environ. Toxicol. Chem.17, 630–641 (1998).
- G. Benoit and T.F. Rozan,Geochim. Cosmochim. Acta63, 113–127 (1999).
- T.F. Rozan and K.S. Hunter, Sci. Total Environ. 279, 195–205 (2001).
- A.D. Tappin, J.L. Barriada, C.B. Braungardt, E.H. Evans, M.D. Patey, and E.P. Achterberg, Water Res. 44, 4204–4216 (2010).
- L. Lanceleur, J. Schäfer, C. Bossy, A. Coynel, A. Larrose, M. Masson, and G. Blanc, Appl. Geochem. 26, 797–808 (2011).
- L. Lanceleur, J. Schäfer, J.-F. Chiffoleau, G. Blanc, D. Auger, S. Renault, M. Baudrimont, and S. Audry, Chemosphere 85, 1299–1305 (2011).
- L. Lanceleur, J. Schäfer, G. Blanc, A. Coynel, C. Bossy, M. Baudrimont, C. Glé, A. Larrose, S. Renault, and E. Strady, Environ. Sci. Pollut. Res. 20, 1352–1366 (2013).
- J.H. Martin, G.A. Knauer, and R.M. Gordon, Nature 305, 306–309 (1983).
- A.R. Flegal, S.A. Sañudo-Wilhelmy, and G.M. Scelfo, Mar. Chem. 49, 315–320 (1995).
- S.A. Sañudo-Wilhelmy, K.A. Olsen, J.M. Scelfo, T.D. Foster, and A.R. Flegal, Mar. Chem. 77, 157–170 (2002).
- C. Gallon and A.R. Flegal, in Reviews of Environmental Contamination and Toxicology, volume 235, D.M. Whitacre, Ed. (Springer International Publishing, 2015), pp. 27–48.
- K.W. Bruland, R.P. Franks, G.A. Knauer, and J.H. Martin, Anal. Chim. Acta 105, 233–245 (1979).
- I. Rivera-Duarte, and A.R. Flegal, Mar. Chem.56, 15–26 (1997).
- C.-S. Lee, C.-L. Wei, L.-S. Wen, D.-D. Sheu, and W.-H. Lee, Estuary Coast. 36, 854–865 (2013).
- D. Kramer M. Sc thesis (2006), University of Victoria.
- J.L. Barriada, A.D. Tappin, E.H. Evans, and E.P. Achterberg, TrAC-Trends Anal. Chem.26, 809–817 (2007).
- G. Benoit, S.D. Oktay-Marshall, A. Cantu, E.M. Hood, C.H. Coleman, M.O. Corapcioglu, and P.H. Santschi, Mar. Chem.45, 307–336 (1994).
- B. Wen, and X. Shan, Anal. Bioanal. Chem.374, 948–954 (2002).
- R.K. Katarina, T. Takayanagi, M. Oshima, and S. Motomizu, Anal. Chim. Acta 558, 246–253 (2006).
- M.A. Taher, Z. Daliri, and H. Fazelirad, Chinese Chem. Lett. 25, 649–654 (2014).
- J.A. López-López, J.A. Jönsson, M. García-Vargas, and C. Moreno, Anal. Methods 6, 1462–1467 (2014).
- C. Turetta, G. Cozzi, C. Barbante, G. Capodaglio, and P. Cescon, Anal. Bioanal. Chem. 380, 258–268 (2004).
- L.V. Godfrey, M.P. Field, and R.M. Sherrell, Geochem. Geophy. Geosy.9. doi:10.1029/2008GC002123 (2008).
- L.K. Shpigun, N.E. Kopytova, P.M. Kamilova, E.I. Troyanskii, and V.V. Samoshin, J. Anal. Chem. 52, 884–890 (1997).
- L. Yang and R.E. Sturgeon, J. Anal. At. Spectrom.17, 88–93 (2002).
- D. Das, M. Dutta, M.L. Cervera, and M.D.L Guardia, TrAC-Trends Anal. Chem. 33, 35–45 (2012).
- J.L. Barriada, J.B. Truscott, and E.P. Achterberg, J. Autom. Methods Manag. Chem.25, 93–100 (2003).
- K. Ndung’u, M.A. Ranville, R.P. Franks, and A.R. Flegal, Mar. Chem. 98, 109–120 (2006).
- L.-S. Wen, M.C. Stordal, D. Tang, G.A. Gill, and P.H. Santschi, Mar. Chem. 55, 129–152 (1996).
- H. Wang, F. Liu, C. Wu, G. Wang, Y. Xu, W. Zhang, and J. Zhou, Anal. Methods 6, 1936–1940 (2014).
- Y. Xu, H. Wang, G. Wang, C. Wu, and J. Zhou, Appl. Spectrosc.64, 543–546 (2010.).
- K. Ndung’u, M.A. Thomas, and A.R. Flegal, Deep Sea Res. Part II48, 2933–2945 (2001).
- J.L. Morford, L.H. Kalnejais, P. Helman, G. Yen, and M. Reinard, Mar. Chem. 110, 77–88 (2008).
- J.N. Miller and J.C. Miller, Statistics and Chemometrics for Analytical Chemistry, fifth ed. (Prentice Hall, Essex, 2005), pp. 115–124.
Zuhao Zhu and Airong Zheng are with the College of Ocean and Earth Sciences at Xiamen University in Xiamen, China. Direct correspondence to: arzheng@xmu.edu.cn
High-Speed Laser MS for Precise, Prep-Free Environmental Particle Tracking
April 21st 2025Scientists at Oak Ridge National Laboratory have demonstrated that a fast, laser-based mass spectrometry method—LA-ICP-TOF-MS—can accurately detect and identify airborne environmental particles, including toxic metal particles like ruthenium, without the need for complex sample preparation. The work offers a breakthrough in rapid, high-resolution analysis of environmental pollutants.
Trending on Spectroscopy: The Top Content of 2024
December 30th 2024In 2024, we launched multiple content series, covered major conferences, presented two awards, and continued our monthly Analytically Speaking episodes. Below, you'll find a selection of the most popular content from Spectroscopy over the past year.