Bias and Slope Correction
Spectroscopy
As we have previously discussed, the most time consuming and bothersome issue associated with calibration modeling and the routine use of multivariate models for quantitative analysis in spectroscopy are the constant intercept (bias) or slope adjustments. These adjustments must be routinely performed for every product and each constituent model. For transfer and maintenance of multivariate calibrations this procedure must be continuously implemented to maintain calibration prediction accuracy over time. Sample composition, reference values, within and between instrument drift, and operator differences may be the cause of variation over time. When calibration transfer is attempted using instruments of somewhat different vintage or design type the problem is amplified. In this discussion of the problem we continue to delve into the issues causing prediction error, bias and slope changes for quantitative calibrations using spectroscopy.
As we have previously discussed, the most time consuming and bothersome issue associated with calibration modeling and the routine use of multivariate models for quantitative analysis in spectroscopy is the constant intercept (bias) and slope adjustments. These adjustments must be routinely performed for every product and each constituent model. For transfer and maintenance of multivariate calibrations this procedure must be continuously implemented to maintain calibration prediction accuracy over time. Sample composition, reference values, within- and between-instrument drift, and operator differences may be the cause of variation over time. When calibration transfer is attempted using instruments of somewhat different vintage or design type the problem is amplified. In this discussion of the problem, we continue to delve into the issues causing prediction error, bias, and slope changes for quantitative calibrations using spectroscopy.
The tedious requirement of continuous bias adjustment for every product and constituent calibration is primarily due to four factors:
- reference laboratory differences,
- the drift in product chemistry and spectroscopy requiring continuous updating of calibrations,
- the drift or changes in spectral characteristics from a single spectrophotometer making measurements over time, and
- the consistent differences in spectral characteristics between spectra measured from multiple spectrophotometers.
Reference laboratory differences are due to a true bias in the reference chemistry measurement values caused by different analysts, different laboratories, or fundamental differences in analysis methods. The drift in product chemistry and spectroscopy is caused by changes in raw materials, manufacturing processes, or drifting ecotype expression in natural products. This product drift is best accommodated for by performing recalibration rather than bias changes. However, if the user has robust and well characterized calibration models with consistent and audited reference laboratory results, the primary cause of bias is brought about by within or between instrument differences in spectra and their resulting prediction results as compared to those spectra used for calibration. The key instrument factors requiring continuous biasing of prediction results are given above by the third and fourth factors in the bullet list.
The main issues associated with single-instrument changes over time are minimal and mostly result from slight mechanical, electronic, or throughput (etendue) variations within a single instrument. These differences should be small and random for a properly functioning spectrophotometer. Also, over time the spectral characteristics for instruments will slowly drift due to soiling of optical surfaces and lamp spectrum changes. The issues associated with multiple instruments involving calibration transfer from a primary instrument used for calibration to another “secondary” instrument, or set of “secondary” instruments are more problematic. The differences between instruments cause most of the bias issues common to calibration transfer, namely wavelength registration differences, photometric offset, and linewidth or spectral shape differences. The bias for each product and constituent prediction is caused by the relatively consistent differences between spectra measured from different instruments. The bias represents a zero-order correction in an attempt to accommodate for one or several consistent differences between instruments. As long as the differences between instruments are relatively consistent the bias changes will perform a very basic and functional correction for predicted values. If instrumental measurement differences within a single instrument over time or between different instruments can be mitigated, or even eliminated, the bias due to instrument differences would vanish. Under such an advanced technological approach, the tedious work and difficulties associated with bias adjustments after calibration transfer could be eliminated for each product and constituent.
In our previous column on this subject (1), we stated that instrumentation that is precisely alike in spectral shape from one instrument to another when measuring an identical sample will give precisely the same results using the same calibration equation across multiple instruments. We have demonstrated that when using near infrared spectrophotometers for predictions, even if one uses random numbers for the dependent variables (representing the reference or primary laboratory results), that different instruments will closely predict these random numbers across instruments following calibration transfer. Thus the instrument could be considered agnostic in terms of the numbers it generates using a spectral measurement when combined with multivariate calibration equations (2). This statement is important and indicates that the precise spectral shape is the key feature that determines the precise numbers reported as representative of a chemical or physical property of a sample (for example, the prediction result). It is also important to note that the data structure used to develop a calibration (that is, spectra and reference values) will determine what exactly is reported as the chemical or physical properties of a sample.
We have also pointed out in the past some of the various requirements for successful calibration transfer and the wide differences between commercial near-infrared instrumentation in terms of agreement for wavelength and photometric axes registration (3–8). And further we have reminded ourselves that spectrophotometers using Beer’s law (and even Raman spectrometers that “self determine” pathlength) measure moles per unit volume or mass per unit volume and do not measure, or rather track exactly, odd or contrived reference values simply by adding more terms to the regression calibration model (9,10). Note that irrespective of the chemometric or algorithmic approaches used to develop a calibration model, an inconsistent spectral shape with changing X (wavelength), and Y (photometric) axes registrations over time, and between instruments, will disrupt any model to the extent that bias correction must remain a requirement following calibration transfer for each product and constituent model.
Analysis of the Issues
If one looks at the simple univariate case from reference 1, one can see there is a definite relationship between standard error of prediction (SEP), bias, and slope related to common changes in wavelength registration, photometric levels, and linewidth or spectral shape variation. These are the usual changes in instrumentation between different serial numbers of the same instrument design. One can actually establish a set of experiments for any product and constituent univariate or multivariate model to measure the relationship between the specific type of instrument variation and its effects on the prediction results. From a set of graphical representations, we can observe how the usual changes in instrument spectra cause significant changes in prediction results.
From Figures 1–3, we may observe that the variations in SEP, bias, and slope are easily characterized as related to changes in the major spectral features of wavelength, photometric, and linewidth for the measuring instrument. For this column let us look at these issues caused by between-instrument variation. Our discussion will eventually focus on the deviation of each prediction parameter based upon the specific type of instrument variation. Note that the most common simple correction used in practice is bias, and this represents a simple zero-order correction, meaning it only averages the gross variation between prediction results for multiple instruments. It does not correct the fundamental changes in prediction values based upon spectral differences across different instruments.
To illustrate these principles we refer to the univariate case described in reference 1. From this example we can see that typical differences in wavelength, photometric registration, and linewidth show specific trends in the variation of prediction results as SEP, bias, and slope (for example, see Figures 1–3). Recall from this original column that the samples represented for this example have constituent concentration values of between 10 and 20 units (or percent), with an SEP of 0.01. Using these data, one may estimate the magnitude of the variations in predicted results caused by instrument differences. The analyte band absorbance for the example calibration dataset ranged from 0.89 to 1.12 AU (representing a small change in absorbance yields a relatively large change in concentration); and the original linewidth for the calibration set was 16.4 nm.
Instrument Differences Versus SEP
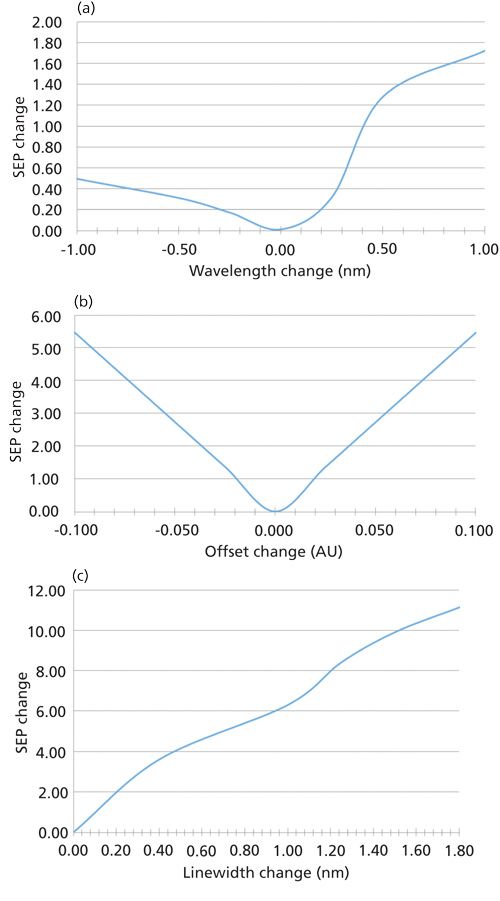
In Figure 1, we observe the changes in the SEP based upon differences in instrument measurement parameters, including wavelength registration changes, photometric offset, and lineshape (also known as linewidth). In this first set of plots we see dramatic changes in SEP with the common differences expected between most modern instrument types.

Figure 1: Changes in standard error of prediction relative to differences in (a) spectral wavelength registration, (b) spectral photometric offset, and (c) spectral linewidth.
One observes from Figure 1a that the SEP exhibits large variation with wavelength changes of ±1.0 nm. For this example one would expect that some form of calibration transfer algorithm, such as piecewise direct standardization (PDS) or another form of instrument standardization, would be required to compensate for the large changes in SEP relative to this magnitude of wavelength registration differences. Again, to measure the change in prediction values relative to differences in instrument measurement characteristics, one might perform an experiment plotting these figures for any specific calibration when altering the spectral data.
In Figure 1b we observe the expected changes in prediction results as SEP with a simple offset change that would be of the magnitude expected between different instrument manufacturers. Note that this is a simple univariate case and some multivariate models may be developed to include some compensation or accommodation to an offset phenomenon. In the case shown, a correction of the photometric axis for multiple instruments would be adequate to adjust the prediction results to be accurate.
Figure 1c shows the effects on SEP of an increasing linewidth. The SEP continues to increase as the linewidth changes relative to the calibration spectral data. One might use several methods to “correct” the prediction results, such as bias or slope, but making instruments alike with precise tracking of predicted results would require an actual bandwidth correction for the spectra.
Instrument Differences Versus Bias
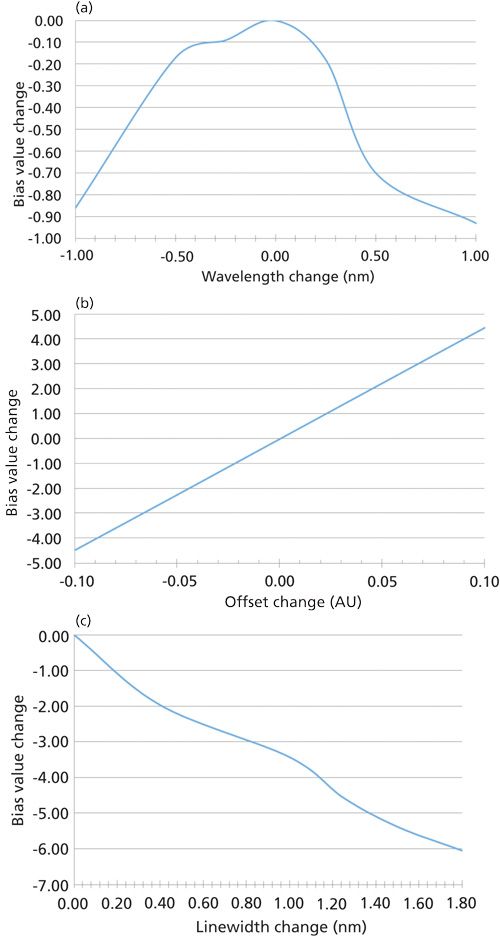
For bias changes related to each type of instrument differences, we look at changes in wavelength registration, offset, and linewidth, which have a dramatic affect on the bias of prediction results.
Figure 2a shows that the wavelength effects on bias are dramatic and demonstrates that a ±1.0 nm shift will cause a bias change of approximately -0.9 for a constituent with a mean concentration of 15. A difference in wavelength registration of this magnitude is not out of the question when comparing different instruments from the various manufacturers. Not surprisingly, a +0.5 nm shift indicated a bias change of approximately -0.7 concentration units.

Figure 2: Changes in bias relative to differences in (a) spectral wavelength registration, (b) spectral photometric offset, and (c) spectral linewidth.
Possibly even more surprising is the bias change caused by photometric differences that might be expected between instruments (Figure 2b). For this sensitive model example, the changes of ±0.10 AU caused a bias change of approximately ±4.5 units for a calibration with an average concentration of 15. One must note that when a slight change in absorbance represents a large change in concentration for a constituent, the photometric accuracy is critical to accurate prediction results.
Figure 2c shows that a change in linewidth of +1.8 nm, where the original linewidth of spectra are changed from 16.4 nm to 18.2 nm, causes a bias of approximately -6.0 concentration units for a dataset averaging 15 concentration units.
Instrument Differences Versus Slope
For prediction value slope change we may use this example to discover that offset has no affect on slope (Figure 3b), but that wavelength and linewidth changes do have a significant effect on slope. Wavelength has a much smaller effect on slope than linewidth (for example, see Figures 3a and 3c, respectively). Note that differences in wavelength registration of ±1.0 nm change slope minimally from 0.991 to 0.970 (Figure 3a). However, one may observe from Figure 3c that a change in linewidth of +1.8 nm, where the original linewidth of 16.4 nm is broadened to 18.2 nm, causes a slope change of from 1.0 (no change) to approximately 0.8.

Figure 3: Changes in slope relative to differences in (a) spectral wavelength registration, (b) spectral photometric offset and (c) spectral linewidth.
Summary
This basic analysis of the effects of wavelength registration , photometric offset, and linewidth differences between instruments on the predicted values indicated by SEP, bias, and slope provides a demonstrated method of determining the sensitivity of any product calibration to typical between instrument variation. One could easily write an automated software routine to alter spectral files and run predictions using any calibration model to determine that model’s sensitivity to typical instrument differences.
In a future column, we will discuss the statistical tests used for assessing the significance of SEP, bias, and slope in sufficient detail to describe the relationships between instrument differences required for spectral transfer to be completed seamlessly. In other words, we will answer the question of how close in spectral response instruments must be to successfully transfer calibrations without using standardization methods. We may even address techniques of how to eliminate the requirement for bias between calibrations transferred across multiple instruments and instrument platforms.
References
- J. Workman and H. Mark, Spectroscopy30(7), 32–38 (2015).
- H. Mark and J. Workman, Spectroscopy22(6), 14–22 (2007).
- H. Mark and J. Workman Jr., Spectroscopy 28(2), 24–37 (2013).
- J. Workman Jr. and H. Mark, Spectroscopy28(5), 12–25 (2013).
- J. Workman Jr. and H. Mark, Spectroscopy28(6), 28–35 (2013).
- J. Workman Jr. and H. Mark, Spectroscopy28(10), 24–33 (2013).
- J. Workman Jr. and H. Mark, Spectroscopy29(6), 18–27 (2014).
- J. Workman Jr. and H. Mark, Spectroscopy29(11), 14–21 (2014).
- H. Mark and J. Workman Jr., Spectroscopy27(10), 12–17 (2012).
- H. Mark and J. Workman Jr., Spectroscopy 29(2), 1–10 (2014).

Jerome Workman Jr. serves on the Editorial Advisory Board of Spectroscopy and is the Executive Vice President of Engineering at Unity Scientific, LLC, in Milford, Massachusetts. He is also an adjunct professor at U.S. National University in La Jolla, California, and Liberty University in Lynchburg, Virginia.

Howard Mark serves on the Editorial Advisory Board of Spectroscopy and runs a consulting service, Mark Electronics, in Suffern, New York. Direct correspondence to: SpectroscopyEdit@UBM.com

From Classical Regression to AI and Beyond: The Chronicles of Calibration in Spectroscopy: Part I
February 14th 2025This “Chemometrics in Spectroscopy” column traces the historical and technical development of these methods, emphasizing their application in calibrating spectrophotometers for predicting measured sample chemical or physical properties—particularly in near-infrared (NIR), infrared (IR), Raman, and atomic spectroscopy—and explores how AI and deep learning are reshaping the spectroscopic landscape.