Developing Portable Raman Spectroscopy Methods for Identification of Raw Materials Used in Pharmaceutical Development and Manufacturing
Spectroscopy
Portable instrumentation for Raman spectroscopy has rapidly evolved over the last decade, where sample testing that once occurred in the laboratory is now executed in the field (e.g. warehouse). Portable Raman spectroscopy is a powerful technique for the rapid identification of diversely sourced raw materials used in pharmaceutical processing. In addition to portability; reduced cost, rapid data acquisition and ease of use make this powerful technique attractive and accessible to both expert spectroscopists and non-specialists. In most cases, the method development can be easily accomplished in the laboratory after which the instrument and methods are transferred to field for sample analysis or warehouse areas for inspection of incoming raw material. Qualitative Raman methods for identification of raw materials typically utilize spectral libraries for sample to standard comparison. When developing Raman spectral libraries for raw material identification, great care is required when considering critical factors (e.g. instrument type, Raman capability, container type, container interference, background interference, material variability) that can potentially influence the identity of the material. This paper discusses portable Raman techniques and approaches for raw material identification, as well as key considerations for developing and validating Raman spectral libraries.
Portable instrumentation for Raman spectroscopy has rapidly evolved over the last decade, where sample testing that once occurred in the laboratory is now executed in the field (for example, warehouse). Portable Raman spectroscopy is a powerful technique for the rapid identification of diversely sourced raw materials used in pharmaceutical processing. In addition to portability, reduced cost, rapid data acquisition, and ease of use make this powerful technique attractive and accessible to both expert spectroscopists and non-specialists. In most cases, the method development can be easily accomplished in the laboratory after which the instrument and methods are transferred to the field for sample analysis or warehouse areas for inspection of incoming raw material. Qualitative Raman methods for identification of raw materials typically use spectral libraries for sample-to-standard comparison. Great care is required when developing Raman spectral libraries for raw material identification and considering critical factors (for example, instrument type, Raman capability, container type, container interference, background interference, and material variability) that can potentially influence the identity of the material. This article discusses portable Raman techniques and approaches for raw material identification as well as key considerations for developing and validating Raman spectral libraries.
Technological advancements in the telecommunications industry have also benefited analytical instrumentation in terms of size, speed, and performance. For example, approximately two decades ago dispersive monochromators were several feet in length, width, and height. Today, the dimensions of the entire instrument-monochromator, source, computer, and so forth-are now measured in inches. These changes have positively impacted Raman instrumentation in terms of its portability and offer the opportunity to take the laboratory testing to the sample. The idea of testing the sample at its origin minimizes the number of samples taken, sampling error, labeling error, potential worker exposure, and so on, and allows for increased efficiency when testing multiple drums and batches (1–4).
This advancement has changed the landscape for executing material identity testing in warehouses, on manufacturing floors, and in sampling suites. However, method development, validation, and implementation require additional levels of understanding of the technique, care, and caution for successful deployment into the field for testing. Uncontrolled factors outside of the laboratory environment-such as analyst training, ambient light, vibrations, and type of packaging-can easily influence measurements, and these factors are recommended for evaluation while developing and validating portable instrumental methods. Additionally, reference standard libraries are the primary source of information when analysts are developing portable methods. Unlike laboratory testing where standards are prepared and tested along with the sample, portable methods rely on stored reference standard spectra for sample identification, and evaluation of these libraries for sustainability and robustness is critical to the long term success of material identification (5).
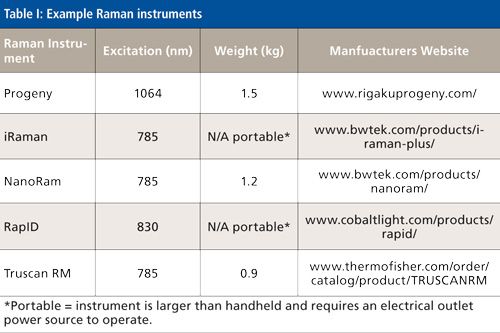
Raman instruments come in different sizes, both portable (for example, Cobalt RapID or BWTek iRaman) and handheld (such as Thermo Truscan RM, BWTek NanoRam, and Rigaku Progeny). Both instrument types offer different benefits, and users must balance ease of use with performance when making platform decisions. Table I provides a small sample of some portable and handheld instruments that are available on the market today.
When approaching the development of an instrumental method and its library for raw material identification testing, several factors should be included in the assessment. Listed below are a few items to consider:
• Is the material of interest Raman active (6)?
• If so, is it a strong, medium, or weak Raman scatterer?
• Does the analyte fluoresce (7)?
• Is the sample presentation a powder, liquid, suspension, or solution?
• Does the material degrade upon exposure to ambient conditions (for example, moisture or light)?
• Can it be tested through its container (for example, low density polyethylene or high density polyethylene)?
• Are the results sufficiently reproducible between batches?
• Does the library show specificity between similar materials that must be distinguished (for example, anhydrates and hydrates)?
A material’s Raman scattering characteristics and fluorescence background significantly influence method robustness. Typically, most molecules with covalent bonds are Raman active; however, the nature and intensity of their scattering can vary. For example, the hydroxide O-H stretch in sodium hydroxide will show Raman activity, but it does not provide a strong signal, making sodium hydroxide a poor candidate for identity testing by Raman. However, as the covalent bonds increase in number and conjugation, Raman activity increases. For example, most amino acids-especially phenylalanine-are great Raman scatterers, and the conjugated ring in phenylalanine provides a significantly strong signal (approximately 1000 cm-1) for identification testing purposes. For water solutions, Raman is an ideal measurement technique because water will not interfere with the Raman signal of the material of interest, unlike Fourier transform-infrared (FT-IR) and near-infrared (NIR) spectroscopy where water produces a strong background and can in most cases interfere with the material of interest (6).
The Raman signal is significantly important when considering concomitant fluorescence. For example, molecules that are weak or medium Raman scatters (for example, microcrystalline cellulose) will likely be challenging to identify when background fluorescence interferes with the signal. Background fluorescence may be a result of low-level contaminants or transition metals allowing charge transfers to occur and forming populated phosphorescent or fluorescent excited states (8). The concentration of impurities can be quite low and still introduce fluorescence interference into the analysis. The sources of fluorescence are often not directly detectable by Raman and may require significant analytical effort to be identified.
Instrumentation can also offer assistance in reducing fluorescence background. For example, (relatively) low energy 1064-nm excitation sources are great at minimizing fluorescence; however, such instrumentation suffers from signal loss because Raman efficiency is low (inversely proportional to λ4) (9). Advances in technology have brought newer dispersive 1064-nm-based Raman systems to the market that have demonstrated increased sensitivity (10,11). As an alternative, the low-energy 830-nm lasers have slightly increased photon energy allowing the use of a more sensitive charge coupled device (CCD) detector. These detectors have been successfully used to reduce fluorescence with adequate sensitivity (4).
While developing material identification Raman methods, one should consider if testing through the container is an option to avoid sampling the material. Most Raman technology can now test through sample containers such as polyethylene bags or glass, but technology differences offer varying sampling depths. Traditional backscattering Raman instruments (such as BWTek NanoRam, Thermo Truscan RM, and Rigaku Progeny) are capable of scanning through most thin-layered plastic and glass containers; however, caution must be exercised when examining the spectra to evaluate signal contributions from container materials. Techniques such as spatially offset Raman spectroscopy are capable of penetrating thicker plastic containers (such as high density polyethylene buckets) and provide rich material spectral features. The spatially offset Raman approach is also helpful when testing through dark amber glass where glass background interferences are a limiting factor.
As part of this article, we discuss method robustness including types of Raman instrumentation, sample material, sample container, and analyst variability. As mentioned, each factor may influence both the method and library builds and can limit testing performance. This article evaluates these factors and addresses the appropriate ranges around testing them to demonstrate library success for material identification methods.
Method Robustness
Material
As mentioned, the analyte or material may impact method robustness when considering both Raman scattering and fluorescence. The following example shows a case where a sample failed to be identified correctly when compared to the reference library scan using a handheld instrument’s on-board algorithm. In Figure 1, the sample demonstrated a significantly greater signal-to-noise ratio and a smaller fluorescence background than the library reference spectrum, which resulted in a poor sample to standard match. In this example, the tartaric acid standard included in the library used material from the same vendor; however, fluorescence differences are difficult to predict and vary greatly depending on small differences between batches and vendors. In this case, a new standard was purchased and evaluated for both the Raman signal and background fluorescence. This approach was found to improve the reliability of sample-to-standard matches in subsequent tests.
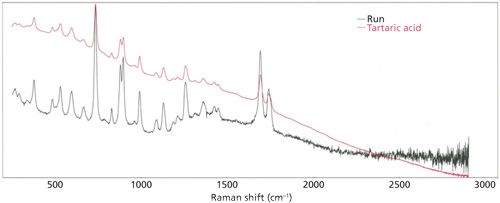
Figure 1: Tartartic acid fluorescent standard.
It should also be noted that while in this case the sample showed less fluorescence than the standard, the opposite can be true as well, which will also likely cause an identification failure (such as a false negative). An appropriate control strategy would be to continue to evaluate the vendor supply and track results for the tested materials and address acceptable long-term material variability by adding new and representative standard scans to the library. As shown in Figure 2, a simple variability gauge chart can be used to evaluate material variability from one or more vendors. As noted on the plots, the same material exhibited different p-values when sourced from two different vendors. Furthermore, Figures 3 and 4 show that in both cases, spectra of samples from vendor 1 deviate significantly from the reference spectrum where background differences significantly impact the comparisons. For sodium carbonate, which is a strong Raman scatterer, the background was significantly greater for samples from vendor 1, which in effect resulted in a poor match to the reference scan. For microcrystalline cellulose (MCC, a weak Raman scatterer), the opposite was true. The failing sample background was reduced, which led to an increased signal-to-noise ratio and a poor match to the reference scan. These differences are easily remedied by adding representative reference spectral scans into the library; however, caution must be exercised to make certain the materials whose scans are added are acceptable for the intended production use. Typically, orthogonal methods such as FT-IR are used to verify the materials are sufficiently similar followed by confirmatory compendial testing. Other options that can be used to reduce false negatives would be to change the wavelength of excitation to a lower energy (830 or 1064 nm) to minimize fluorescence contributions to the background signal, or to change the spectral preprocessing to include baseline correction or second derivative signal processing.
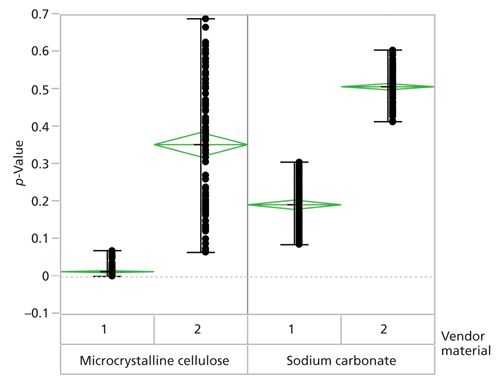
Figure 2: Variability chart of material versus vendor.
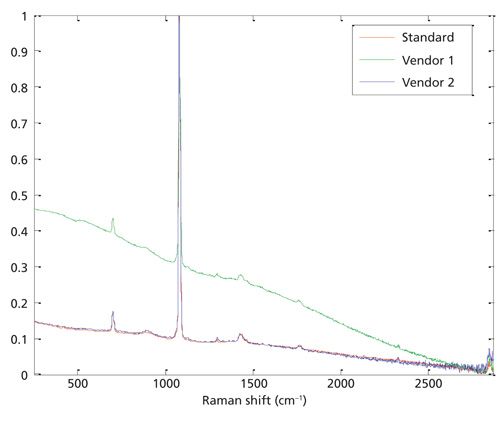
Figure 3: Sodium carbonate with standard (normalized).
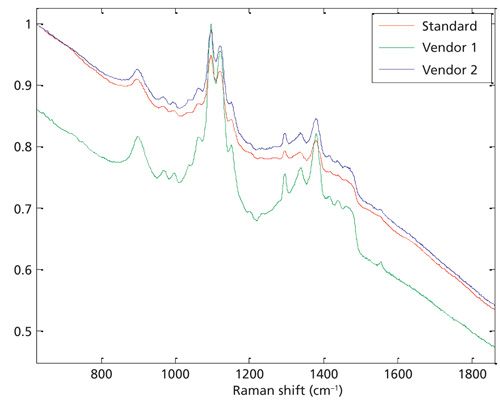
Figure 4: Microcrystalline cellulose (MCC).
Packaging
If samples are analyzed in situ and packaging materials are not properly addressed at the beginning of the method build, they can have a negative impact on method robustness. Signal contributions because of container materials are even greater for poorly Raman scattering analytes. Typically, samples in low-density polyethylene (LDPE) are easily measured by Raman spectroscopy, and the package shows little to no spectral features; however, if the material is double layered, has overlapping sheets, is tinted or opaque, air pockets are present, or is a different construction, signals from packaging may interfere. Figure 5 is an example scan of anhydrous citric acid for which the identification routine failed because of packaging interference where the instrument nose cone was in contact with an overlapping layer of LDPE.
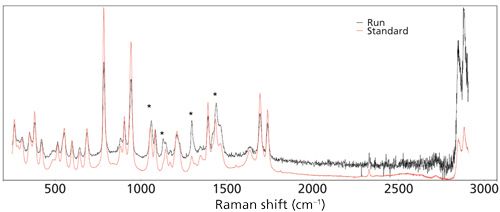
Figure 5: Example failing result from interfering LDPE liner (indicated with an asterisk in the figure).
Other examples of package and container peaks are observed in cases where the container is relatively thick and the instrument is designed to scan sample material behind the container. In these instances, the container peaks are not removed in their entirety and method libraries may be built around their inclusion into library spectra. Figure 6 shows a spatially offset Raman spectroscopy scan of dextrose in a white HDPE pail with an LDPE inner liner. The zero scan represents a spectrum obtained at the surface of the package, and the the offset scan represents a spectrum that is spatially offset from the surface and captures the spectrum of material behind the container wall. The resulting spectrum is the difference of the zero scan subtracted from the offset scan (scaled subtraction). However, the final resulting scan also includes container peaks from polyethylene. This approach is acceptable provided that the method is sufficiently robust to not be biased by container material thickness differences and that no air pockets or liner packaging peaks overlap or otherwise interfere.
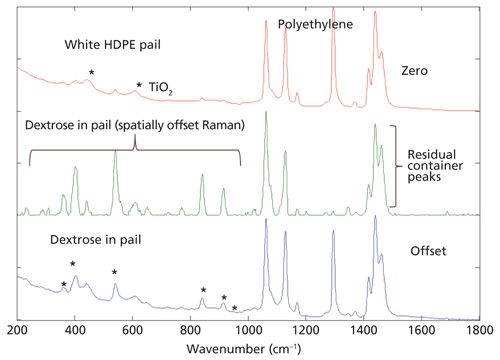
Figure 6: Dextrose in white HDPE pail.
Method robustness can be improved by scanning several reference scans at different locations on the container and including multiple batches in the library. Ideally, to minimize variability, the method should be built around a single container type (for example, white HDPE) and should include reference scans of material sourced from multiple vendors, if possible. As noted in Table II, method creation and method validation should include scans from several positions on the same container and containers from different vendors and batches. Depending on the material, its Raman characteristics, and the algorithmic preprocessing that is used, the results can exhibit different levels of variability. In Table II, tromethamine and glycine showed the lowest “scores” values, which were likely related to container variability. The “scores” values are results generated from chemometric reports that describe the “likeness” of the sample to the model population of the reference standards. The higher the scores value, the closer the sample data are to the standard data, with a value of 1 being a perfect match. Limits are established around acceptable reference data that are capable of capturing outliers or failures. The results for all materials were significantly above the acceptance limits (minimum threshold). Thus, in many cases the limits could potentially be raised; however, for the method library, applying lower acceptance limits is necessary to capture the appropriate level of variability that is expected in real data sets. The distinct disadvantage of adopting low limits for library acceptance criteria would be the opportunity for false positives (passes for something other than the targeted material) or negatives (targeted material incorrectly fails comparison), but with proper library cross-checks, false passes and failures can be mitigated. In the examples listed in Table II, all materials were cross-checked against their models and validation runs. Additionally, pure container components such as HDPE were added to the library to make certain that sample scans were not passing only against container components. In all cases, no library or validation run improperly passed against another material or against an empty container.
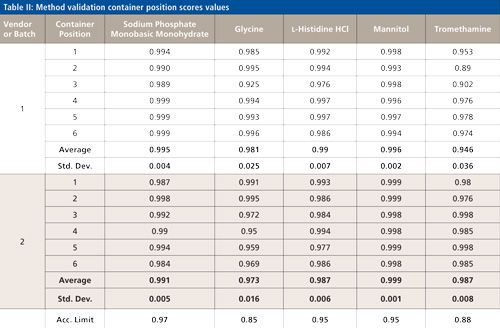
CLICK TABLE TO ENLARGE
Upon review, only glycine and tromethamine demonstrated relatively low scores values, and through inspection of their individual spectra (Figures 7 and 8), an outlier spectrum was identified in each case that explains the lower scores obtained. As noted, small spectral region differences add to the overall variability of the method. For these examples, the differences are likely related to preprocessing effects and as in this case, the differences are relatively small.
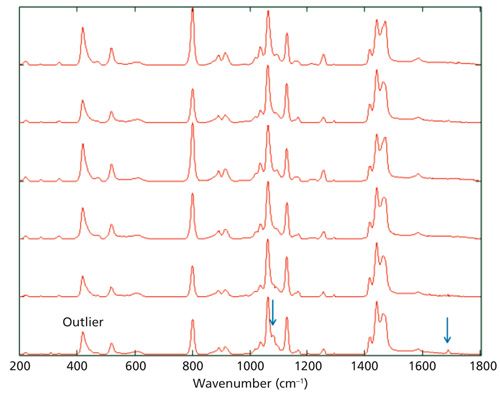
Figure 7: Tromethamine spectra.
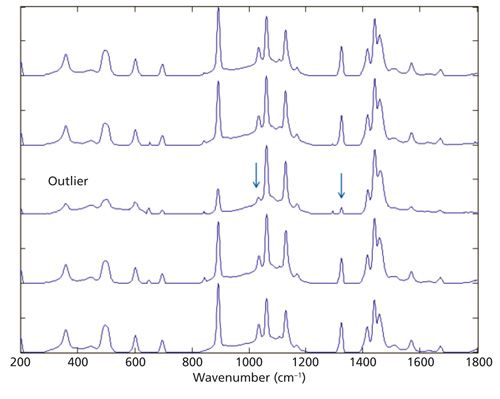
Figure 8: Glycine spectra.
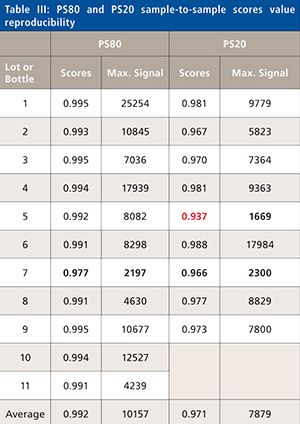
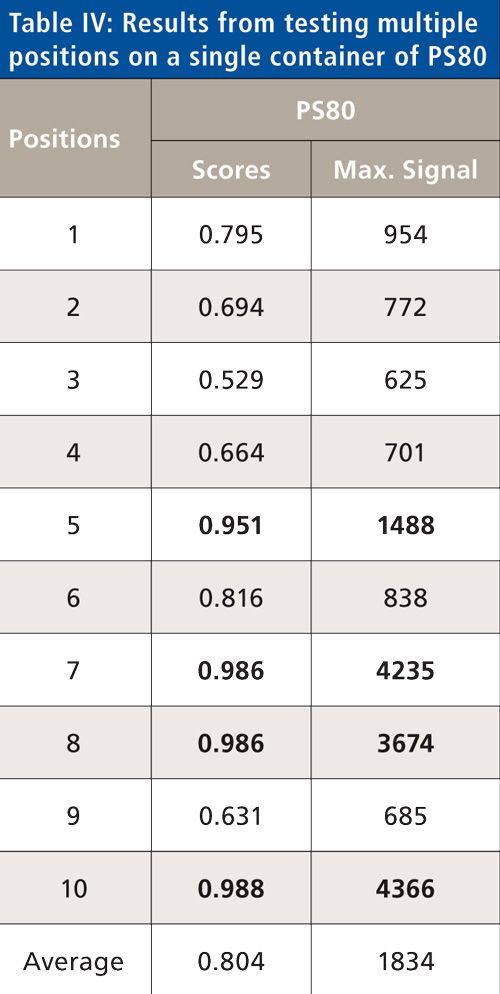
For storage of polysorbate 20 and 80 (PS20 and PS80), 1-L amber glass bottles are often used for the purpose of reducing photodegradation. In addition, to eliminate autoxidation production teams usually request that the bottles not be opened for any appreciable length of time for sampling purposes. Thus, sampling and testing such materials can be challenging. Spatially offset Raman methods are useful for material identification by testing through the unopened amber glass container. As with any container, amber glass can interfere by attenuating the Raman signal and generating a fluorescence background. The data shown in Table III were generated on multiple lots of PS80 and PS20 bottle samples or lots using spatially offest Raman spectroscopy to scan through the amber glass with the baseline offset and Pearson correlation. For PS80, 11 out of 11 bottles passed consistently above the acceptance criterion of 0.965. The lowest scores value, 0.977, showed the weakest response (Figure 9), which suggests its lower value is likely related to the fact that the response of the sample is weaker than the average of the model spectra used to build the model. Similarly, PS20, demonstrated one failure (scores value = 0.937) and a review of the failing spectrum (Figure 10) shows that its maximum signal response was significantly lower than the other spectra that passed. Additionally, one other spectrum (0.966) with a similar appearance as the spectrum at 0.937, was above the acceptance criterion of 0.950, but also demonstrated a lower maximum signal. Finally, multiple scans were made on the failing PS20 1-L amber container to see if the amber glass was influencing the results. As shown in Table IV, the variability across the 10 positions was significant and the passing results demonstrated a higher maximum signal than the failing results. By comparison, the average maximum signal (3441) for the passing results from this single bottle was less than the average of the passing results for multiple bottles as shown in Table III. The difference in the signal maximum suggests that this single bottle impacted the sample results because of the contribution of its attenuated Raman spectra. However, as demonstrated, the bottle was not consistent in this regard across multiple locations.
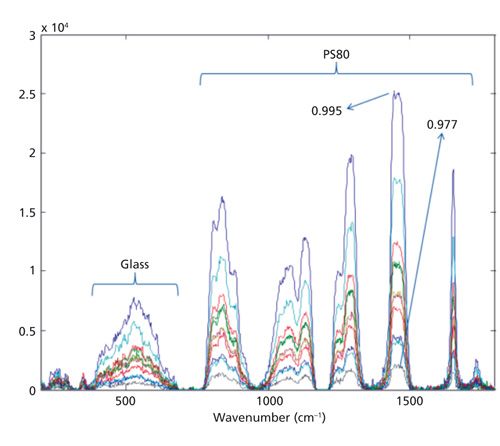
Figure 9: PS80 spectra sample-to-sample reproducibility.
As with any test designed for a quality control environment, a few approaches can be used to address testing variability and reduce the work required for analytical investigations when they arise. For the most part, models should be built before method validation and implementation, and the models should be capable of capturing observed variability; however, in the case shown above for PS20, the spectra for the failing results demonstrated poor signal-to-noise ratios, and if added to the model, would create a model prone to false positives (for example, PS80 might be identified as PS20). For some examples, adding a new “lower signal” reference scan to the library may offer a better (that is, more robust) overall model. Another option to address this failure mode would be to include acceptance criteria in the method for the maximum signal or signal-to-noise ratio to allow for rescanning the sample bottle when a failing result is produced because of a signal that is below an acceptable limit. In the example shown in Figure 10, the acceptance criterion for the maximum signal would likely need to be above 2000; however, as noted, a passing scores value of 0.951 was generated with a maximum signal of less than 2000 (1488). Therefore, further statistical evaluation would be required to test the robustness of this acceptance limit. Considering a lower scores acceptance criterion for the on-board instrument algorithm may be useful as well. In the PS20 example shown in Figure 10 and Table IV, an acceptance criterion of 0.930 was tested, but after it was established, PS80 was misidentified as PS20. Finally, another possible option after a failing result is obtained would be testing the material with an orthogonal technique. This approach can be challenging because the material container would need to be opened, and for most cases, opening PS20 or PS80 will likely render it unusable for manufacturing (thus requiring sourcing a “side sample” for analysis).
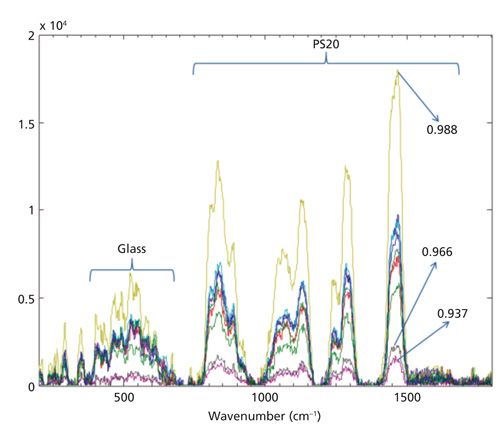
Figure 10: PS20 spectra sample-to-sample reproducibility.
A failure observed for tromethamine is shown in Figure 11, which demonstrates the effect of air pockets while testing. After several scans at different locations on the 5-g white HDPE pail with inconsistent results, the packaged material was removed from the pail in its LDPE inner liner. Air pockets were found to be present at locations where the instrument probe was placed for testing near the bottom of the pail and vertically along the vendor label. Similar to the PS20 example, method requirements can be implemented to allow for additional container scans, provided that an appropriate investigational analysis is completed to fully assess the failure. In this case, several of the sample scans showed ambient light peaks, which were a product of minimal sample-to-container contact. With significant air pockets, light will permeate through the container wall and get detected. The test method should thus be written to consider the evaluation of light peaks as a contributing factor to failing results, and in such cases, the testing could be reexecuted by removing the container lid and testing through the inner liner or by evaluating for air pockets and then scanning in areas where the analyte material is consistently in contact with the outer container.
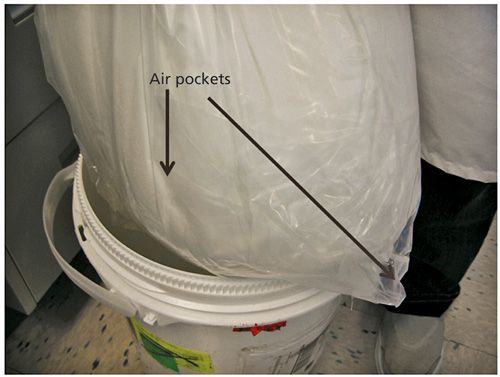
Figure 11: Air pockets and overlapping LDPE after inner liner is removed and replaced.
User
Evaluating the user as a source of method model variability can be difficult considering all three components of variability (that is, instrument, material or container, and user) interact together; however, the level of experience of different users, as well as the method developer affect the ultimate success of the method build and the implementation of the instrument. For a method developer, the criteria used by the instrumentation to make “pass” or “fail” decisions are key components of the method and library building. In some instances, the algorithms are straightforward where the comparison of the sample to standard scan is made with little preprocessing (for example, first derivative) and the comparison is made against the “best match” spectrum in the library. Other comparison methods use chemometrics to make the comparison to a library model. The developer needs to understand the effects of spectral preprocessing and modeling. In either case, the developer needs to consider and include spectra that capture the appropriate historically observed material variability such as lot-to-lot and vendor-to-vendor differences. Finally, and most importantly, the developer must understand the impact on library selectivity when adding a new reference spectrum of the same material or new materials to prevent false negatives or false positives.
Users introduce the greatest source of variability when using the instrument for testing. However, it is also true that user variability occurs during method development as well. If the portable instrument probe is not in appropriate contact with the container, the captured spectrum will be representative of the container and not the sample. In discussions with analysts, many have expressed the importance of handling the inner liner to find an area that has no overlapping container or air pockets, and during the testing making sure they are firmly pressing the probe against the container. However, when the material is pliable (free flowing) they suggest that pressing too firmly may produce a void or tear the liner. In other cases, if the probe is not in appropriate contact with the package, room light may be introduced and lead to failures.
Conclusion
In summary, portable instrumentation for the purpose of material identification has proven to be efficient and cost effective. Failures classified as false negatives or positives are directly related to the variability captured in the library standards. In either case, failures lead to significant business impacts in time and effort needed for laboratory investigations. Failures may be minimized by capturing the appropriate level of library robustness and additionally understanding the factors that may lead to a failed result. As shown in this review, such factors can easily be addressed by capturing adequate variability in the reference standard scans included in the method library. One must exercise caution in either underbuilding or overbuilding the library. Including scans of materials that are not considered acceptable would allow for false positives; however, not including the appropriate level of variability would lead to false negative results. Periodic library review is essential to maintaining a robust library. In most cases, one might believe continuing to add to a library would suggest robustness. Although this belief might seem reasonable, in actuality, overbuilding the library may result in unwanted variability from outdated reference scans for materials that may no longer be considered acceptable, such as with spectral background interferences that were once considered representative. Additionally, materials may change either in their manufacturing process or in the supplier, leading to sample-to-standard differences that require a library update. Finally, portable instrumentation allows for moving the testing location out of the laboratory and into the field (such as in a warehouse), which in most cases introduces new levels of complexity and variability along with agility and speed. If addressed during the method development, this mode of testing offers significant long-term advantages in a climate of changing requirements and regulations.
References
- D. Yang and R. Thomas, Am. Pharm. Rev.15, 22–26 (2012).
- J. Linoski, “Application Notebook” supplement to Spectroscopy24, 16 (2009).
- Rigaku Progeny, www.rigaku.com/en/products/raman/progeny.
- M. Bloomfield, D. Andrews, P. Loeffen, C. Tombling, T. Yor, and P. Matousek, J. Pharm. Biomed. Anal. 76, 65–69 (2013).
- M. Dotlich, Eur. Biopharm. Rev. “Webinar - Navigating the Complexities of Pharmaceutical Manufacturing Regulations, USP Spectral Library - Development Validation and Implementation,” www.europeanpharmaceuticalreview.com (2014).
- K. Nakamoto, Infrared and Raman Spectra (John Wiley and Sons, Inc., Hoboken, New Jersey, 1986), pp. 3–44.
- E.C. Le Ru, L.C. Schroeter, and RG. Etchegoin, Anal. Chem.84, 5074–9 (2012).
- C.P. Marshall and A.O. Marshall, Astrobiology15, 761–769 (2015).
- (9) W. Yang, H. Wu, J. Qian, L. Chandler, C. Lieber, and C. Dentinger, Proc. of SPIE854603, 1–8 (2012).
- H. Hisada, T. Nogami, and F. Muta, Journal of Pharmaceutical Machinery and Engineering24, 407–413 (2015).
- C. Dentinger, Eur. Biopharm. Rev. “Webinar – Navigating the Complexities of Pharmaceutical Manufacturing Regulations, Extend the range of RMID tools – R&D to Formulations,” www.europeanpharmaceuticalreview.com (2014).
Michael A. Dotlich and Indrajit Giri are with Eli Lilly & Company in Indianapolis, Indiana.
Direct correspondence to: dotlich_michael_a@lilly.com

AI-Powered SERS Spectroscopy Breakthrough Boosts Safety of Medicinal Food Products
April 16th 2025A new deep learning-enhanced spectroscopic platform—SERSome—developed by researchers in China and Finland, identifies medicinal and edible homologs (MEHs) with 98% accuracy. This innovation could revolutionize safety and quality control in the growing MEH market.
New Raman Spectroscopy Method Enhances Real-Time Monitoring Across Fermentation Processes
April 15th 2025Researchers at Delft University of Technology have developed a novel method using single compound spectra to enhance the transferability and accuracy of Raman spectroscopy models for real-time fermentation monitoring.
Nanometer-Scale Studies Using Tip Enhanced Raman Spectroscopy
February 8th 2013Volker Deckert, the winner of the 2013 Charles Mann Award, is advancing the use of tip enhanced Raman spectroscopy (TERS) to push the lateral resolution of vibrational spectroscopy well below the Abbe limit, to achieve single-molecule sensitivity. Because the tip can be moved with sub-nanometer precision, structural information with unmatched spatial resolution can be achieved without the need of specific labels.