Characterization of GeSbSe Thin Films Synthesized by the Conventional Melt-Quenching Method
Spectroscopic ellipsometry, correlated with UV-vis-NIR spectroscopy, is used to determine the optical constants of thin films, such as in GexSb40-xSe60 chalcogenide glass.
Chalcogen thin films GexSb40-xSe60 with the compositionx = 12, 25, and 30 (atomic percentage) at.%, have been synthesized from elements with 99.999% purity (Ge, Sb, Se) by the conventional melt-quenching method. The quartz ampoule containing the mixture of elements with proper weight percent was evacuated down to a pressure of 10-3 Pa. The parts of synthesized glasses were served as parent material for deposition on the quartz substrate. The Swanepoel method was applied to transmission spectra given by the Lambda spectrophotometer to determine the optical properties of the thin films. The influence of the glassy composition on the optical constants of the films was studied by spectroscopic ellipsometry and correlated with UV-vis-NIR spectroscopy to determine the optical constants.
The chalcogens are the chemical elements in group 16 of the periodic table, and are also known as the oxygen family. Chalcogens consists of the elements sulfur (S), selenium (Se), tellurium (Te), and the radioactive element polonium (Po). Polonium is also a chalcogen, but is not used because of its strong radioactivity. The last chemical element in this group, Lv, is uncharacterized, and predicted to be a chalcogen as well (1). Oxygen is treated separately from the other chalcogens, because of its very different chemical behavior from sulfur, selenium, tellurium, and polonium.
Chalcogenide glasses are covalently bonded materials, and may be classified as covalent network solids. Chalcogenide materials have low band gaps, contributing to very dissimilar optical and electrical properties.
The classical chalcogenide glasses are based on As-S or Ge-S that form a strong glass within large concentration regions. Glass-forming abilities decrease with increasing molar weight of constituent elements; for example, S > Se > Te (2).
More recently, chalcogenide ternary GeSbSe glasses suitable materials for both passive and active infrared applications, such as optical fibers devices, given their thermal, mechanical, and chemical properties (3–4). Chalcogenide glass based on GeSbSe deposited on silica glass substrate has losses in optical propagation that can be achieved in photoinduced channel waveguides (5). GeSbSe system can be synthesized from a solid target using different physical vapor deposition (PVD) methods such as thermal evaporation (6–9), RF magnetron sputtering (6,10–13), or pulsed laser deposition (10,13).
By varying the chemical composition of GeSbSe thin films, the network undergoes changes reflected in the structural phase transformations (14–16), to the effect of doping Sb on the electronic structure (17) and in the threshold transition in the physical parameters (18). The ternary chalcogenide glasses offer a new important application for infrared-transmitting lenses and infrared imaging sensors (3,19–21). The optical parameters determinate by spectroscopy methods are used to study thin films in optical waveguide devices, dynamic random-access memory (DRAM) materials, and electro-optical and sensor or actuator devices.
In this study, GexSb40-xSe60sampleswith composition x = 12, 25, and 30 at.% were measured by a Lambda 950 spectrophotometer, and we determined the optical properties using the Swanepoel method (22). The results obtained by the ultraviolet-visible-near infrared (UV-vis-NIR) spectroscopy are correlated with spectroscopic ellipsometry measurements.
Experimental Details
Glassy system GexSb40-xSe60 alloys with composition x = 12, 25 and 30 at.%, were synthesized from elements with 5N purity (Ge, Sb, Se) by conventional melt-quenching methods. The mixture of the elements with proper weight percent was placed in a quartz ampoule, and evacuated down to a pressure of 10-3 Pa. The ampoules were loaded in a rotary furnace, and heated up to 950 °C. To achieve homogeneous melting, the glassy mixture was kept at this temperature for a continuous 2 h by rotating the furnace. Then, the ampoules were pulled out, and the melts were rapidly cooled down in ice water.
The parts of synthesized glasses were served as parent material for deposition on the quartz substrate, using a resistive crucible with a 0.1 mm molybdenum sheet having the shape and size of item number 0482070 in the UMICORE catalog. Plasma cleaning with glow discharge took place at a pressure of 10-1 Pa for 12 min in the N2, and during that time, the dome with the quartz substrates was rotated at 10 rot/min. This process removed impurities on the walls from the vacuum deposition installation and on the bulk. At 4×10⁻³ Pa pressure, the heating resistance was coupled, by ensuring a temperature of 300 oC in the evaporation chamber while the dome rotation was kept.
The powder material was evaporated at an electric current at least 400 mA. The monitoring of the deposition control was done by the software TFCalc 3.5 for approximately 6 min, with a deposition rate of 3 nm/sec, and showed 1300 nm thickness. After evaporation, the samples were measured by a Lambda 950 spectrophotometer to determine the optical constants (J.A. Woollam Co. Inc.). Spectroscopic ellipsometry measurements were used to certify the dates.
Spectrophotometer Results and Discussion
The spectrophotometer measurements were recorded on a Lambda 950 Spectrophotometer with double beam and double monochromator atroom temperature, in the UV–vis-NIR spectral range at 266 nm/min, a scanning speed for normal incidence.
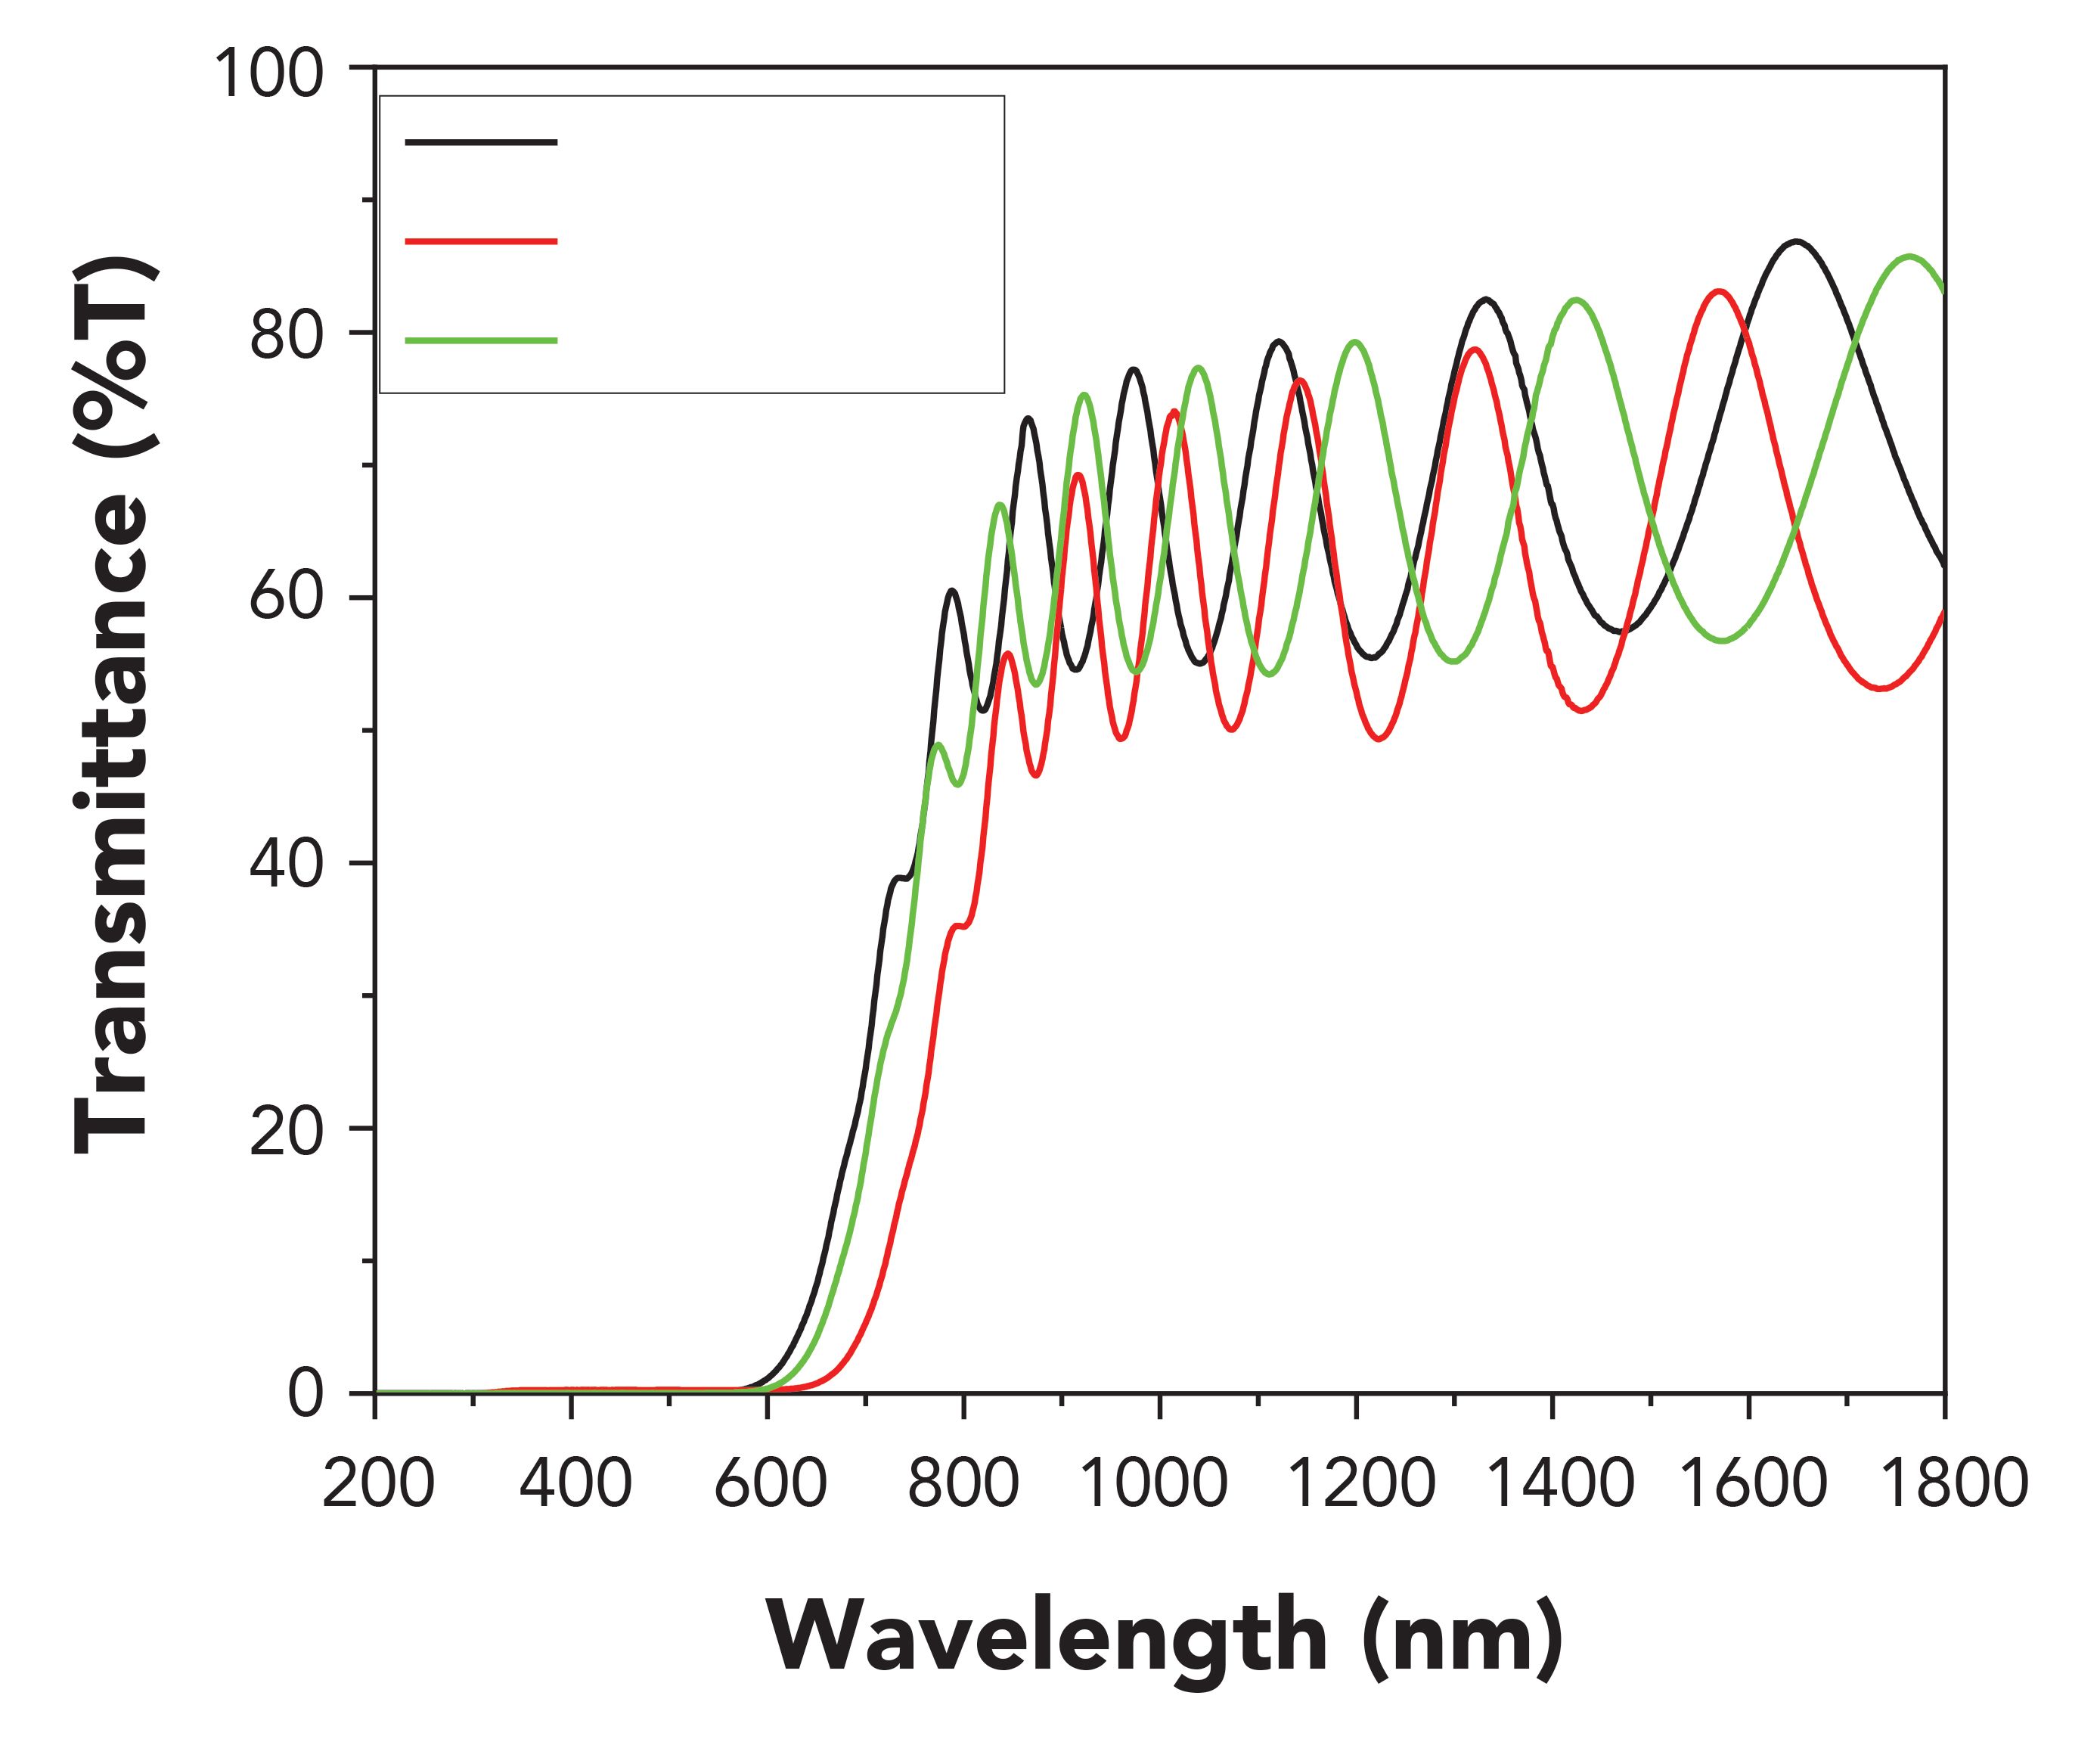
The optical system under consideration corresponds to homogeneous and uniform thin films, deposited on thick transparent substrates. Figure 1 shows the variation with respect to wavelength of the transmittance for glassy system GexSb40-xSe60 alloys with composition x = 12, 25, and 30 at.%. The film has the thickness d and the complex refractive index
[1]

Figure 1: Spectral transmission obtained from spectrophotometer (21).
where n is the refractive index and k the extinction coefficient. The transmission Tλ(1–4) at normal incidence is given by:
[2]

[3]

[4]

[5]

[6]

[7]
[8]

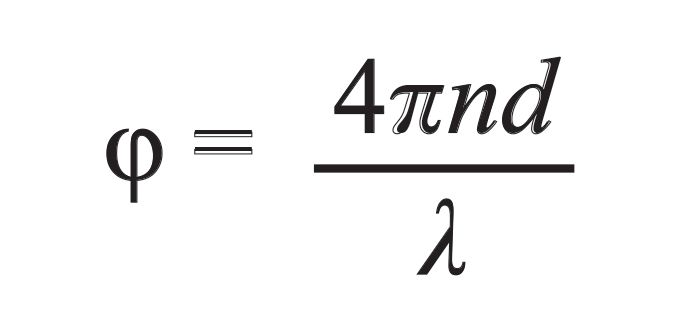
where n is the refractive index, s is the index of the quartz substrate and the value is s = 1.458, d is thickness, φ is the phase difference between the direct and multiple reflected transmitted beams,is the absorbance and α is the absorption coefficient.
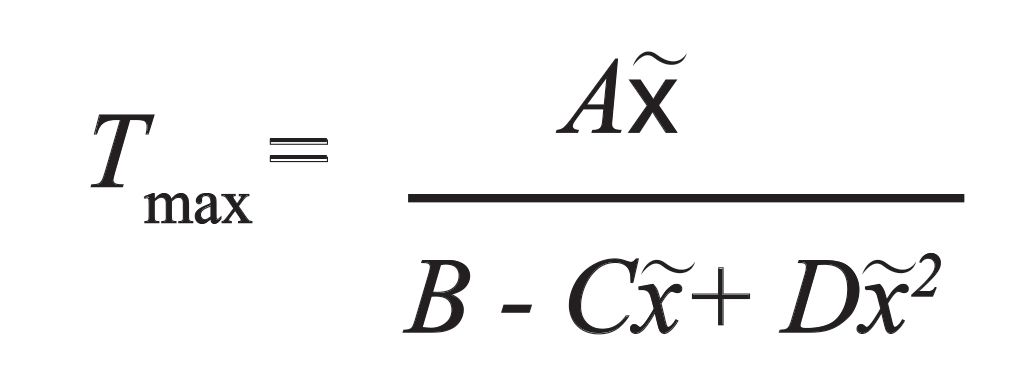
Based on Swanepoel’s method (22–23), which is based on the idea of Manifacier and associates (24) , the transmission values at the maxima and minima of the interference fringes can be obtained from equation 2 by setting the interference condition cosφ = +1 for maxima (Tmax) and cosφ = -1 for minima (Tmin) . The expressions of Tmax and Tmin are the following:
[9]
[10]
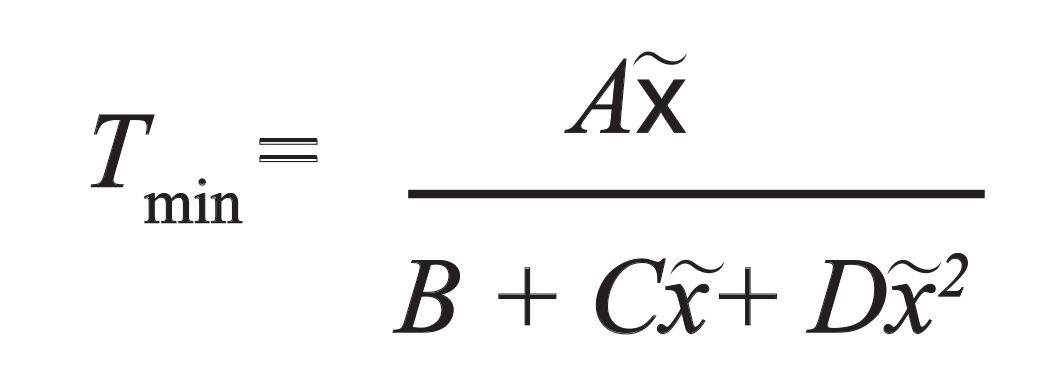
This method implies the calculation of the maximum Tmax and the minimum Tmin transmittance envelope curves by using the parabolic interpolation of the position of the experimental peak. Figure 2 exemplifies the relationship between the maximum Tmax and the minimum Tmin transmittance and the wavelength for Ge30Sb10Se60 films.
Figure 2: Envelope function applied to spectral transmission exemplified for GexSb40-xSe60 thin films.
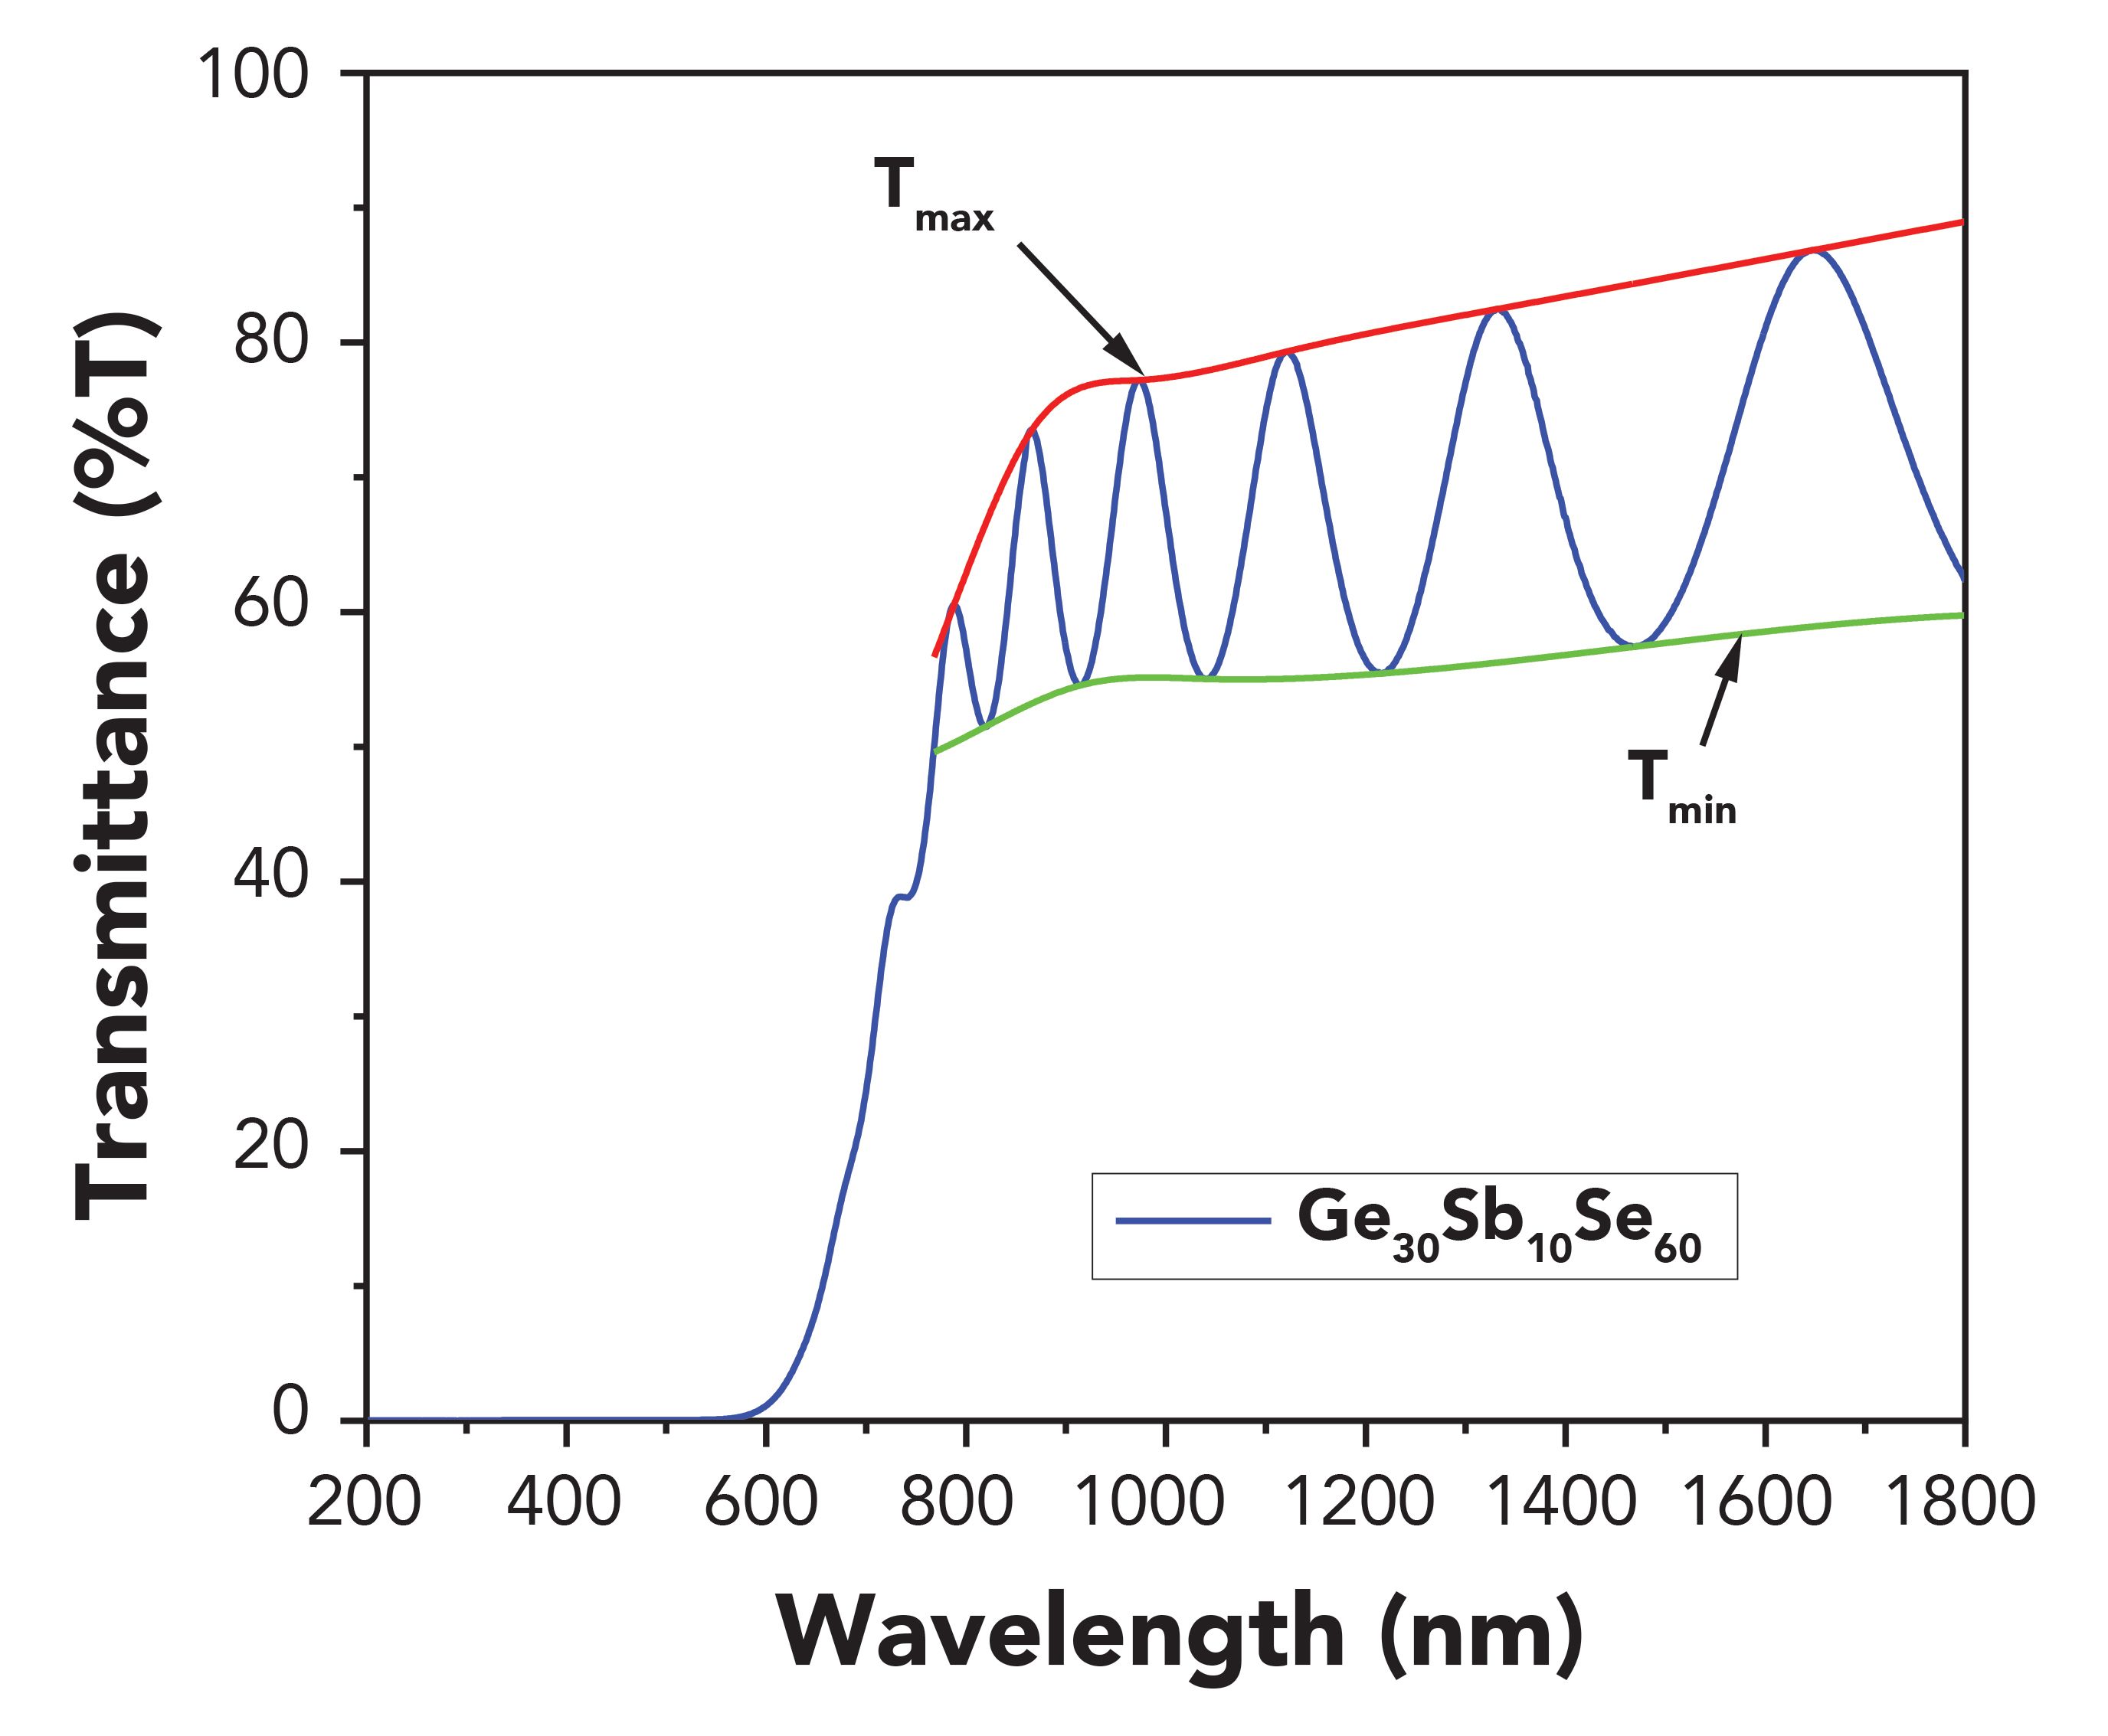
We mainly observe two distinct regions: a region (800 to 1800 nm) having interference fringes whose operation allows us to determine both films' refractive index and thickness, and a region (200 to 800 nm) where the absorption becomes larger, which results in a progressive damping of the interference fringes and a strong decrease of the transmittance.
The first approximate value of the real part of the refractive index n of the film, in the spectral region of medium and weak absorption, can be calculated using the following expression (25–27)
[11]

where
[12]

here Tmax and Tmin are the transmission maximum and the corresponding minimum at a certain wavelength λ.
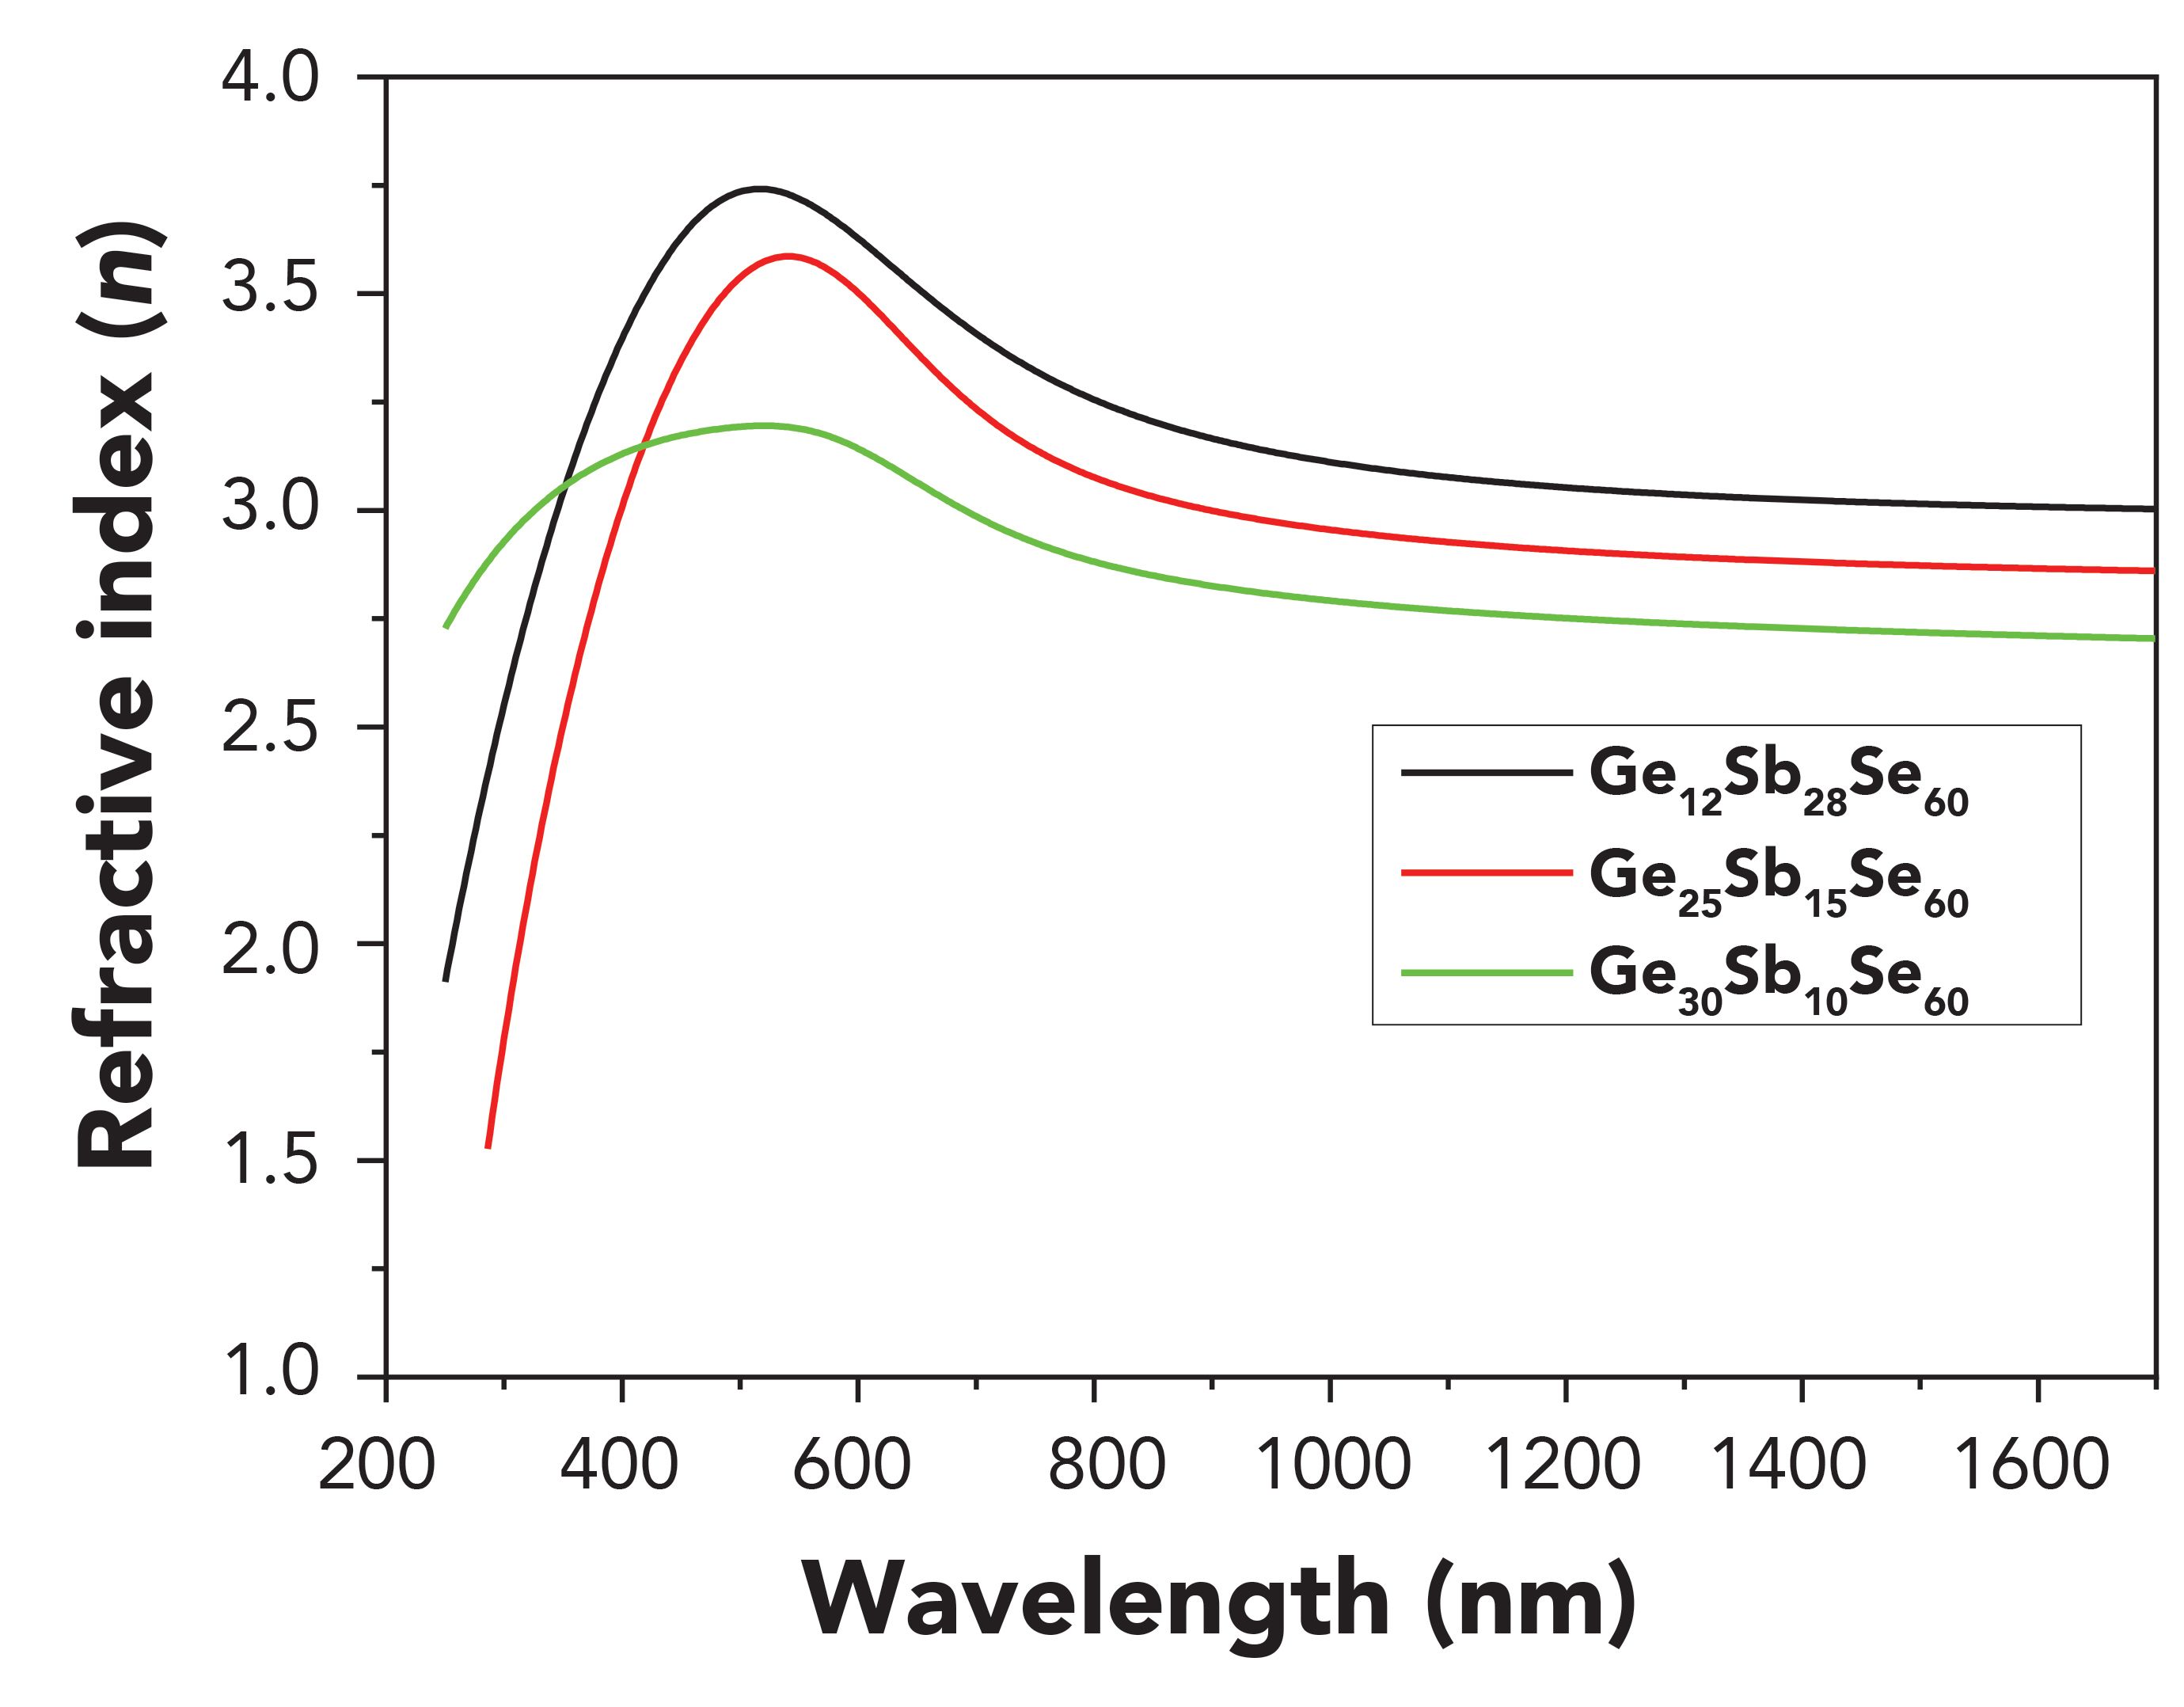
The values of the refractive index n1, which is the first approximate value of the real part of the refractive index, as calculated from equation 11, are present in Figure 3. The results are shown in Table 1, and are according to (3,27). The refractive index of the samples varies with the germanium content. We can see that the refractive index decrease when increasing the
germanium content.
Figure 3: Refractive index (n) calculated by equation 11 for GexSb40-xSe60 alloys with composition x = 12, 25, and 30 at.% (21).
The accuracy of this initial estimation of the refractive index is improved after calculating d, as will be explained below. It is necessary to take into account the basic equation for interference fringes:
[13]

where the order number m is an integer for maxima and half integer for minima.
Moreover, if n(λ1) and n(λ2) are the refractive indices at two adjacent maxima (or minima) at λ1 and λ2, it follows that the film thickness is given by
[14]

Equation 14 is very sensitive to errors in refractive index n, and is not very accurate. The film thickness values obtained from equation 14 are shown in Table I. There is some dispersion in the values of d. This deviation is an indication that n1 as calculated from equation 11 is not accurate enough.
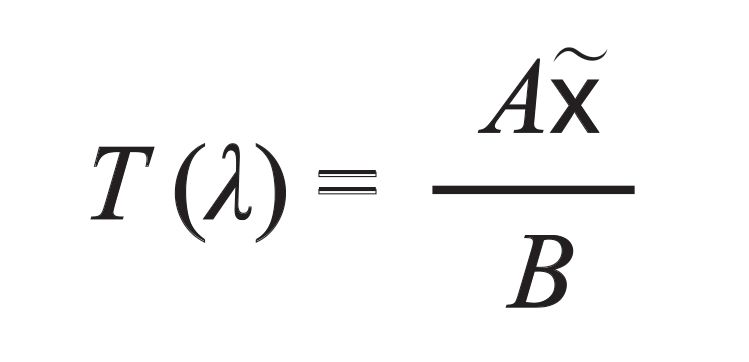
To determine the absorption coefficient, we used the transmittance T in the region of higher absorption (between 200 and 800 nm). The expression [2] of T in this region is reduced to
[15]
[16]

[17]

In this a region of strong absorption, the interference fringes disappear and the three curves for Tmax and Tmin converge to a single curve. A and B depend on the refractive index of the thin film and refractive index of the quartz substrate. The thickness d is calculated (Table I), thus we can determine the absorption coefficient α (Figure 4) by the expression
[18]
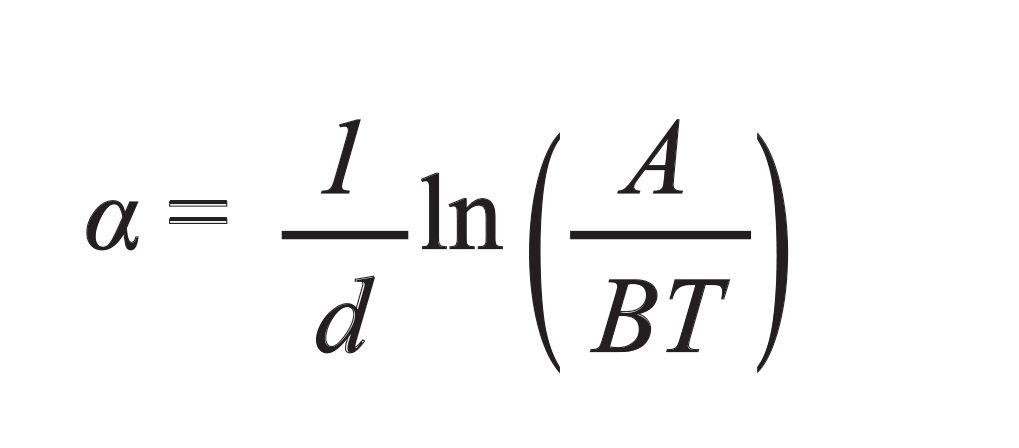
Figure 4: Absorption coefficient (α) calculated by equation 18 for GexSb40-xSe60 alloys with composition x = 12, 25, and 30 at.%.
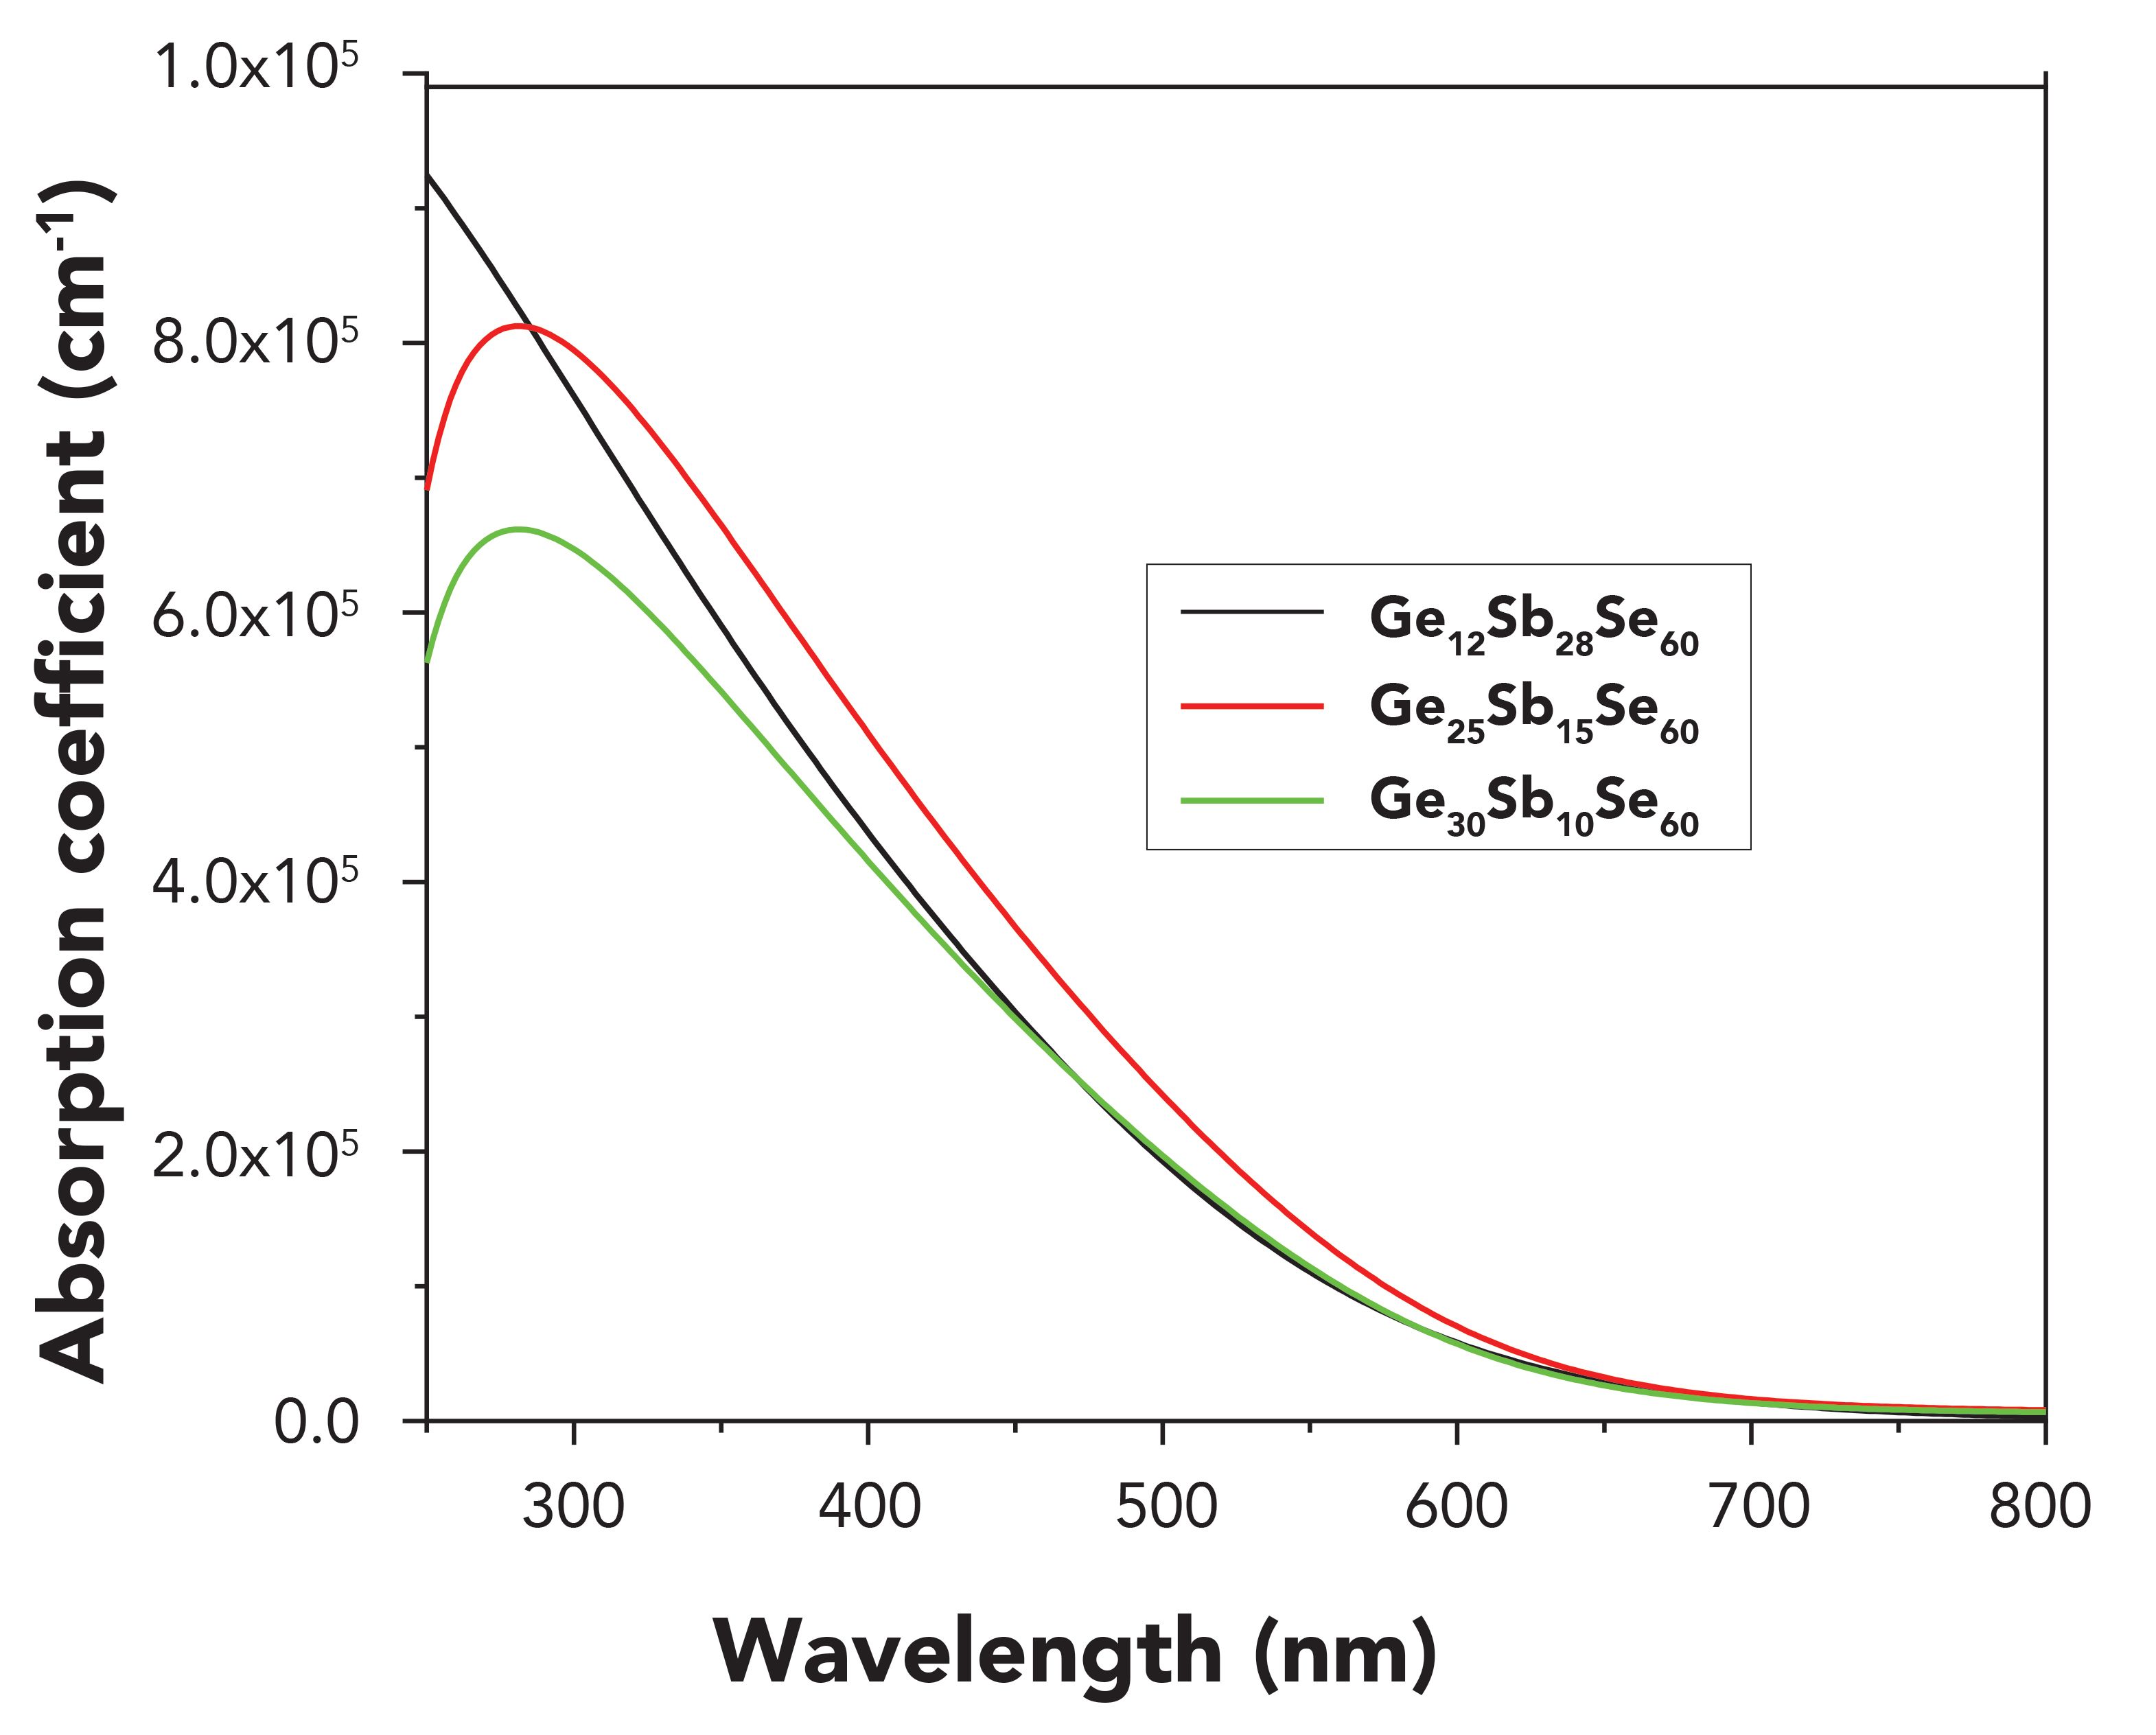
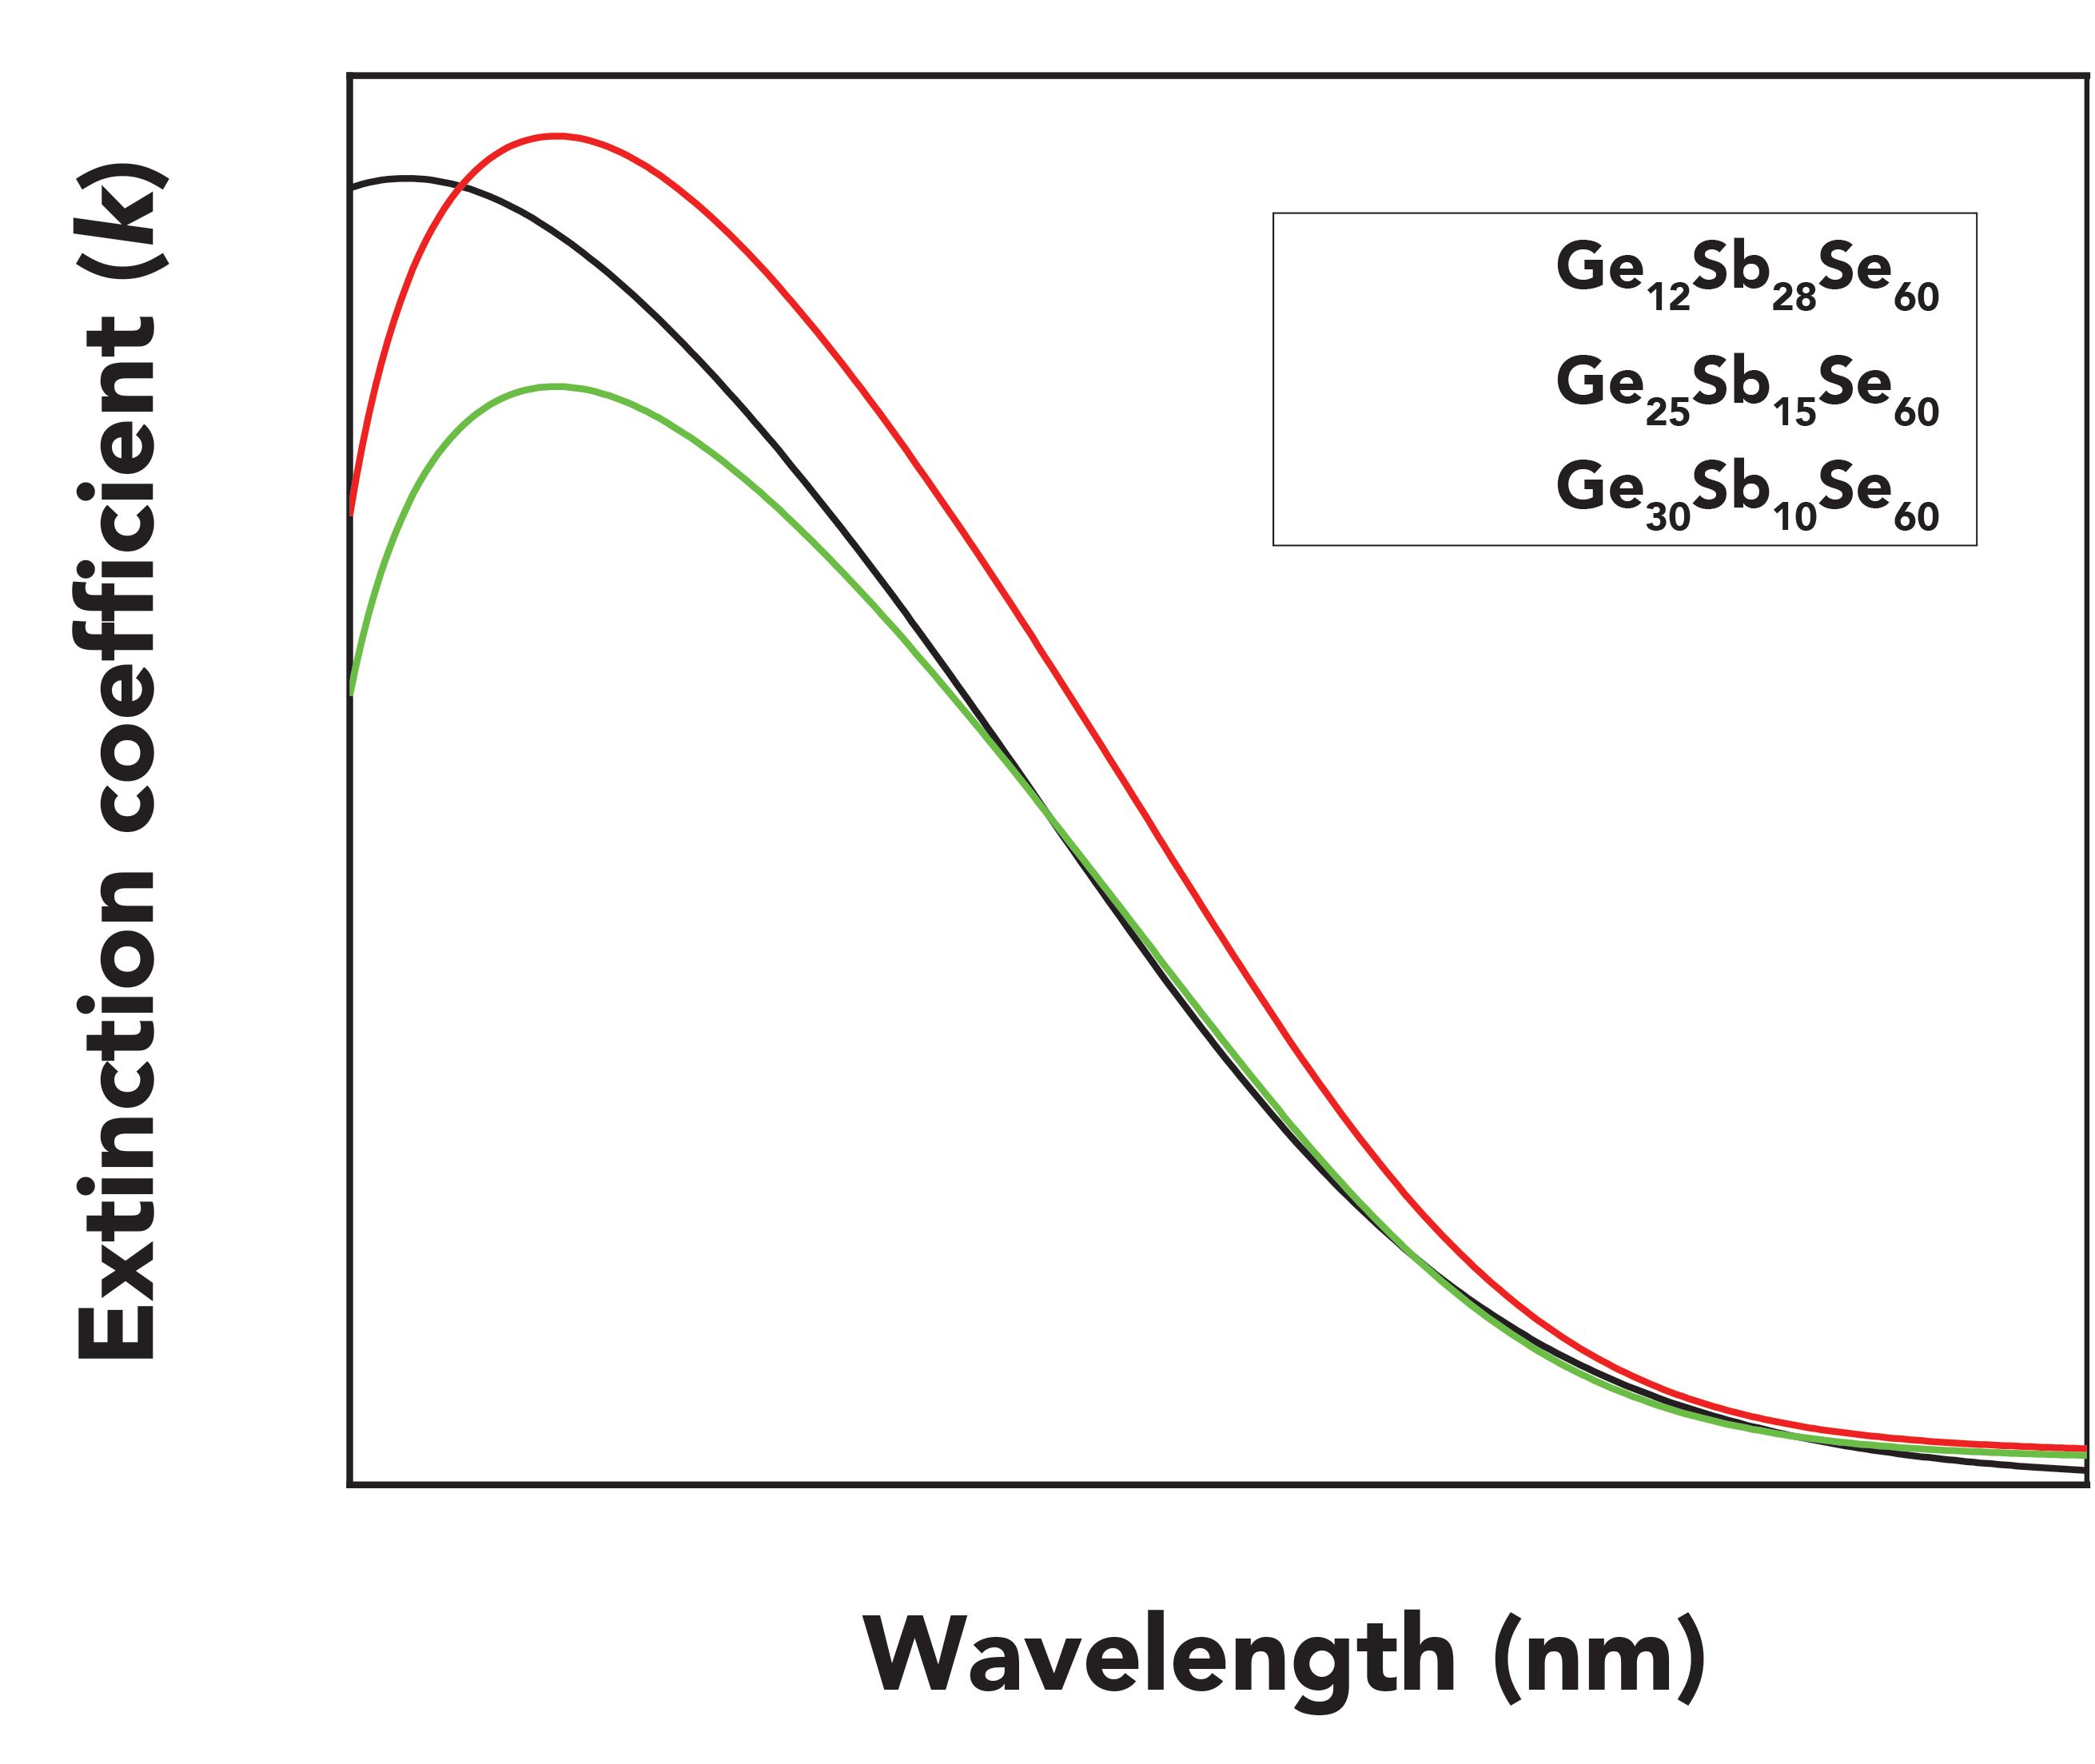
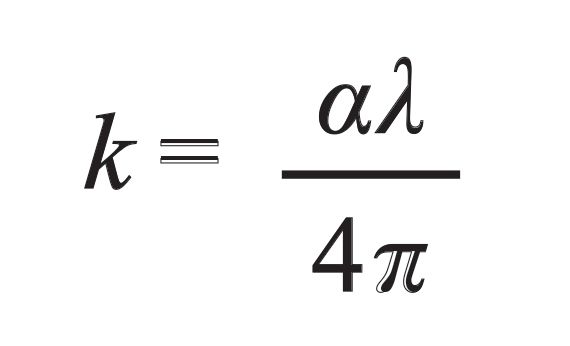
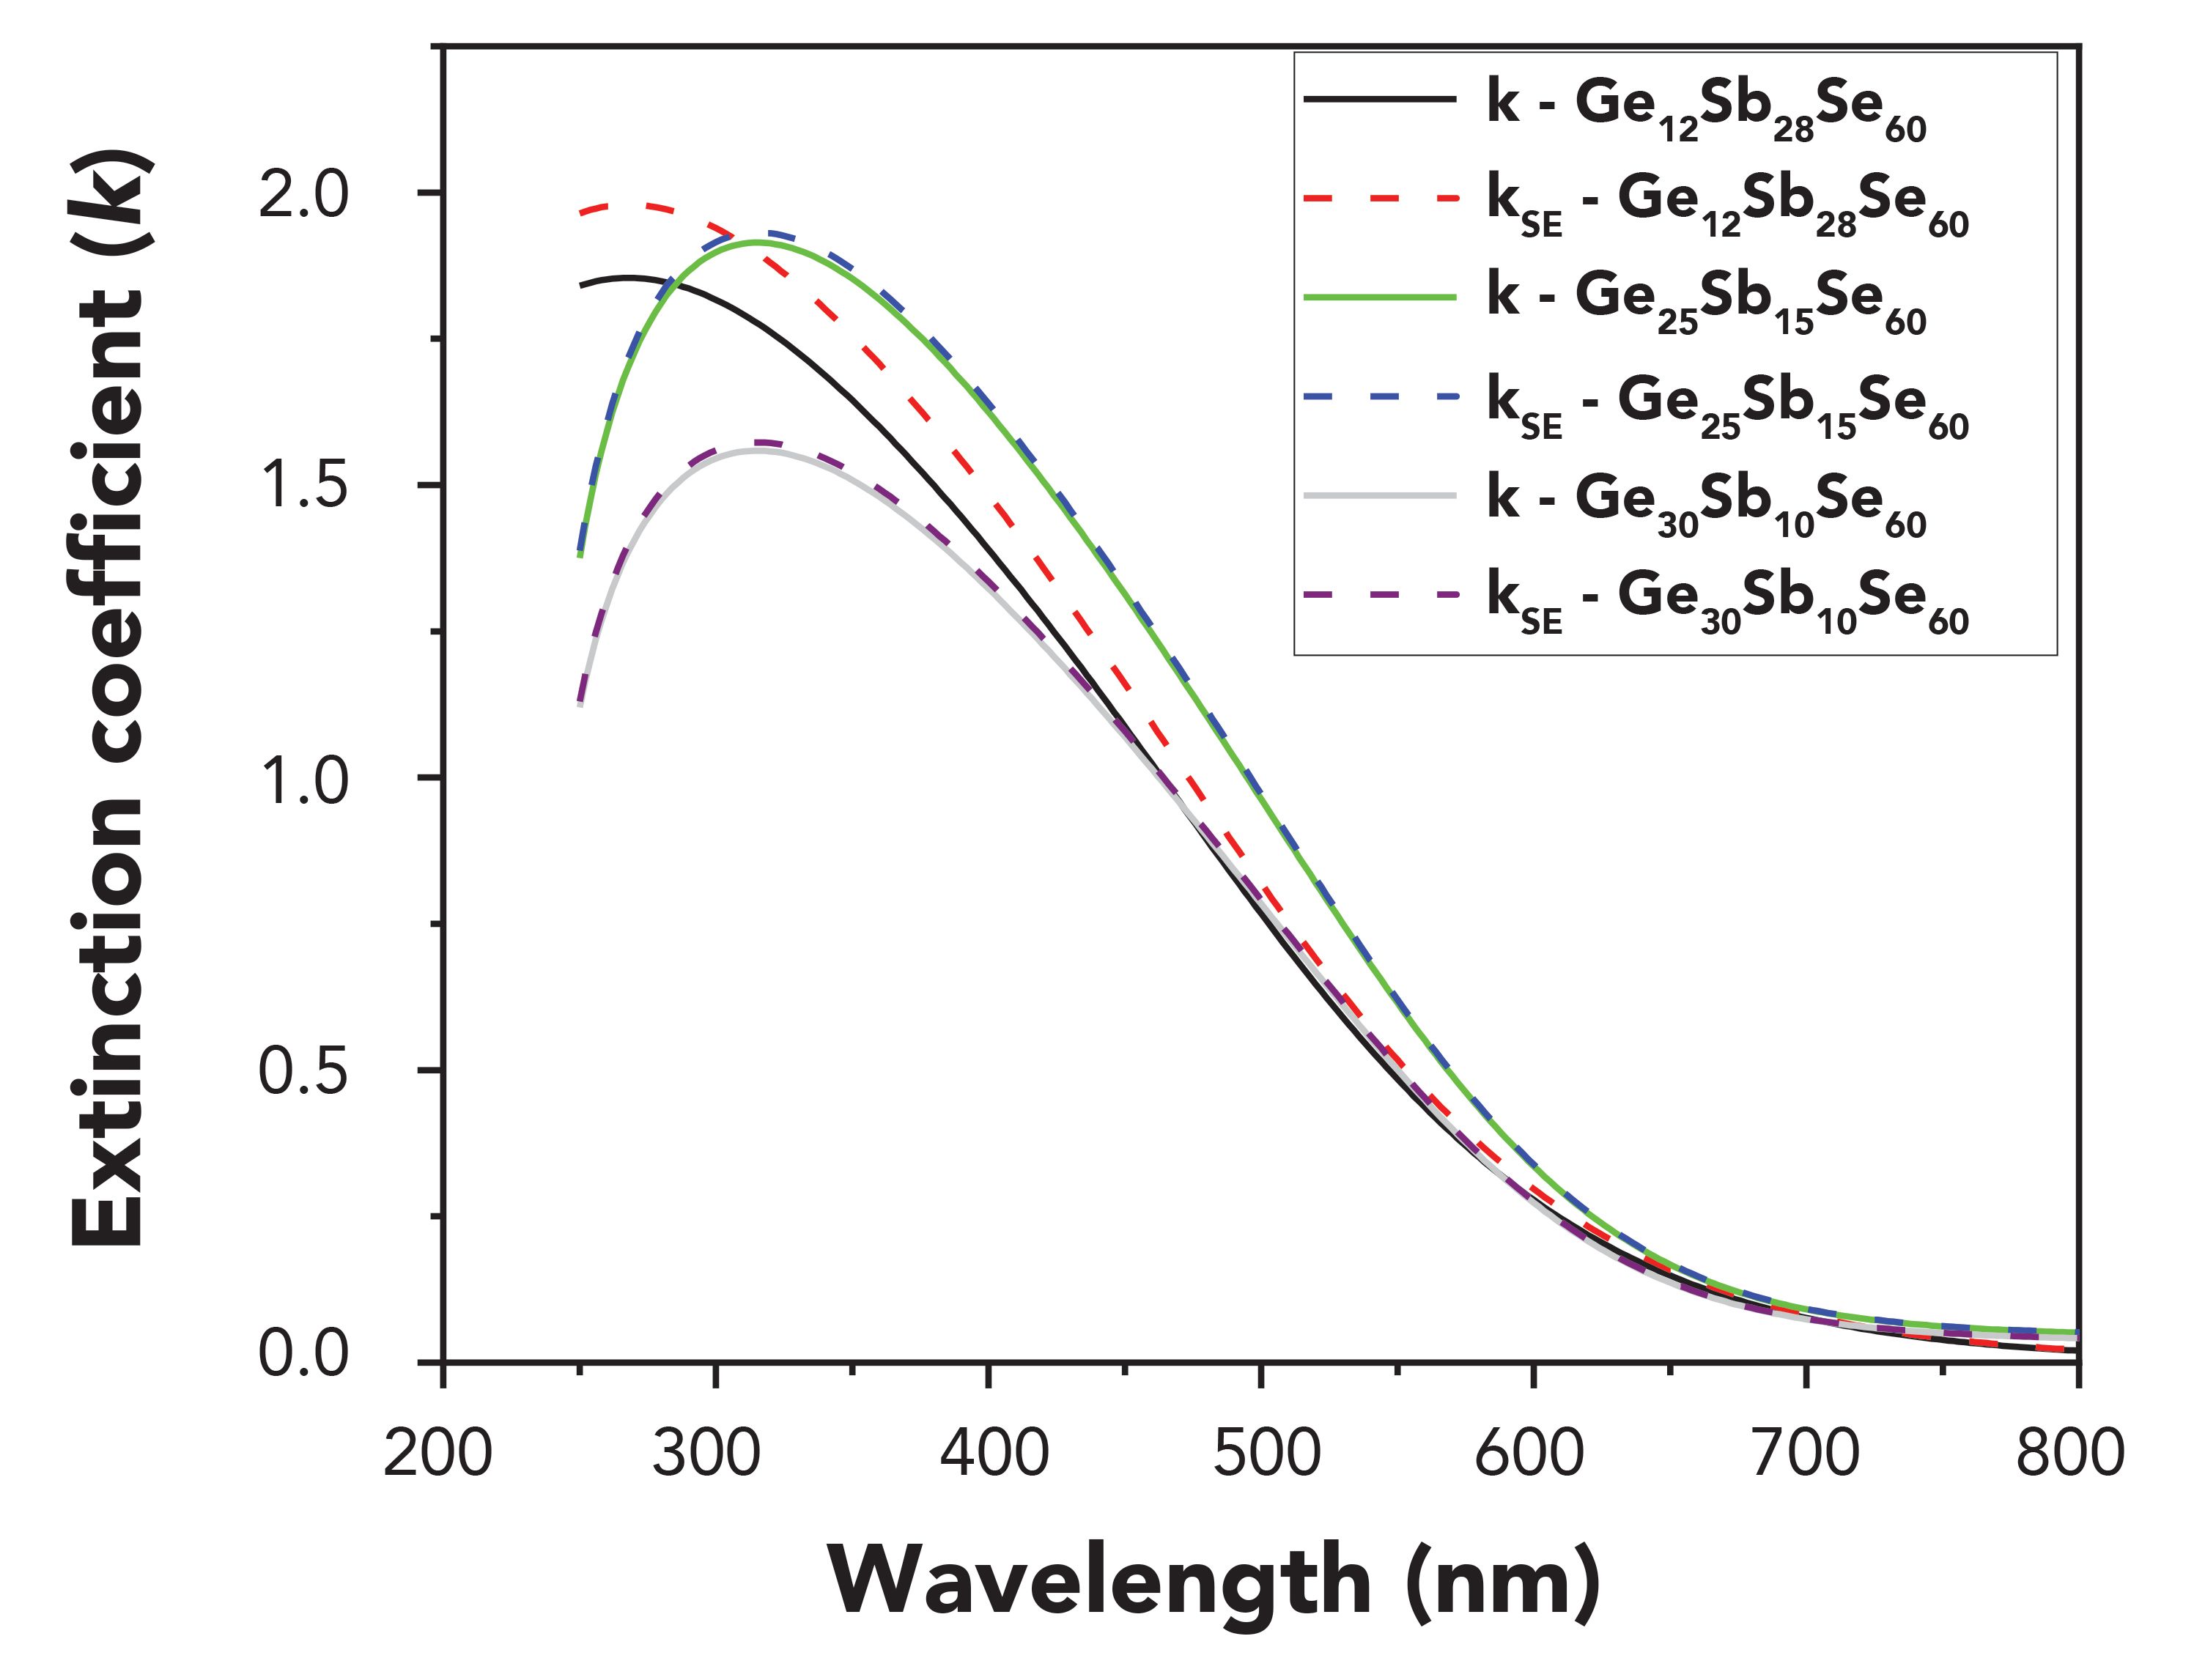
It is seen that the absorption coefficient decreases with an increase in germanium and a decrease in antimony content. To complete the calculation of the optical constants, the extinction coefficient k (Figure 5) is estimated from the values of the absorption coefficient α and wavelength λ, using the formula
Figure 5: Extinction coefficient (k) calculated by equation 19 for GexSb40-xSe60 alloys with composition x = 12, 25, and 30 at.%.
[19]
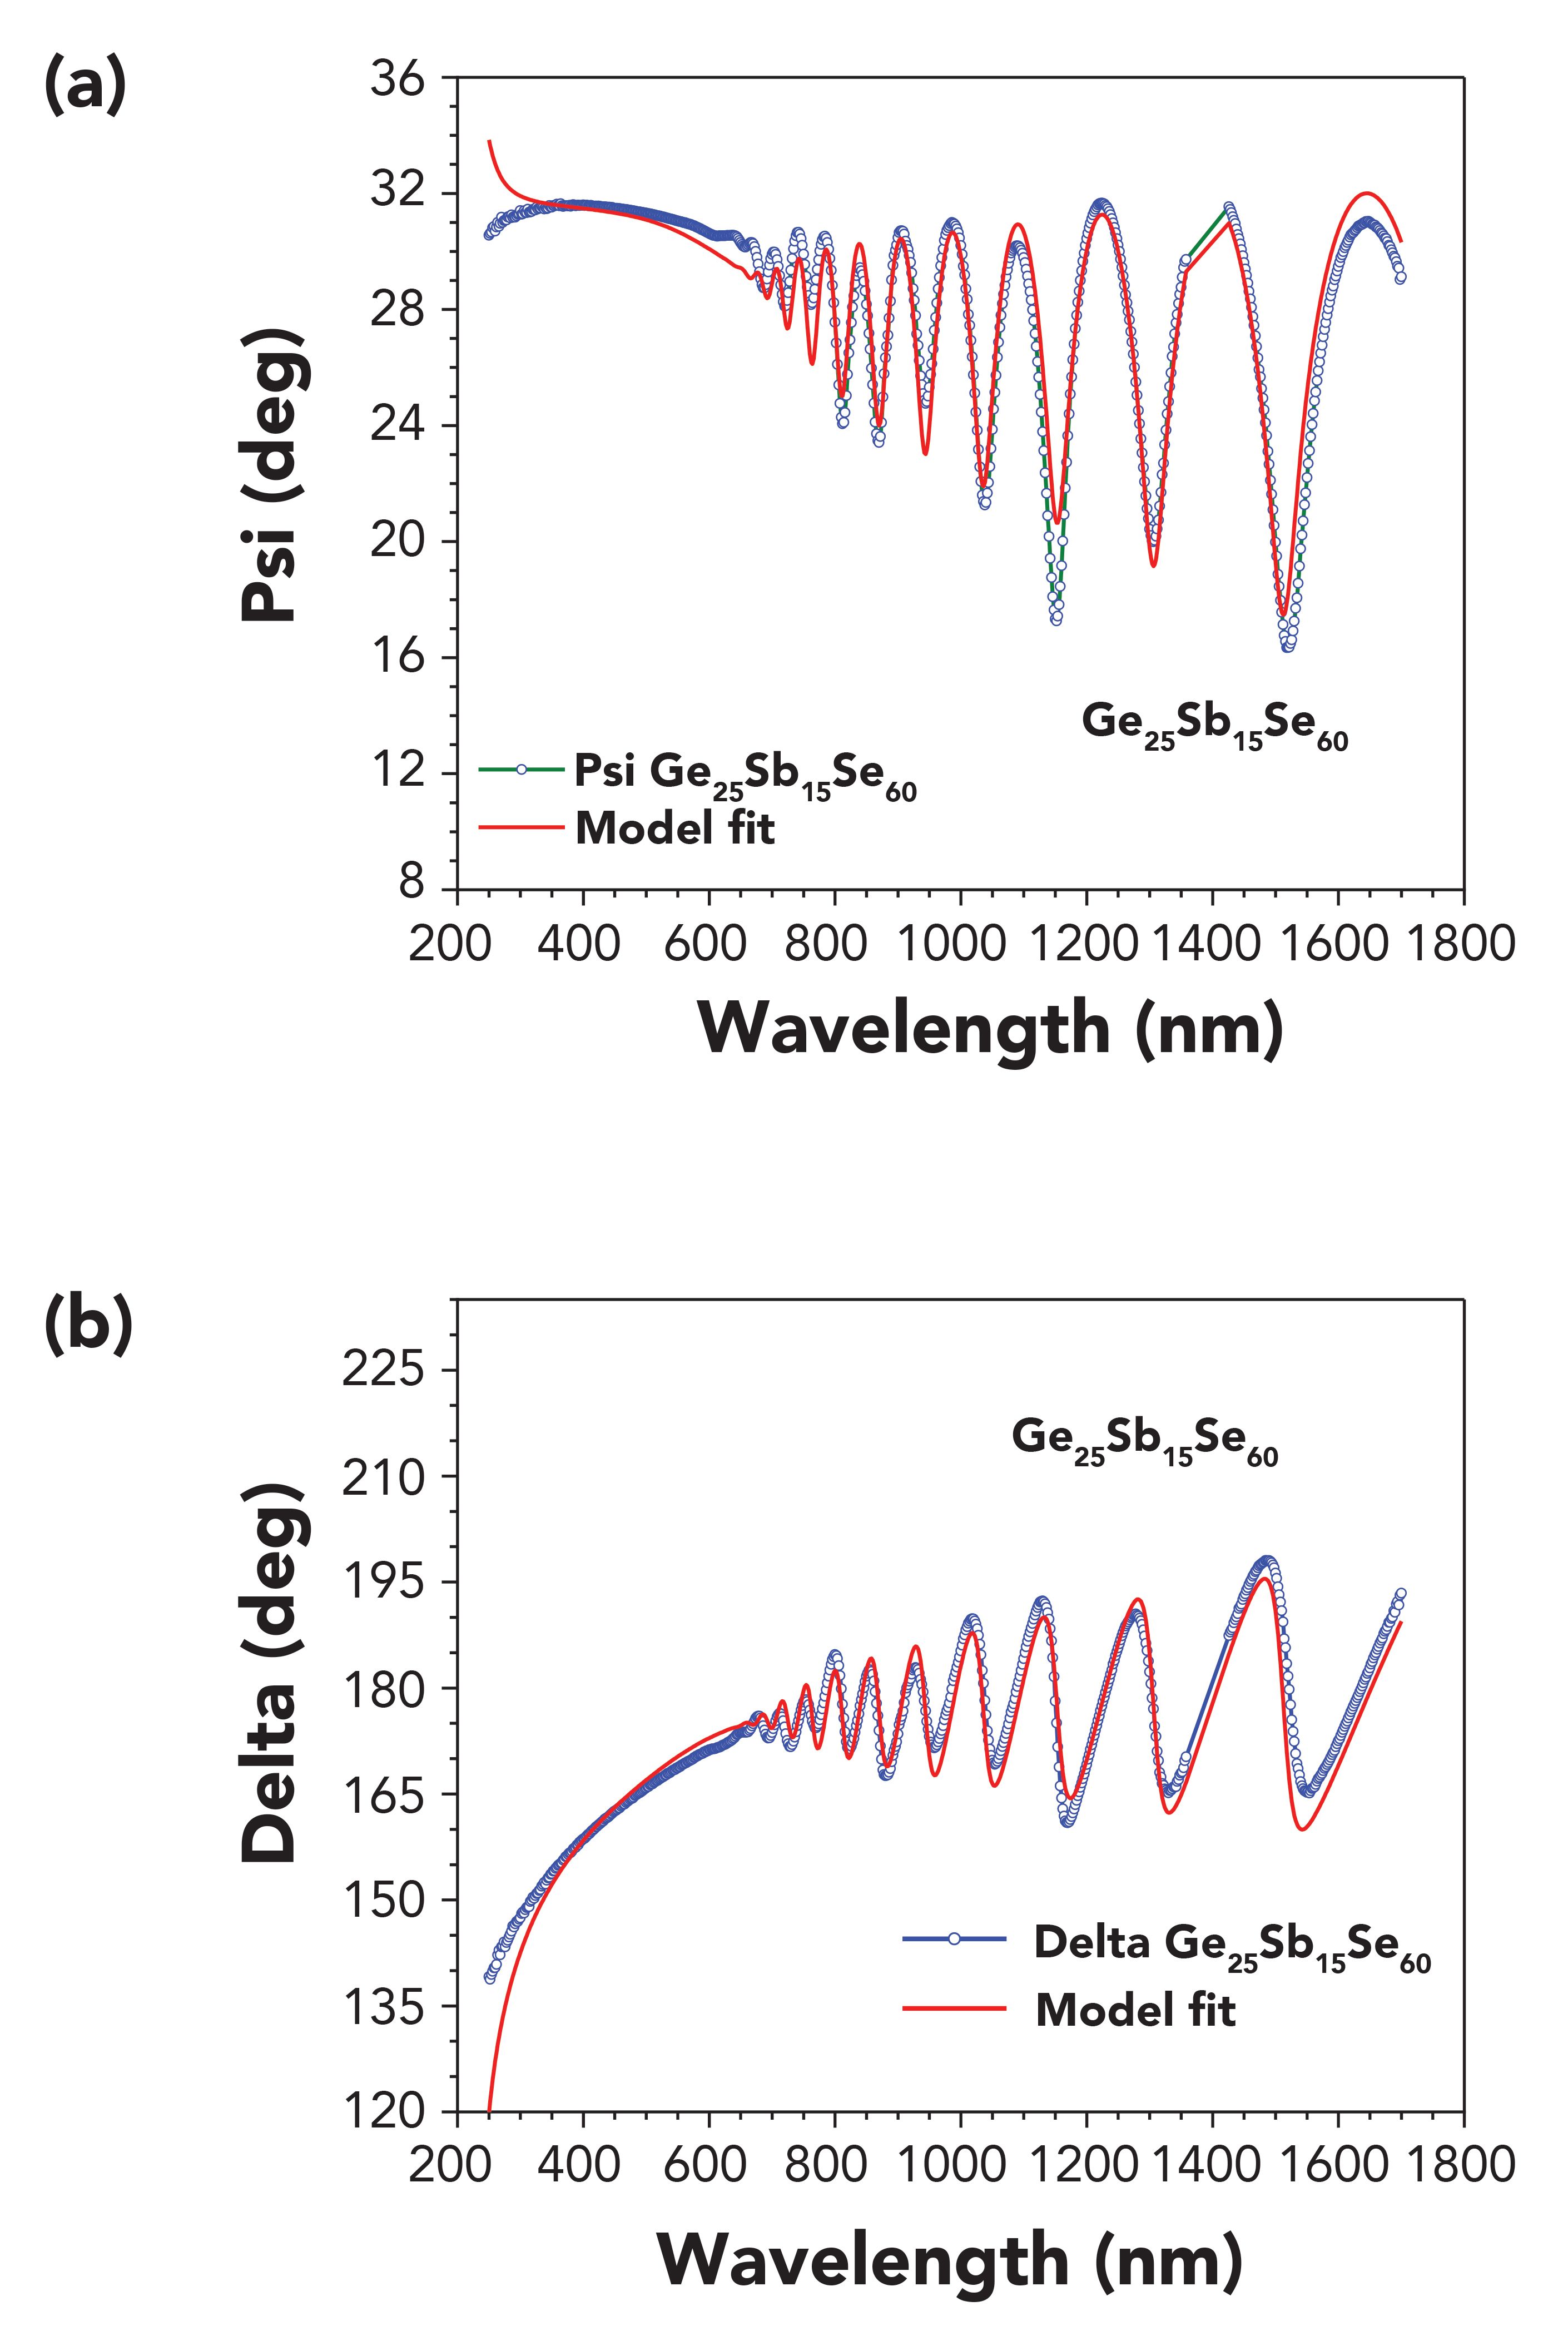
The influence of the glassy composition on the optical constants of the films was verified by the ellipsometry. In the UV-vis-NIR spectral range, the complementary SE measurements were performed, working in the wavelength region (193–1700) nm and at an 50o angle of incidence. The transmission spectra were obtained directly by the UV-vis-NIR measurements done at zero angles of incidence (Figure 6). In the SE data analysis, the wavelength λ function of the ellipsometric angles Ψ(λ) (Figure 7a) and ∆(λ) (Figure 7b) were simulated by considering the samples as a two-layer optical system (substrate/first layer [film]/second layer [surface roughness]) and using General Oscillator mathematical models of corresponding software (data acquisition and analysis supplied by J.A. Woollam Co. Inc.). In the SE fitting procedure measurements, the surface roughness was considered as a mixture of 50% material (film) and 50% voids (air), and was modeled by applying Bruggemann’s effective medium
approximation theory (29).
Figure 6: Spectra transmissions obtained by ellipsometry.
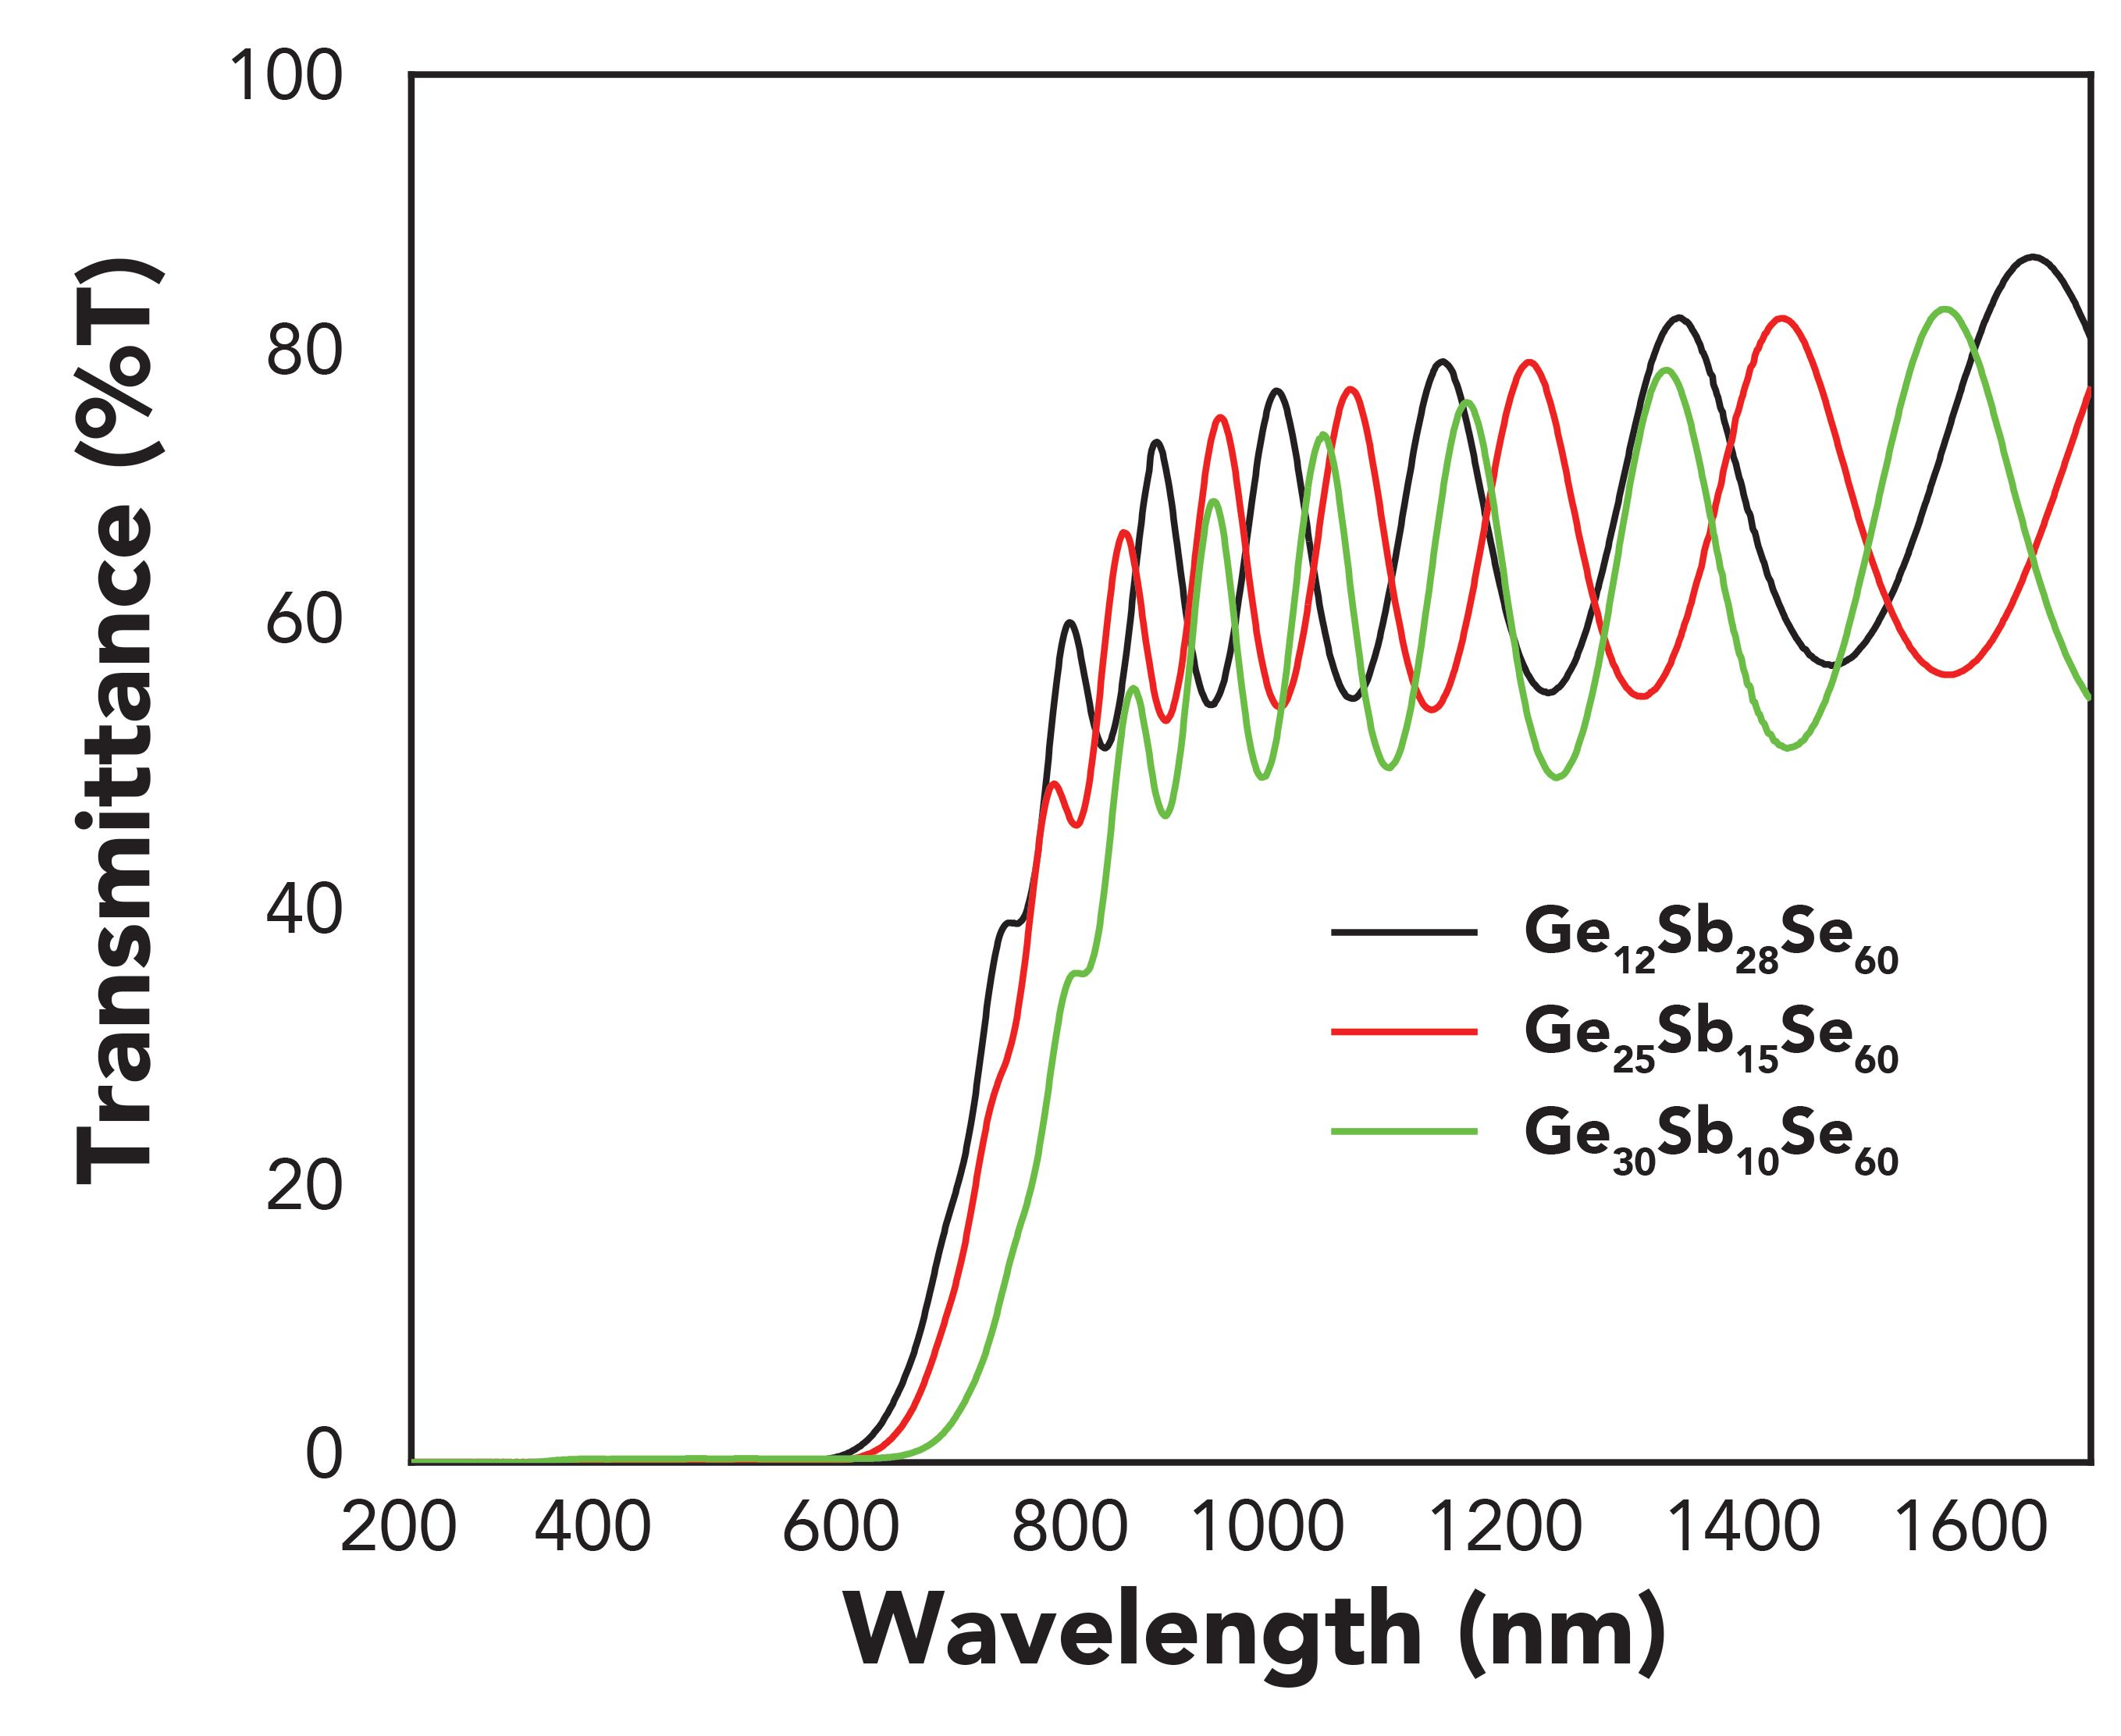
Figure 7: (a) Experimental (blue line) and fitted (red lines) Psi (Ψ) spectra for a Ge25Sb15Se60 thin film. (b) Experimental (blue line) and fitted (red lines) delta (Δ) spectra for the Ge25Sb15Se60.
From the spectroscopic ellipsometry data analysis the optical constants (refractive index n and extinction coefficient k) (Figure 8 and Figure 9) were calculated in the whole spectral range of 0.193 to 1700 nm. The results obtained by SE measurements are compared with the results calculated obtained by UV-vis-NIR spectroscopy. We can see the value for optical properties is the same, though a small increase is observed for optical properties determined by the ellipsometry
Figure 8: Refractive index n for GexSb40-xSe60 alloys with composition x = 12, 25, and 30 at.% obtained by both method spectroscopy.
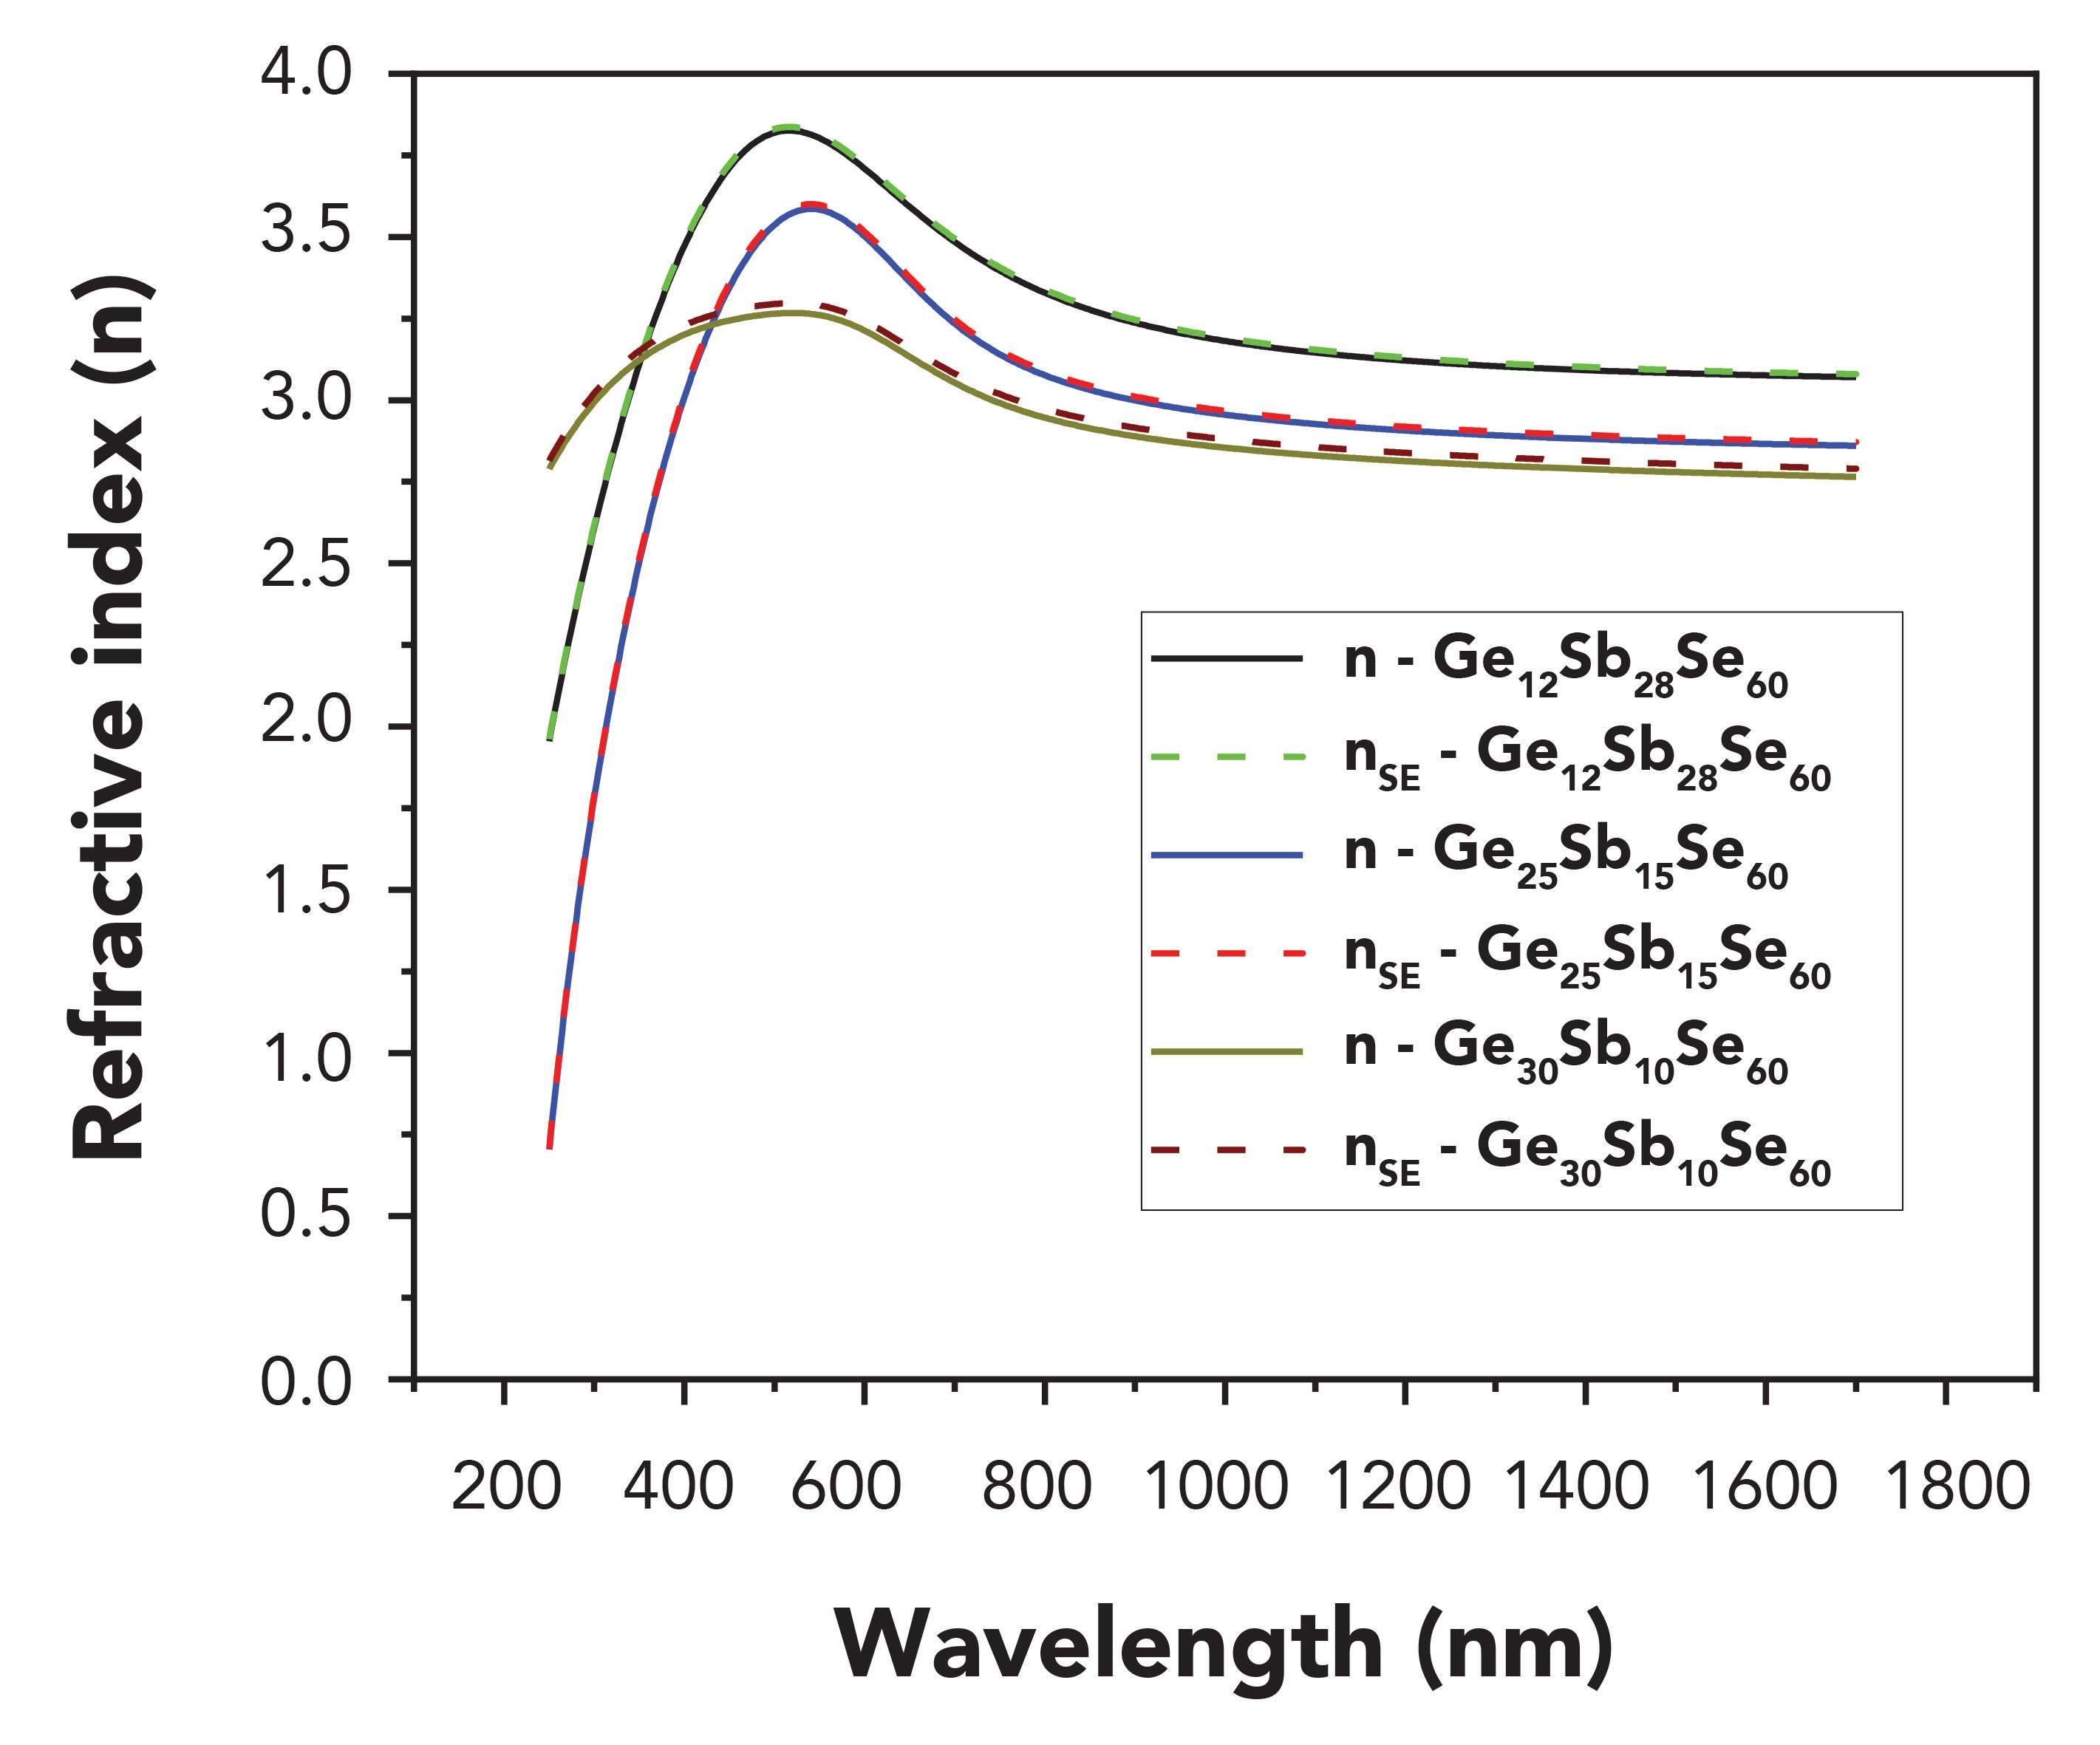
Figure 9: Extinction coefficient (k) for GexSb40-xSe60 alloys with composition x = 12, 25, and 30 at.% obtained by both method spectroscopy.
Wemple-DiDomenico (W-D) (28,30) is the model of dispersion of refractive index, and can be written as
[20]
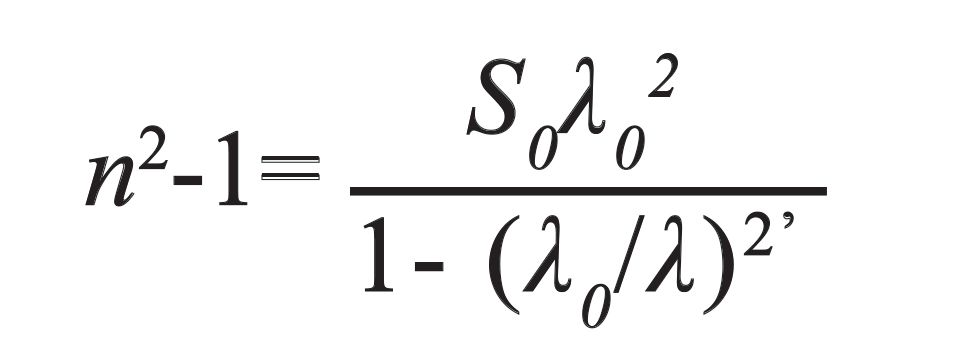
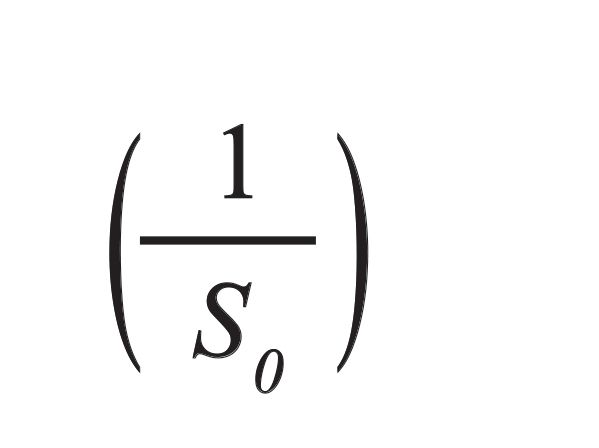
where λ is the wavelength of the incident radiation, S0is the average oscillator strength, and λ0 is an average oscillator wavelength. The curves of (n2 -1)-1 against (1/λ2) (Figure 10) were fitted into straight lines following Sellmeier’s dispersion formula (27–28), and the graphs were obtained to confirm formula. The values of S0 and λ0are estimated from the slope
and the infinite wavelength intercept
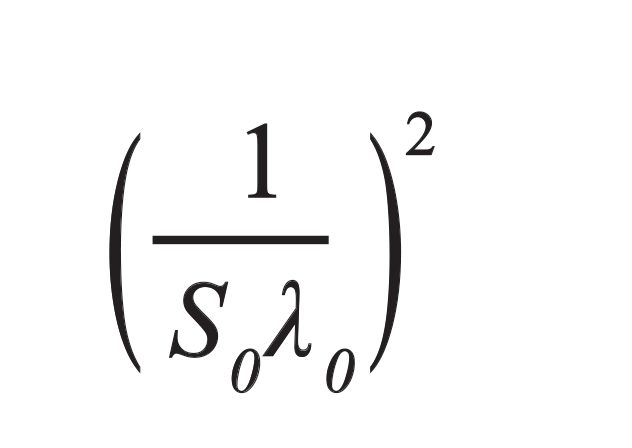
Figure 10: Tabulation of (n2-1)-1 versus (1/λ2) curves for samples GexSb40-xSe60 alloys with composition x = 12, 25, and 30 at.%.
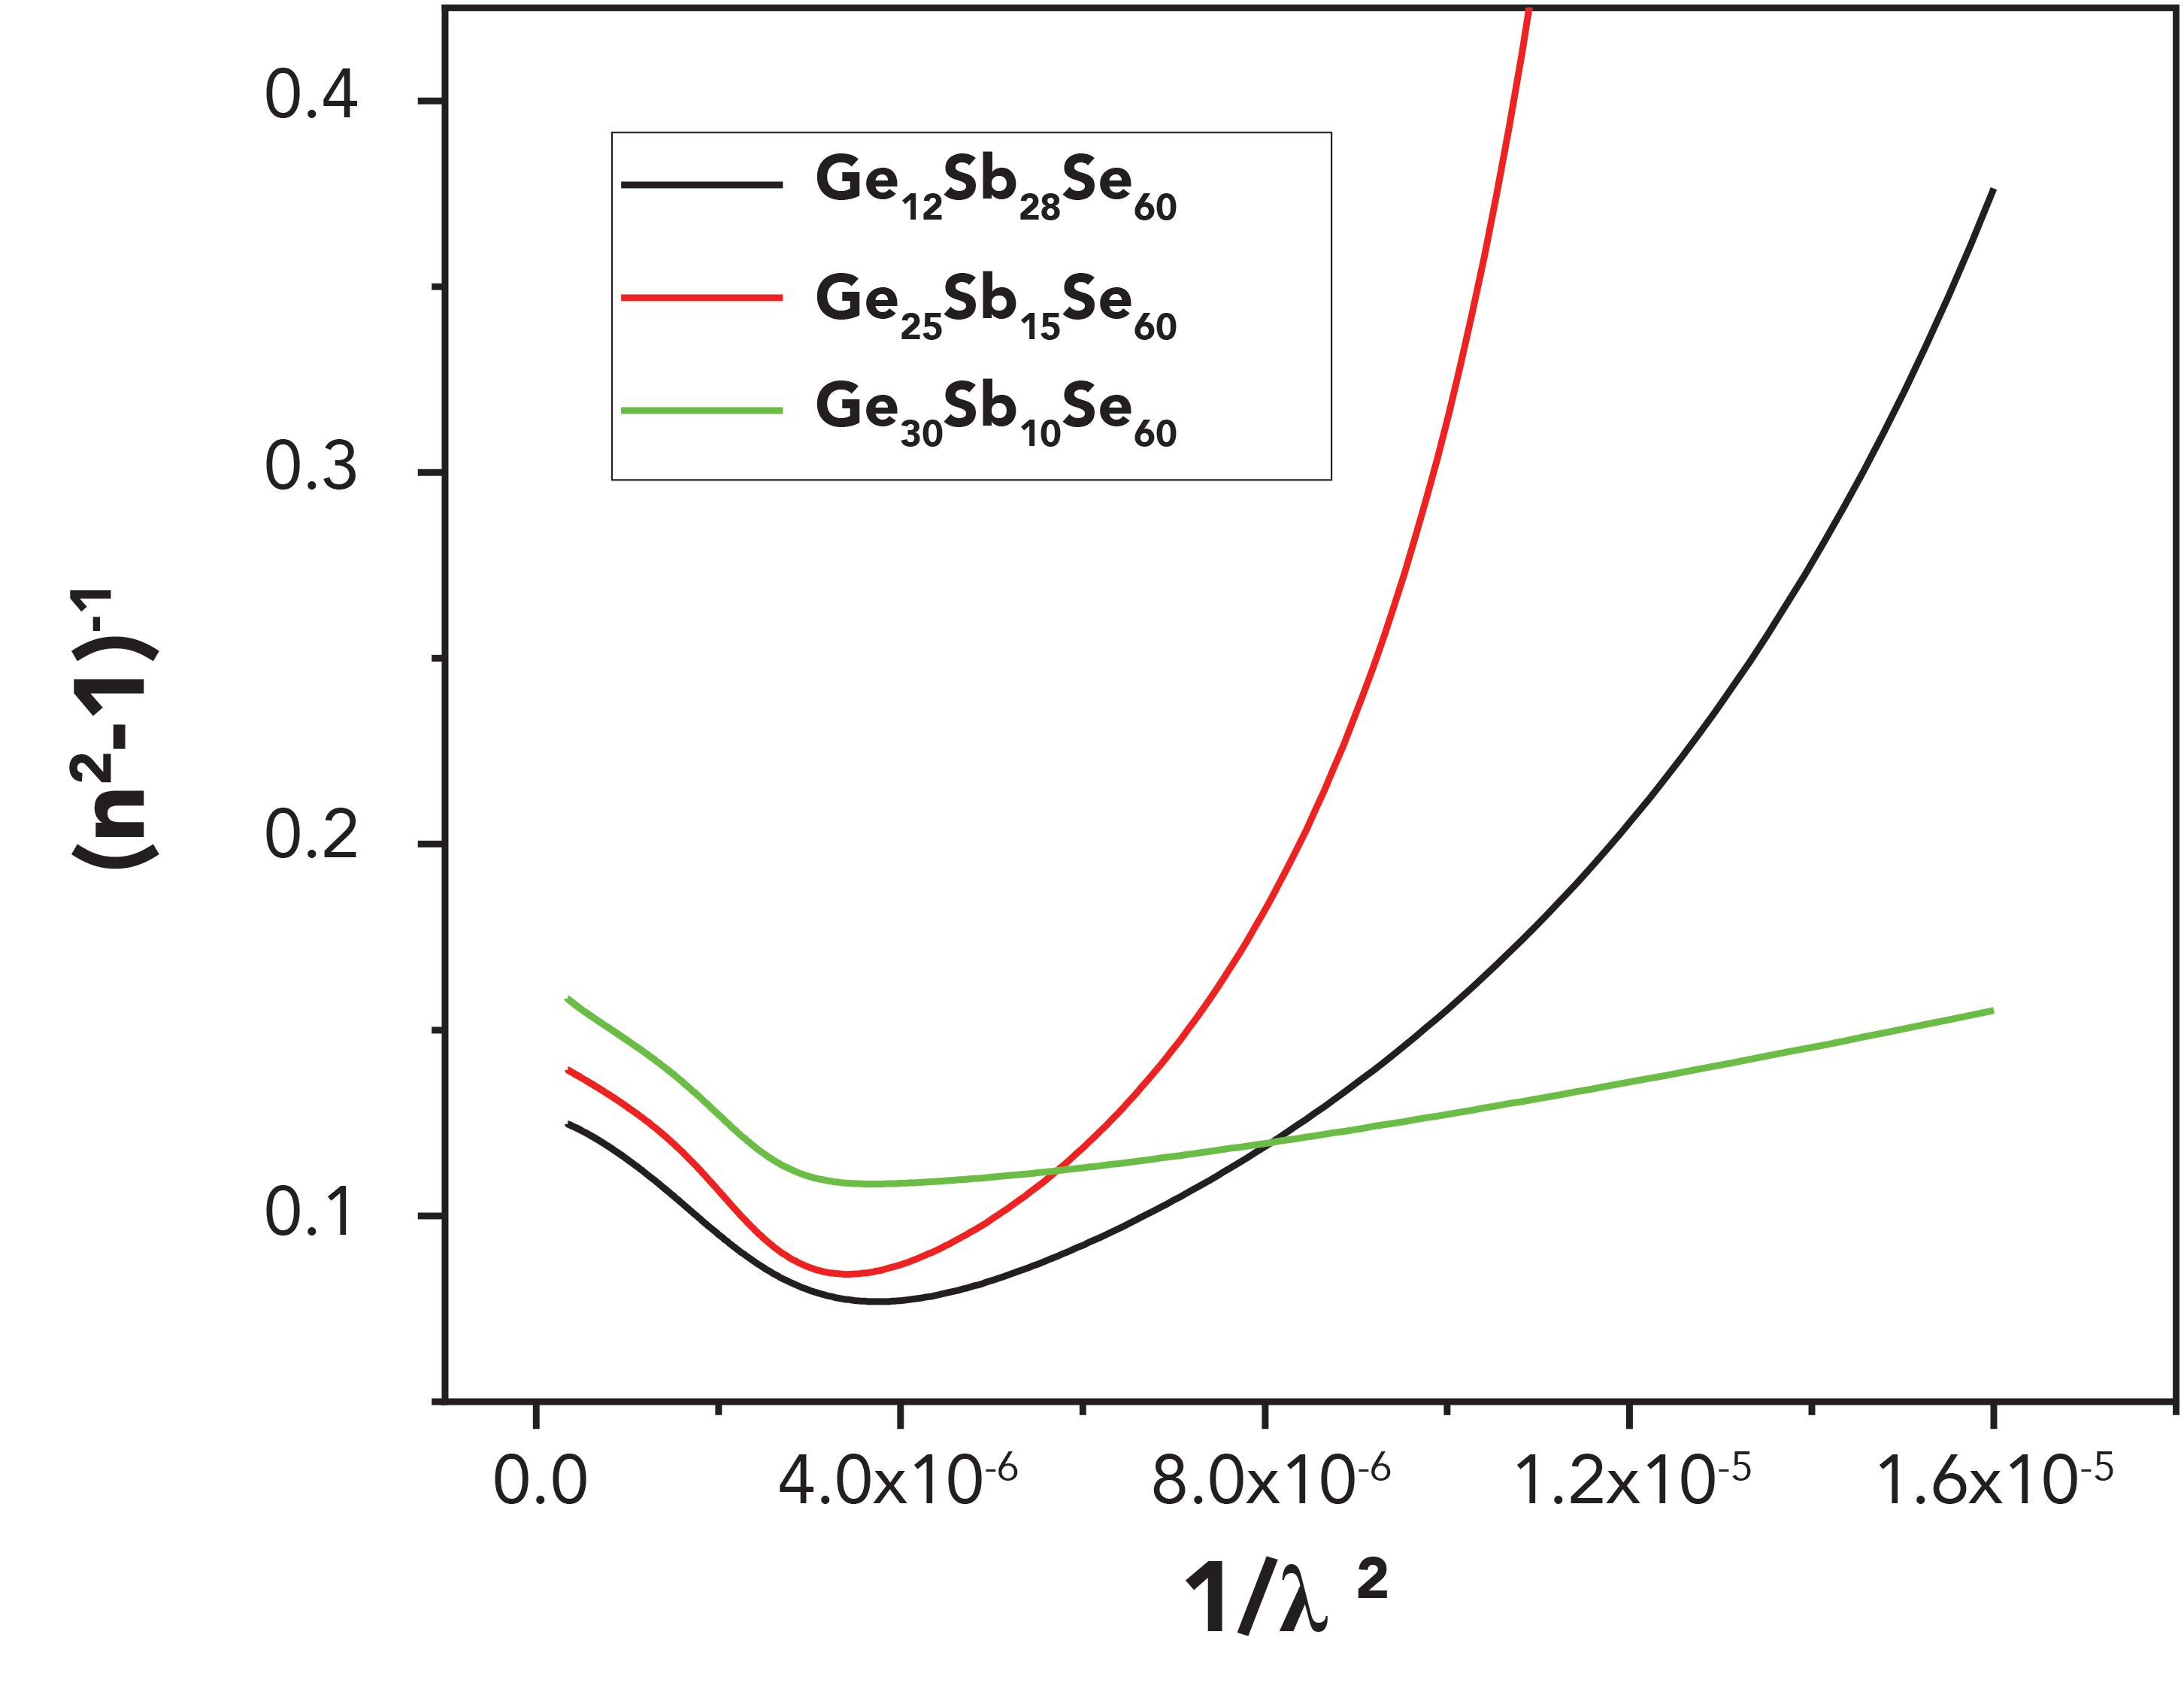
According to the Wemple-DiDomenico single-oscillator model, the dispersion energy increase in the sample GexSb40-xSe60 corresponds to a composition of x = 12, 25, and 30 at.%
Determination of High Frequency Dielectric Constant
Two procedures are applied to obtain data for the refractive index n with the high frequency dielectric constant (29). The first procedure describes the contribution of the free carriers and the lattice vibration modes of the dispersion. The second procedure is based on the dispersion arising from the bound carriers in an empty lattice. Both models are used for the estimation of n for the high frequency dielectric constant ε∞.
The high frequency dielectric constant (28, 30,31) can be obtained by equation 21:
[21]

where
[22]
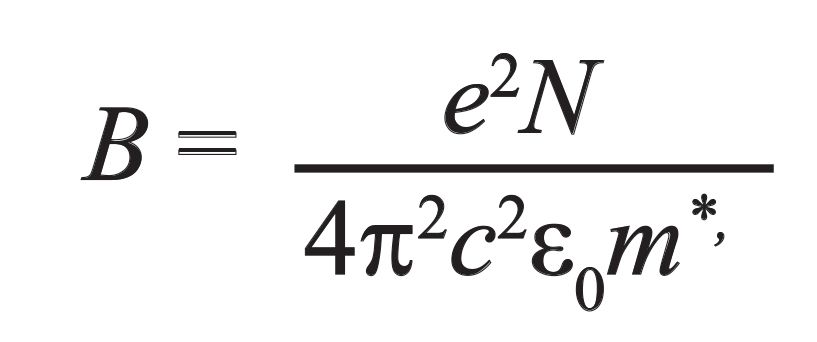
where ε1 is the real part of the dielectric constant, ε∞ is the high frequency dielectric constant according to the first procedure, λ is the wavelength, the free charge carrier concentration, ε0, is the permittivity of free space (8.854*10-12 F / m), m* is the effective mass of the charge carrier, and с is the velocity of light. The real part of dielectric constants ε1 = n2 was calculated at different values of λ (Figure 11). Extrapolating the linear part of this dependence to zero wavelength gives the value of ε∞.
Figure 11: Plots of ɛ1 as a function of λ2 for sample GexSb40-xSe60 alloys with composition x = 12, 25, and 30 at.%.
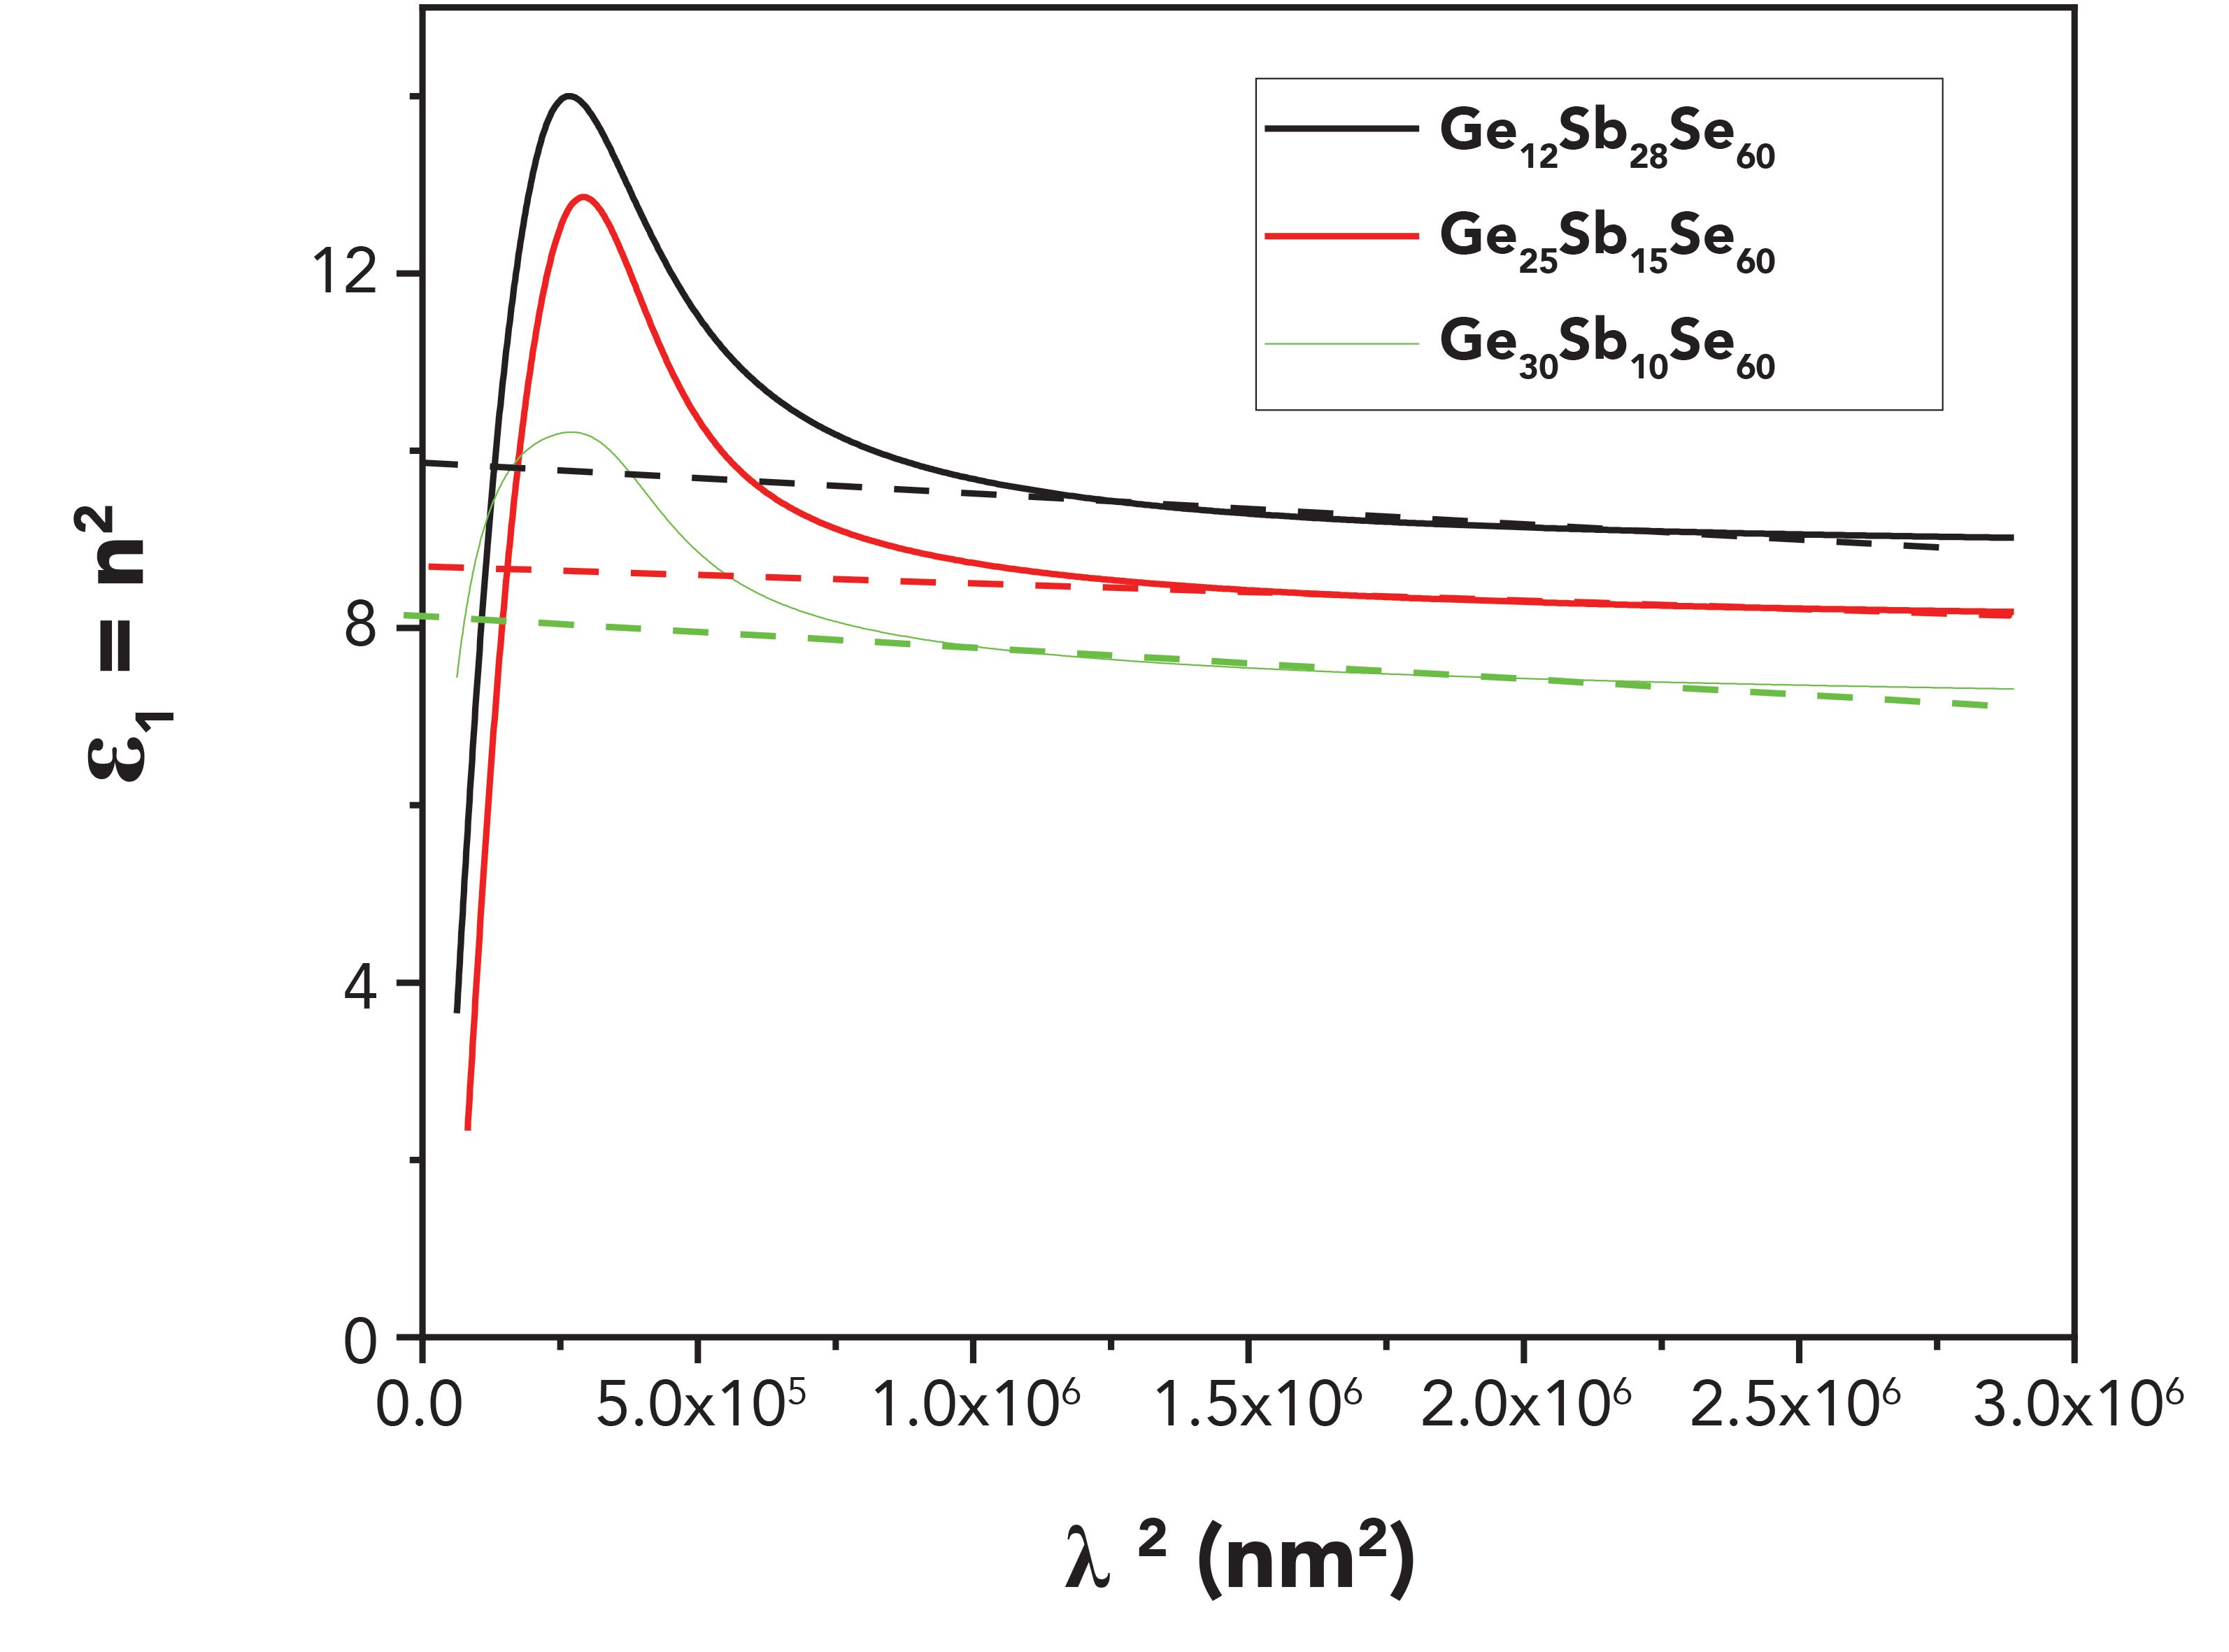
The values of ε∞ are given in Table II for sample GexSb40-xSe60 alloys with composition x = 12, 25, and 30 at.%.
The dielectric constant of material could be calculated using the dispersion relation of the incident photon in the second procedure. The Moss model (31) for data corresponding to the wavelength range lying below the absorption edge of the material is to be used. The high frequency dielectric constant can be calculated by applying the following simple classical dispersion relation (28,30)
[23]
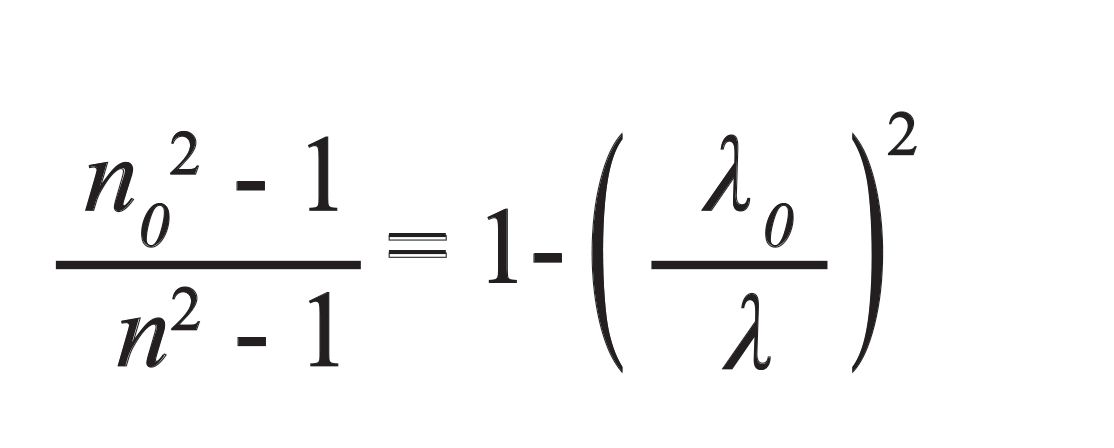
where n0is the refractive index at infinite wavelength λ0, n the refractive index and λ the wavelength of the incident photon. Plotting (n2 -1)-1 against 1/λ (Figure 10) showed a linear part. The intersection (n2 - 1)-1 axis is (n02 - 1)-1 and n02 at λ0give ε∞. The values for sample GexSb40-xSe60 alloys with composition x = 12, 25, and 30 at.% are given in Table II. From equation 20, we can calculate S0:
[24]
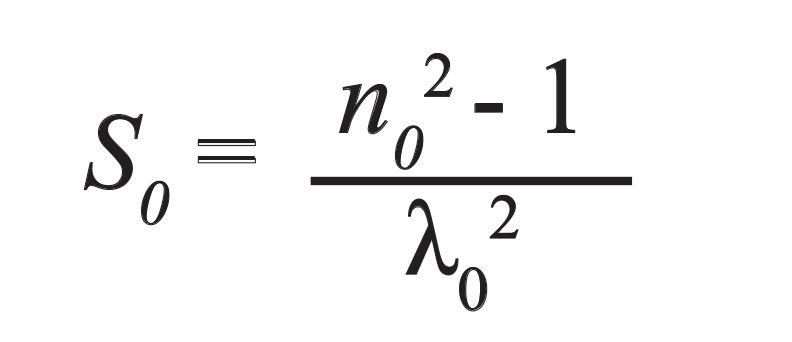
where S0 is the average oscillator strength.
The dielectric constants ε1and ε2are determined from the analytical dielectric complex function
ε = ε1 + iε2
where
ε1and ε2
are calculated from the optical properties:
[25]

[26]

where ε1 is the real part, ε2 is the imaginary part of the dielectric constant, ε∞ is the high frequency dielectric constant, ωp is the plasma frequency, and τ is the optical relaxation time, and can be calculated by equation 27:
[27]
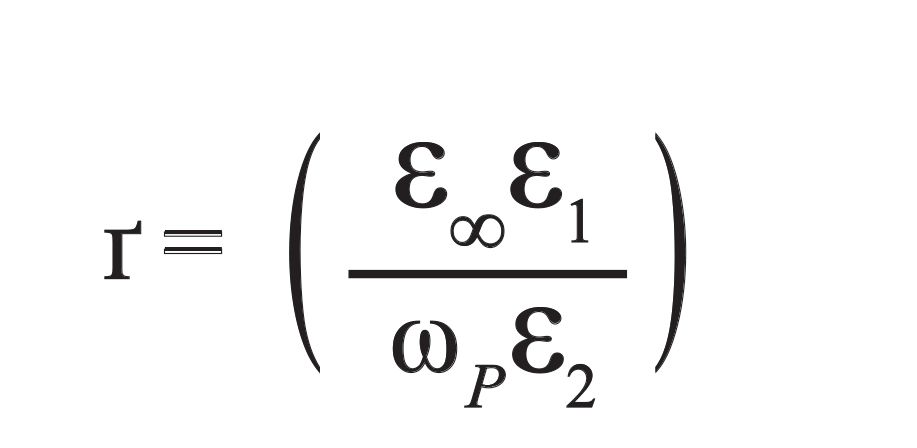
and k is the extinction coefficient. The values for ε1and ε2are present in Figure 12 and Figure 13.
Figure 12: Plots of ɛ1 as a function of λ for sample GexSb40-xSe60 alloys with composition x = 12, 25 and 30 at.%.
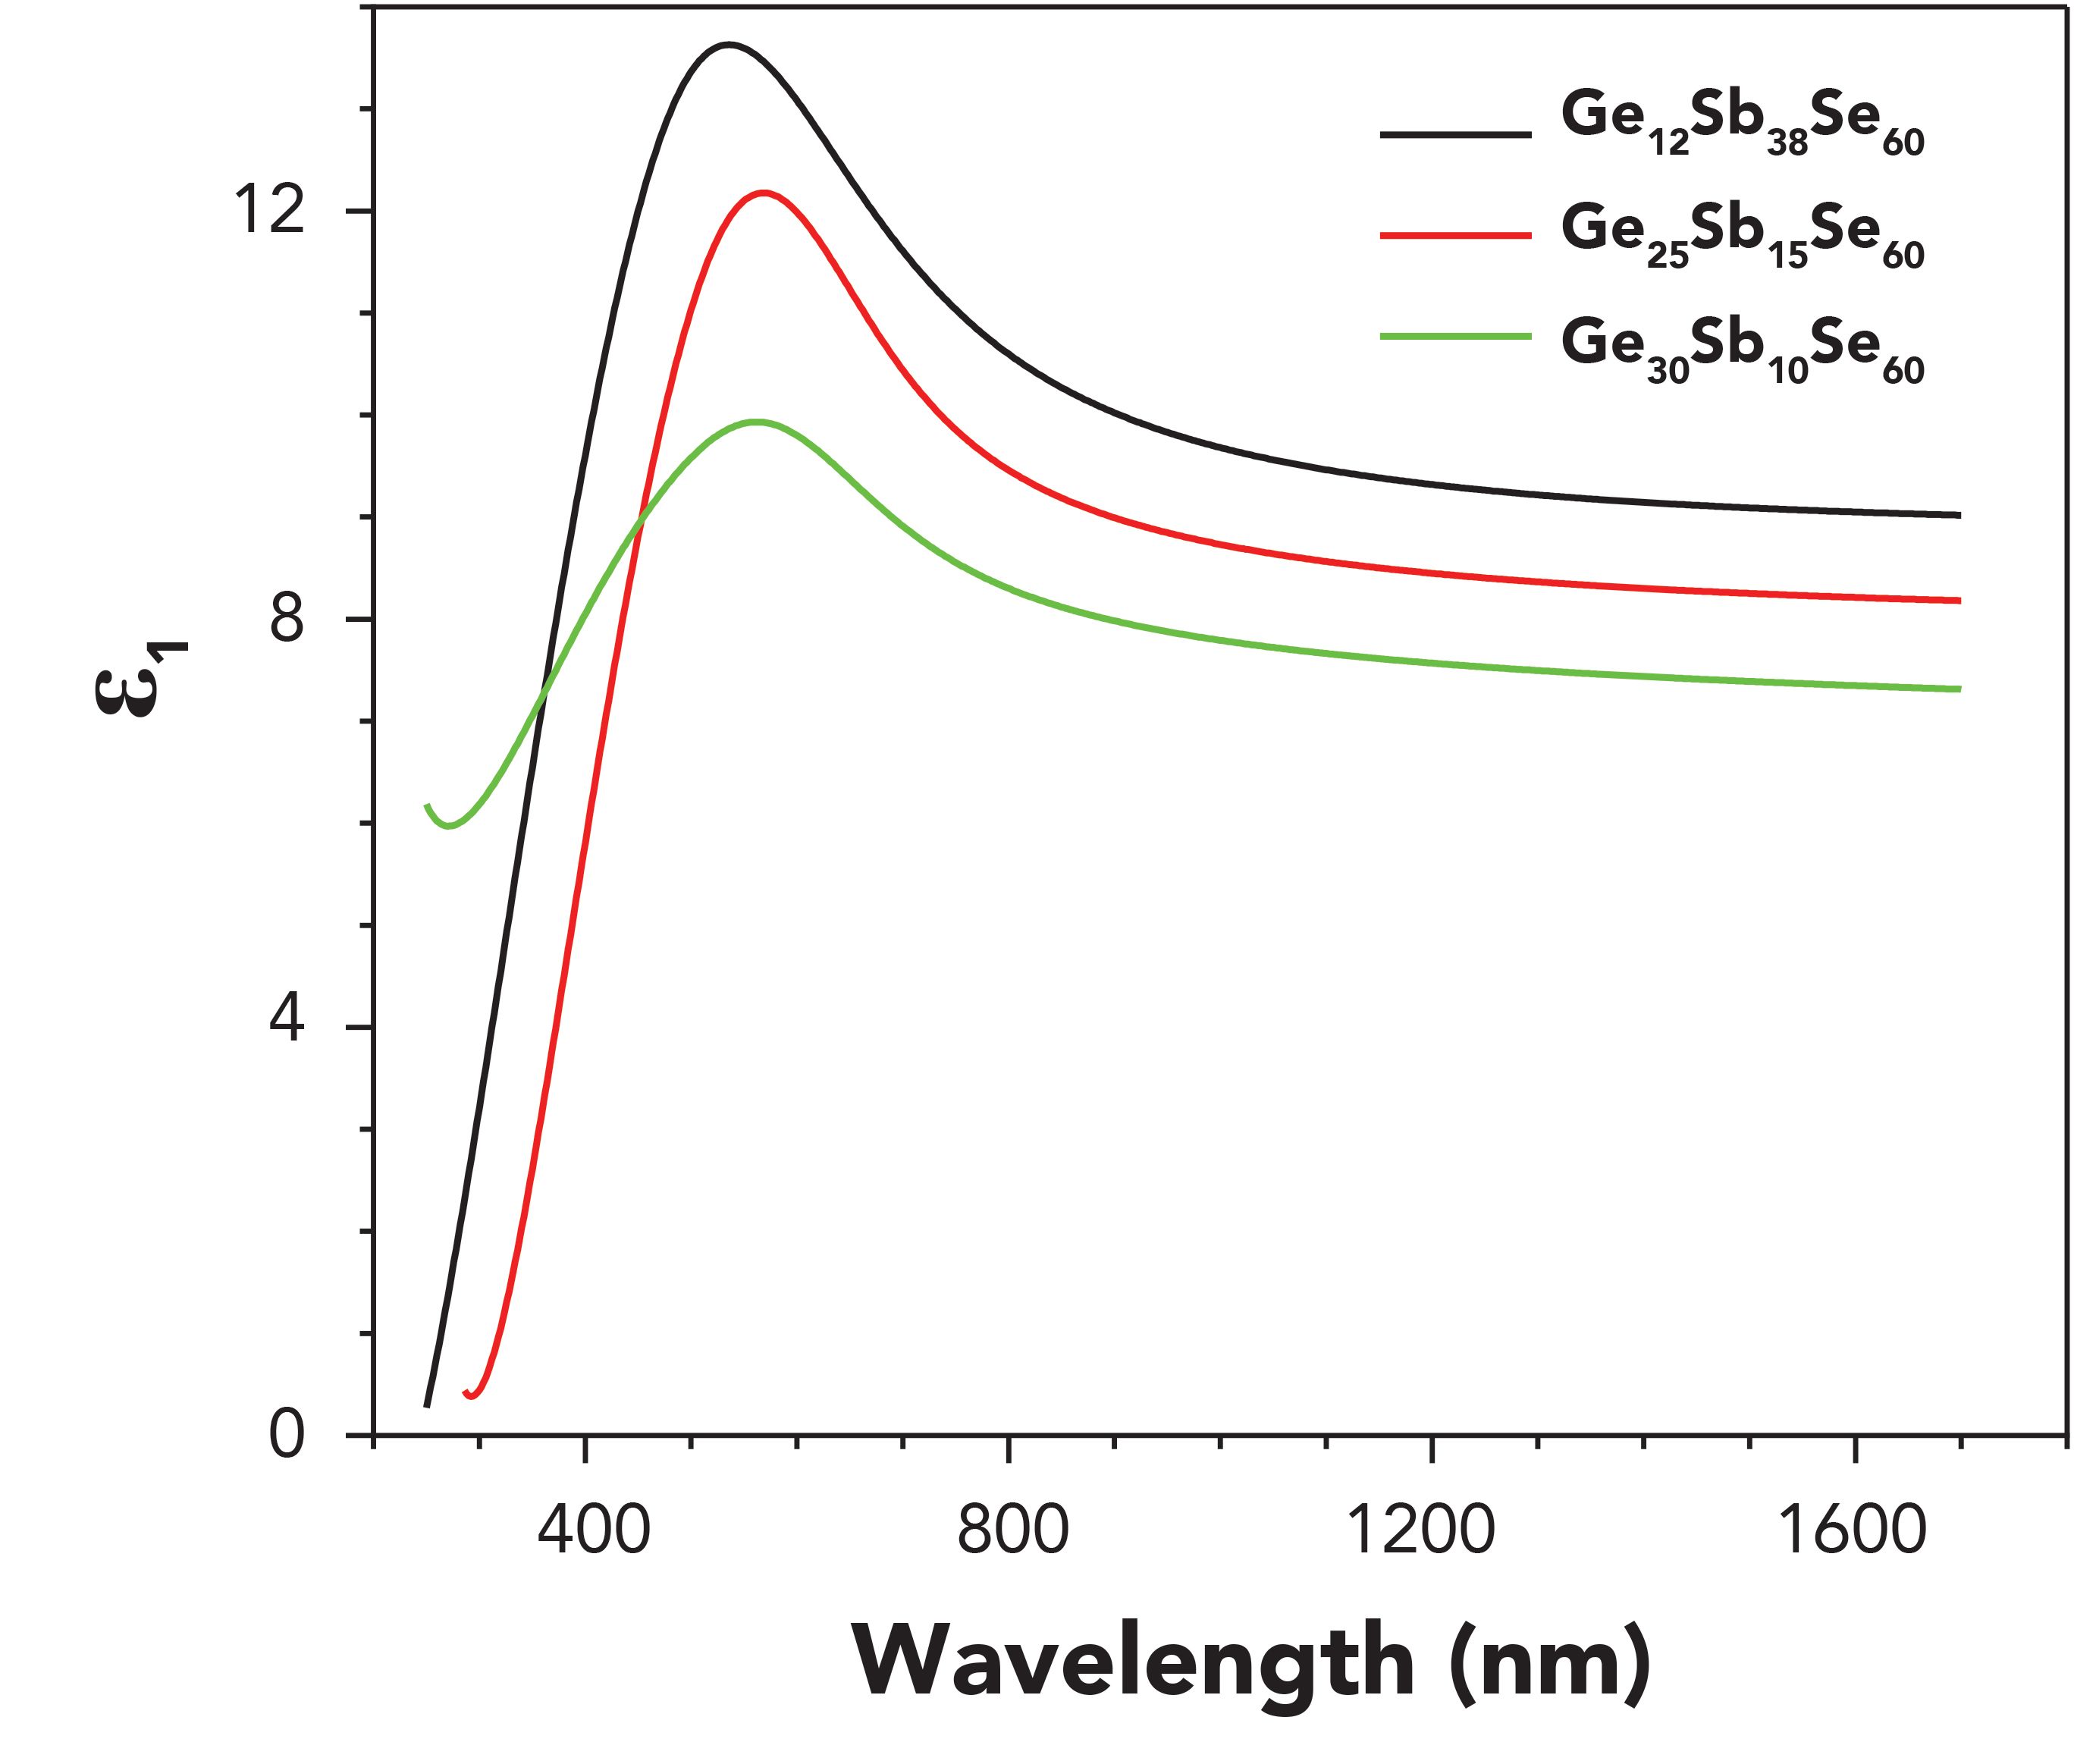
Figure 13: Plots of ɛ2 as a function of λ for samples for samples GexSb40-xSe60 alloys with composition x = 12, 25 and 30 at.%.
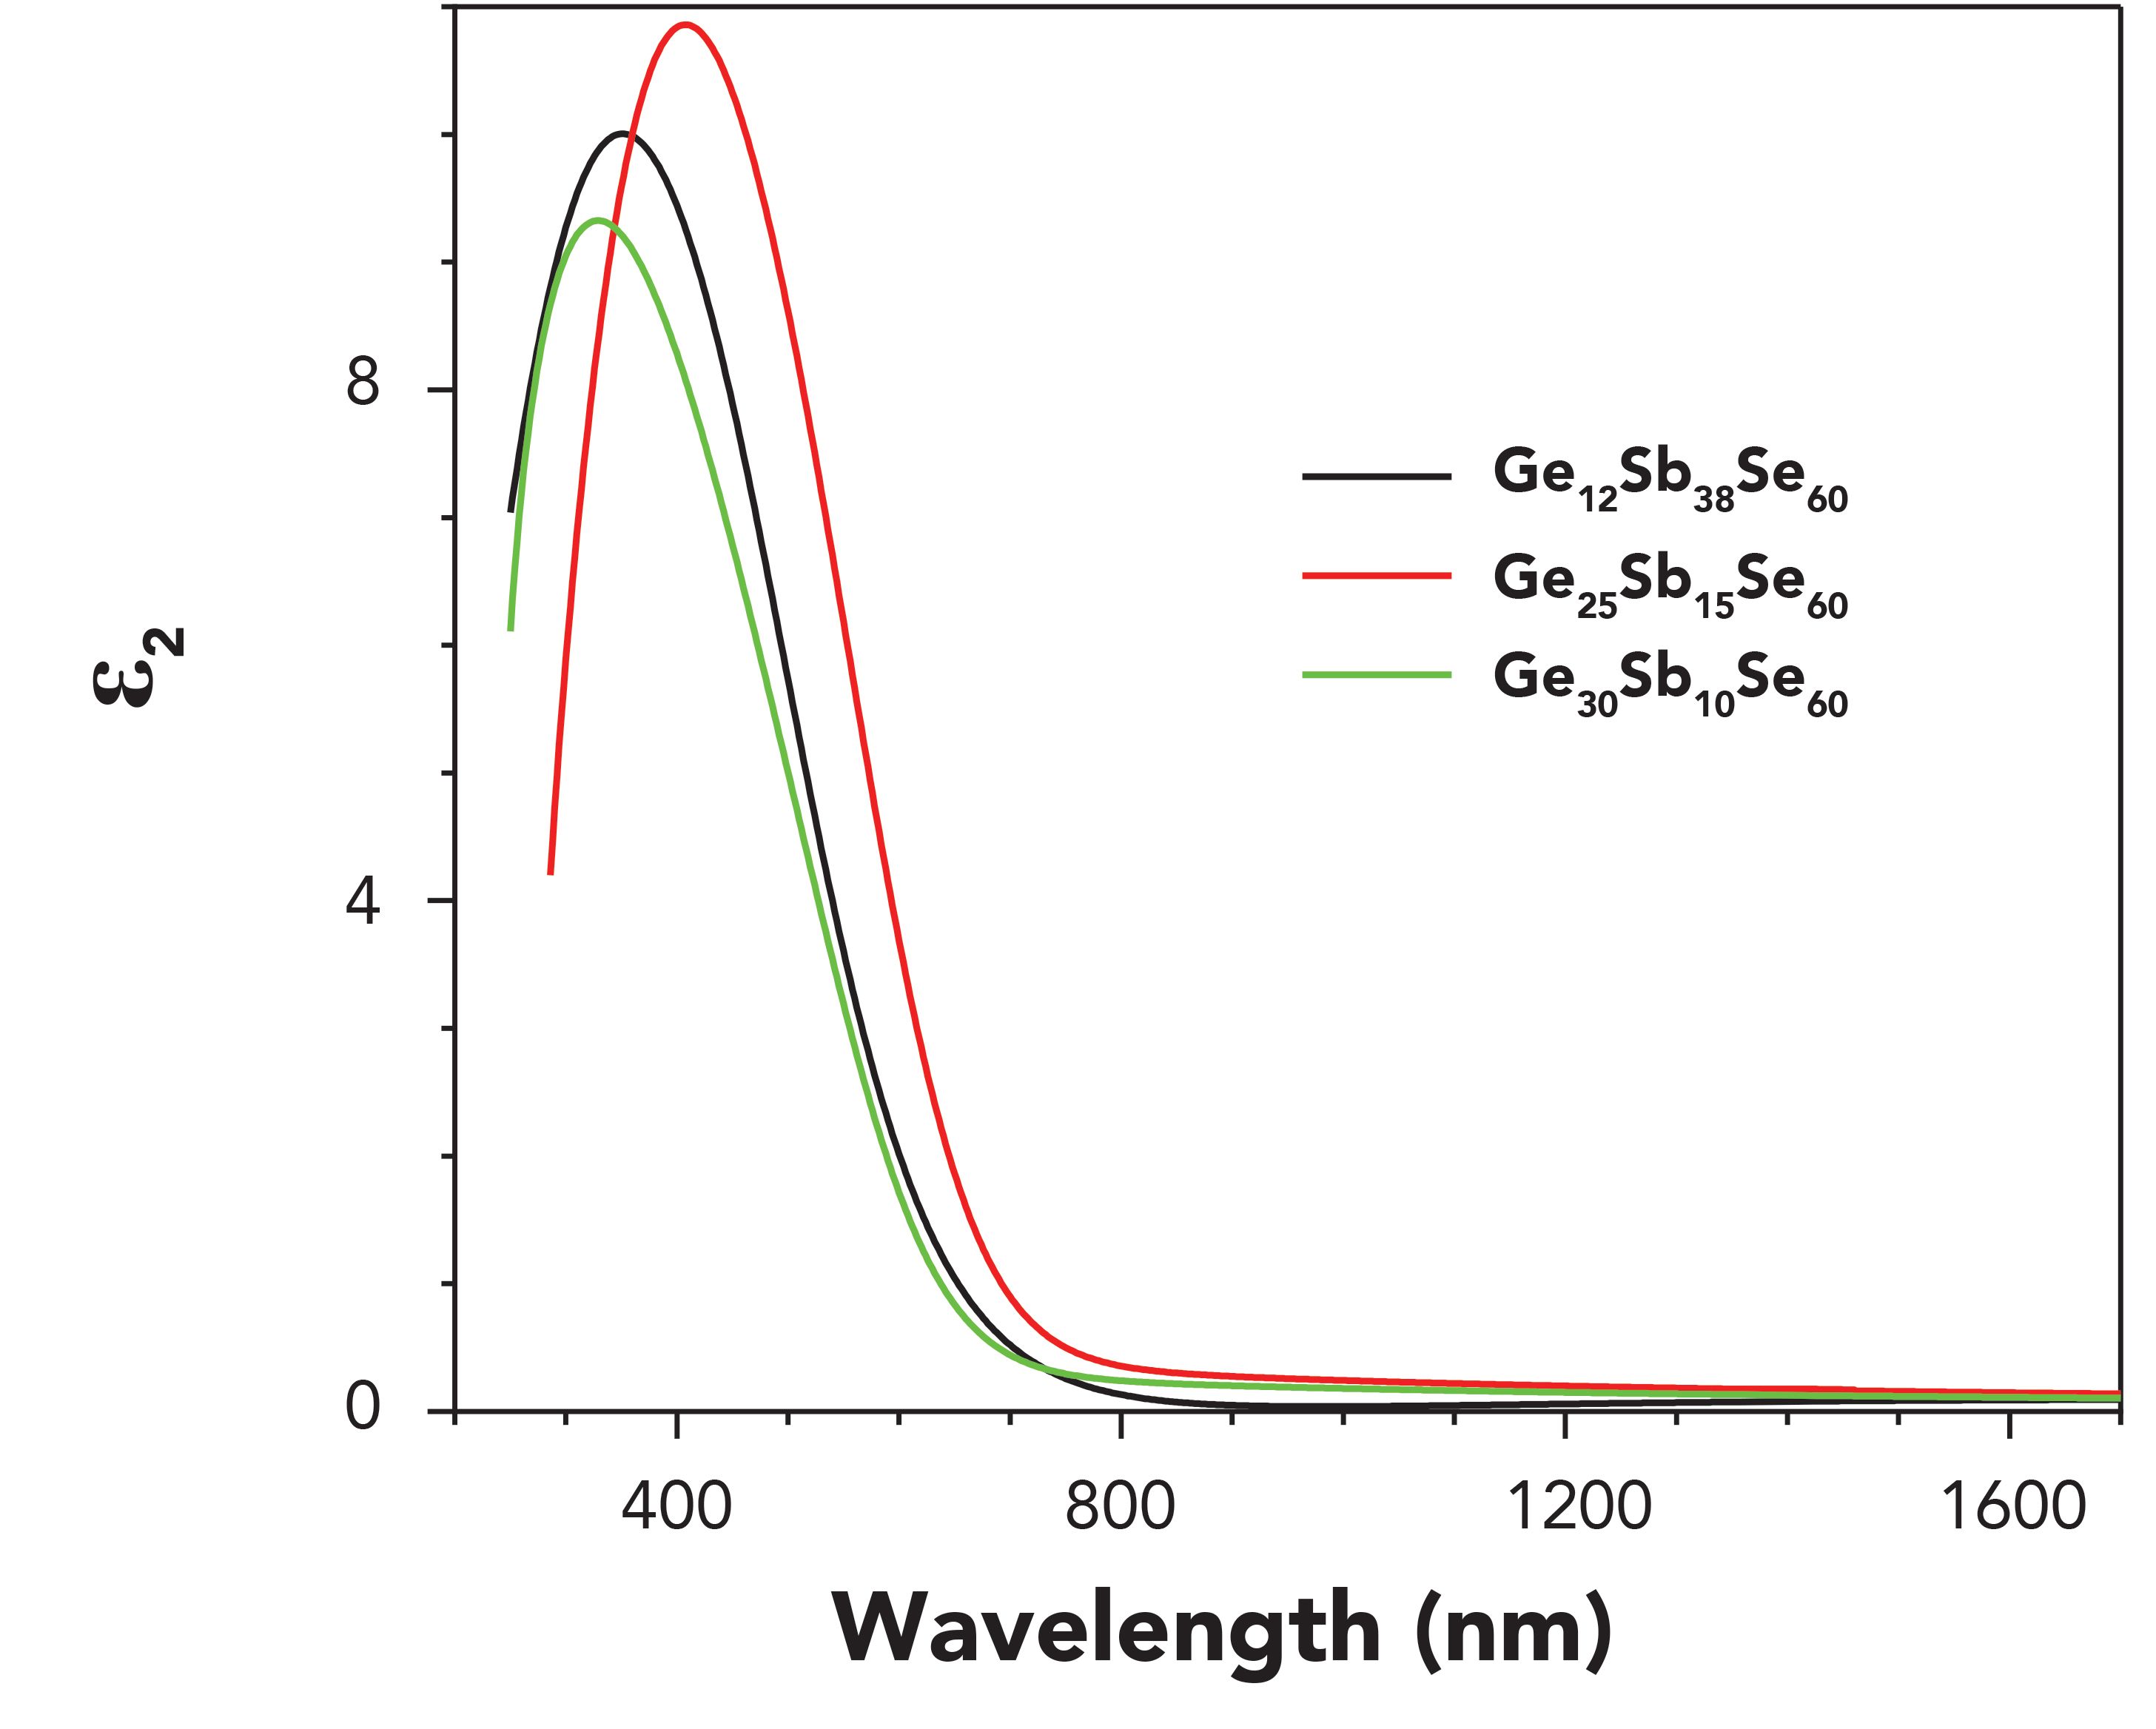
The dielectric constants decrease with increasing germanium content, and the results obtained are verified by (3,27).
Conclusions
The GexSb40-xSe60thin films with composition x = 12, 25, and 30 at.%, have been synthesized from elements with 5N purity (Ge, Sb, Se) by the conventional melt-quenching method. The mixture of the elements with proper weight percent was put in a quartz ampoule which was evacuated down to a pressure of 10-3 Pa. The optical properties for the GexSb40-xSe60alloys with composition x = 12, 25, and 30 at.% were analyzed by the generation of the envelope interference maxima and minima of the transmission spectrum. The optical properties were obtained by UV-vis-NIR spectroscopy and ellipsometry. The refractive index, absorption, and extinction coefficients decrease as increases the germanium content.
The dielectric properties were determined by the Wemple-DiDomenico (W-D) model based on calculus by high frequency dielectric constant.
This opto-geometrical characterization of the thin films carried out by the method detailed in this article will provide good knowledge of geometric (refractive index and thickness) and optical parameters for use of the studied thin films in optical waveguide devices, dynamic random-access memory (DRAM) materials, and electro-optical and sensor–actuator devices.
Another technique to improve the estimation of optical constants consists of combining the Swanepoel method with a formalism based on the Hilliard theory of surface tension (21).
Acknowledgments
We gratefully acknowledge support by a project of the Romanian Ministry of Research and Innovation, CCCDI-UEFISCDI, number PN-III-P1-1.2-PCCDI-2017-0221 / 59PCCDI/2018 (IMPROVE), within PNCDI III.
References
- R.W. Wood, TPhilos. Mag. 3, 607–622 (1902).
- W. Meier, Ann. Phys. 31, 1017–1049 (1910.)
- N. Dulgheru (Nedelcu), M. Gartner, M. Anastasescu, M. Nicolescu, M. Stoica, H. Stroescu, I. Atkison, V. Bratan, I. Stanculescu, A. Szekeres, P. Terziyska, and M. Fabian, Infrared Phys. Technol. 93, 260–270 (2018).
- F. Luis Santos, A. Ganjoo H. Jain, and M.R. Almeida, J. Non-Cryst. Solids 355, 1984–1988 (2009).
- S. Amachandran and S.G. Bishop, Appl. Phys. Lett. 74, 13 (1999).
- F. Chen , S. Dai, G. Wang, X. Wang, and Q. Nie, J. Alloys Compd. 537, 127 (2012).
- W. Zang, Y. Chen, F. Fu, F. Chen, X. Shen, X. Dai, G. Lin, and F. Xu, Acta Phys. Sin. 61, 6 (2012).
- R.M. Almeida, F. Luis Santos,A. Simens, A. Ganjoo, and H. Jain, J. Non-Cryst. Solids 353, 2066–2068, (2007).
- H.M. Hosni, S.A. Fayek, S.M. El- Sayer, M. Roushdy, and M.A. Soliman, Vaccum 81, 54–58 (2006).
- V. Nazabal, F. Charpentier, and L. Adam, Int. J. Appl. Ceram. Thechnol. 8, 990–1000, (2011).
- F. Verger, V. Nazabal, F. Colas, P. Nemec, C. Cardinaud, E. Baudet, R. Chahal, H. Rinnert, K. Boukerma, I. Peron, S. Deputier, M. Guilloux-Viry, J.P. Guin, H. Lhermite, A. Moreac, C. Compere, and B. Bureau, Opt. Mater. Express 3, 2112–2131 (2013).
- J. Li, X. Shen, J.Q. Sun, K. Vu, D.Y. Choi, P. Wang, B. Luther-Davies, X. Dai, F. Xu, and H. Nie, Thin Solid Films 545, 462–465 (2013).
- M. Oliver, P. Nemec, G. Boudebs, R. Boidin, C. Focsa, and V. Nazabal, Opt. Mater. Express 5, 781–793 (2015).
- Z.G. Ivanova, V. Pamukchiva, and M. Vlcek, J. Non-Cryst. Solids 293–295, 580–585 (2001).
- N. Sharma, S. Sharda, V. Sharma, and P. Sharma, J. Non-Cryst. Solids 375, 114–118 (2013).
- P. Sharma, V.S. Rangra, P. Sharma, and S.C. Katyal, J. Alloys Compd. 480, 934–937 (2009).
- S.Y. Shin, J.M. Choi, J. Seo, H.W. Ahn, Y.G. Choi, B. Cheong, and S, Lee, Sci. Rep. 4, 7009 (2014).
- W. Wen-Hou, F. Liang, X. Shen, and R.P. Wang, J. Appl. Phys. 115, 113510-1–113510-4 (2014).
- V. Chiroiu, N. Nedelcu, and V. Mosnegutu, Analele Universitatii “EFTIMIE MURGU” Resita year XXVI, NR. 1, 2019.
- N. Nedelcu, Rom. J. Mechanics 4(2), 47–64 (2019).
- N. Nedelcu, V. Chiroiu, C. Rugina, L. Munteanu, R. Ioan, I. Girip, and C. Dragne, Results Phys. 16,102856 (2020).
- J. Sanchez-Gonzales, A. Diaz-Parralejo, A.L. Ortiz, and F. Guiberteau, Appl. Surf. Sci. 252, 6013–6017 (2006).
- D.M. Roessler and D.R. Huffman, "Magnesium Oxide (MgO)," in Handbook of Optical Constants of Solids II, edited by E. D. Palik (Academic Press, New York, New York,1998), 919–955.
- J.C. Manifacier, J. Gasiot, and J.P. Fillard, Phy. E: Sci. Instrum. 9, 1002–1004 (1976).
- M. Gholami, A. Nazari, K. Azarin, S. Yazdanimeher, and A.B. Sadeghniya, J. Basic. Appl. Sci. Res. 3(5), 597–600 (2013).
- A. Essahlaoui, H. Essaoudi, A. Hallaoui, M. Bouhadda, A. Labzour, and A. Housni, J. Mater. Environ. Sci. 9(1), 228–234 (2018).
- M. Fabian, N. Dulgheru, K. Antonova, A. Szekeres, and M. Gartner, Adv. in Condensed Matter Physics, Article ID 7158079 (2018).
- S.H. Wemple and M. DiDomenico, Jr., Phys. Rev. B 3, 1338 (1971).
- D.A.G. Bruggeman, Ann. Phys. 24, 636–644 (1935).
- N. Zemel, J.D. Jensen, and R.B. Schoolar, Phys. Rev. A 140, 330 (1965).
- T.S. Moss, Optical Properties of Semiconductors (Butterworth’s Scientific Publication Ltd., London, United Kingdom, 1959) 245–265.
N. Nedelcu, V. Chiroiu, L. Munteanu, and I. Giripare with the Institute of Solid Mechanics at the Romanian Academy in Bucharest, Romania. Direct correspondence to: nicoleta_dulgheru@yahoo.com
Smarter Sensors, Cleaner Earth Using AI and IoT for Pollution Monitoring
April 22nd 2025A global research team has detailed how smart sensors, artificial intelligence (AI), machine learning, and Internet of Things (IoT) technologies are transforming the detection and management of environmental pollutants. Their comprehensive review highlights how spectroscopy and sensor networks are now key tools in real-time pollution tracking.
AI Shakes Up Spectroscopy as New Tools Reveal the Secret Life of Molecules
April 14th 2025A leading-edge review led by researchers at Oak Ridge National Laboratory and MIT explores how artificial intelligence is revolutionizing the study of molecular vibrations and phonon dynamics. From infrared and Raman spectroscopy to neutron and X-ray scattering, AI is transforming how scientists interpret vibrational spectra and predict material behaviors.
Real-Time Battery Health Tracking Using Fiber-Optic Sensors
April 9th 2025A new study by researchers from Palo Alto Research Center (PARC, a Xerox Company) and LG Chem Power presents a novel method for real-time battery monitoring using embedded fiber-optic sensors. This approach enhances state-of-charge (SOC) and state-of-health (SOH) estimations, potentially improving the efficiency and lifespan of lithium-ion batteries in electric vehicles (xEVs).
