Comparative Study of Heavy Metals Analysis in Mongolian Medicines Based on High Sensitivity X-ray Fluorescence Spectroscopy and ICP-MS
The contents of Pb, Hg, As, Cr, Fe, Cu, Ba, and Cd in five traditional Mongolian medicines (Garidi-5, Susi-7, Yihe-12, Zadi- 5, and Alatanaru-5) were determined by X-ray fluorescence (XRF) spectroscopy. The results were compared with those obtained by inductively coupled plasma–mass spectrometry (ICP-MS). According to the fundamental parameter (FP) approach in XRF, the response signal value was converted into the element content value using computer software. The method was stable and fast, not requiring pretreatment processes. When the content of metal elements was below 2.0 mg/kg, the relative standard deviation (RSD) of the precision test was between 5.49–20.0%. When the content was above 2.0 mg/kg, the RSD of the precision test was less than 4.96%. The limits of quantitation (LOQ) of As, Cd, and Pb were all below 0.1 ppm, the limits of quantitation of Cr, Cu, Ba, and Hg were below 1 ppm, and the limit of quantitation of Fe was 1.525 ppm. The standard addition method was used in the accuracy test, and the recoveries of the other seven elements were all within 85–130% except Hg. Because Hg was easy to volatilize, the recoveries were low but above 68.4%.
Mongolian medicine is the crystallization of Mongolian traditional nomadic culture, which was created, accumulated, and selected by the Mongolian people in the long-term practice of fighting against nature and disease for thousands of years. As one of the four major minority medicine systems in China, Mongolian medicine has an unique style (1). Garidi-5, Susi-7, Yihehari-12, Zadi-5, and Alatanaru-5 are commonly used in Mongolian medicine. Garidi-5 (2) comes from what is known as the “Four Medical Classics.” It is composed of musk, processed Radix aconiti kusnezoffii, Rhizoma calami, Aucklandia (Saussurea), and Terminalia chebula. Susi-7 (3) also comes from the “Four Medical Classics,” which is comprised of bear gall, Forsythia, Processed wood turtle seed, Ophiopogon japonicus, Rhizoma cyperi, Akebia, and Salvia miltiorrhiza. Yihehari-12 (4) is comprised of 12 herbs, including black ice flakes, Digda, Elecampane (Inula helenium), Carthami flos, Picrorhizae rhizoma, toosendan fruit, myrobalan (Prunus cerasifera), jasmine (Jasminum officinale), Gypsum fibrosum, Rhizoma nardostachyos (Nardostachys jatamansi), beef gall powder, and calculus bovis (dried cattle gallstones). Zadi-5 (5) comes from the classic work Selected Edition of Mongolian Medicine. It is comprised of nutmeg, I. helenium, Aucklandia (Saussurea), Choerospondiatis fructus, and Piper longum. Alatanaru-5 (6) comes from the classic works of Mongolian medicine, such as Selected Edition of Mongolian Medicine, Encyclopedia of Mongolian Medicine, and Study of Mongolian Medicine Prescriptions. It is comprised of myrobalan (P. cerasifera), pomegranate (Punica granatum), gac (Momordica cochinchinensis), trogopterori faces extract powder, and black ice flakes. Mongolian medicine is good at using animal medicine, mineral medicine, or animal medicine and plant medicine after calcination and processing, such as black ice flakes, trogopterori faces, Gypsum fibrosum, beef gall powder, bear gall, processed R. aconiti kusnezoffii, and processed wood turtle seed. These factors increase the chance of introducing heavy metal elements harmful to the human body into drugs. In recent years, the development of Mongolian medicine has been affected by many aspects, including the low quality standard of Mongolian medicine, and its safety and effectiveness can not be guaranteed scientifically and systematically (7). The detection and quantitative analysis of heavy metals in Mongolian medicine is an important guarantee for medication safety. In modern Mongolian medicine production and processing, because of the production technology, processing technology, origin environment, and other factors, the heavy metal content is easy to exceed the standard. This study showed the difference between the XRF method and inductively coupled plasma–mass spectrometry (ICP-MS), with the results revealing that XRF spectroscopy was fast, accurate, and simple, making it the more effective method in controlling the limit of heavy metal elements in Mongolian medicine.
In recent years, as more precision scientific instruments are used in the quality research of drugs, new methods for determining heavy metal content emerge. The most commonly used methods are ICP-MS (8–11) and atomic absorption spectrometry (AAS) (12–14). However, ICP-MS requires that the must be digested first, which may lead to incomplete digestion and error, and the digestion conditions need to be accurately controlled, so the operation is difficult. AAS cannot carry out multielement analysis at the same time, and the light source must be changed when determining specific elements, which greatly reduces the efficiency of analysis. The X-ray fluorescence (XRF) method is favored by analysts because of its nondestructive analysis, simple sample preparation, environmental friendliness, and fast analysis speed. It has a broad application prospect in the quality control of heavy metals in ethnic medicine. In this study, we used high sensitive XRF combined with a fundamental parameter (FP) method to analyze eight heavy metal elements, such as lead, mercury, arsenic, chromium, iron, copper, barium, and cadmium in five traditional Mongolian medicine prescriptions, including Garidi-5 (GRD-5), Susi-7 (SS-7), Yihe-12 (YH-12), Zadi-5 (ZD-5) and Alatanaru-5 (ALT-5). The results were compared with those obtained by ICP-MS, and the applicability and feasibility of XRF method was verified.
Materials and Methods
Instruments and Reagents
A Phecda-He XRF spectrometer (Beijing Ancoren Technology Co, Ltd), an Angilent 7900 ICP-MS instrument (Agilent Technology Co., Ltd), a MARS6 microwave digester (CEM), a Milli-Q Ultrapure water machine (Millipore), and a tablet machine (Tianjin Keqi Hi Tech Co., Ltd) were used for this study. Boric acid was also used as the analytical reagent.
X-ray Fluorescence (XRF) Method
Sample Preparation
The Boric acid edge pressing method was used by measuring approximately 4 g of the Mongolian medicine sample powder (all fine powder passing through 60 mesh sieve) into the grinding tool and pressing the tablet with the boric acid edging method. The pressure was set at 20 MPa, the pressure holding time was 60 s, and the sample diameter was 30 mm. Figure 1 shows what the Mongolian sample powder looked like after sample preparation was completed.
FIGURE 1: Boric acid edge pressing of Mongolian medicine powder (sample designation shown).

Test Conditions
Because the excitation energy of different elements was different, three excitation conditions were used for the test. The test conditions are shown in Table I.

ICP-MS
Preparation of Standard Solution
The appropriate amount of arsenic, lead, copper, iron, cadmium, chromium, barium, and mercury reference materials were prepared in a series of standard solutions of 0.10, 0.50, 1.00, 2.50, 5.00, 10.0, 25.0, 50.0, and 100.0 ng/mL, respectively.
Sample Preparation
The sample preparation method was performed as follows: 0.1 g of the sample was weighed accurately before 5 mL of nitric acid and 1 mL of hydrogen peroxide was added. The solution was allowed to soak overnight before being digested according to the following digestion procedure: it was heated for 6 min, then held for 5 min at a temperature of 110 °C, heated for 6 min, held for 5 min at a temperature of 140 °C, heated for 6 min, held for 5 min at a temperature of 180 °C, heated for 15 min, and finally held for 10 min at a temperature of 210 °C.
When determining iron, 1.0 mL of the above solution was absorbed and placed in a 100 mL volumetric flask before being diluted with water. The volume was fixed to the scale, shaken, and then precisely absorbed 1.0 mL of the solution, which was then placed in a 10 mL volumetric flask. The solution was then diluted with water before being shaken, after which then there was a wait for determination.
Test Conditions
The testing conditions were as follows: the sample lifting rate was 0.4 mL/min. The radio frequency (RF) power was 1550 W. The atomization chamber temperature was 2 °C. The helium velocity in collision reaction tank was 0.4 mL/min. The internal standard was a virtual reality system comprised of scandium, indium, lithium, and bismuth. The acquisition mode was a combination of quantitative and rapid scanning.
Results and Discussion
Basic Parameter Method
The basic parameter method is a comprehensive calculation of the X-ray generation, monochromation, sample excitation, and detector reception process. From the X-ray generation, the filtering of the primary X-ray, and the interaction between the X-ray and the sample (fluorescence effect and scattering effect) to the response of X-ray detector, there were several parameters, such as X-ray parameters, monochromatic parameters, optical path parameters, interaction parameters between elements in the sample, and detector parameters. The core content of the basic parameter method is to calculate the whole process from the X-ray incident to the sample at a certain incident angle to the X-ray emission from the sample at a certain exit angle to obtain accurate X-ray energy spectrum.
The single energy X-ray incident on the sample (uniform sample or multilayer coating sample) excites the primary and secondary fluorescence X-ray and scattering X-ray produced by the elements in the sample. According to the principle of X-ray and substance interaction and the basic parameter database of X-ray and substance interaction, the monochromatic X-ray incident on the sample can be calculated. The continuous spectrum of incident X-ray can be divided into many fractions according to the energy, and each fraction can be calculated as monochromatic X-rays, namely numerical integration. Because of the need for numerical integration of the continuous spectrum, the amount of calculation for multiple iterations is large when quantifying unknown samples. Therefore, by optimizing the program design, the calculation time is significantly shortened.
According to the parameters of each step, the theoretical calculation spectrum of the whole process of X-ray generation and reception is calculated. The element content (and coating thickness) of the unknown sample is taken as the unknown parameters. The calculated spectrum is fitted with the actual spectrum collected by the detector, and the error between the calculated spectrum and the measured spectrum is minimized through iteration. During the fitting process, the content of each element changes continuously. When the fitting is complete, the content of each element does not change, which is the quantitative value. The obtained parameters are used as the element content (or coating thickness) of the unknown sample.
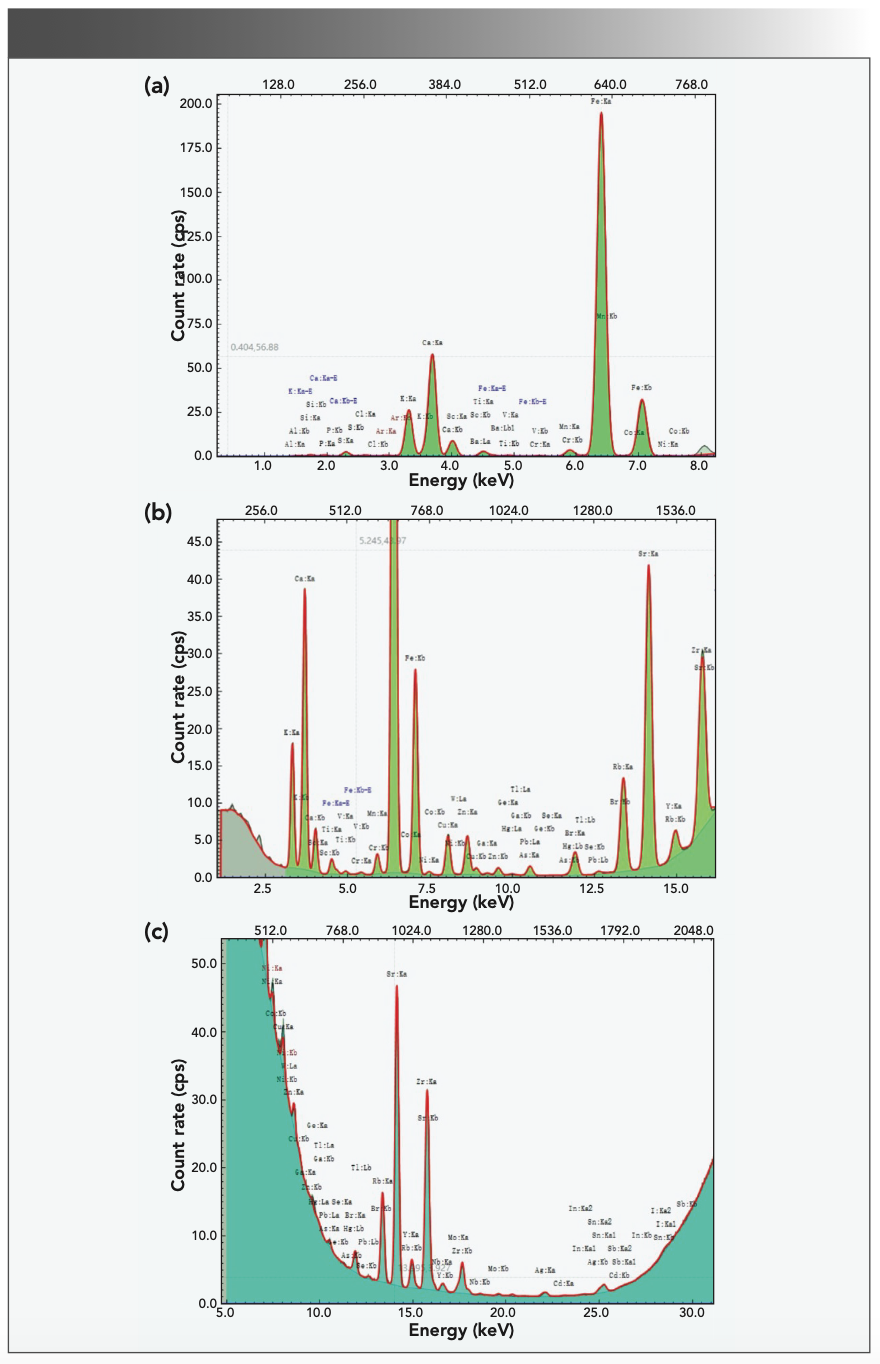
In the process of testing, the spectra of each element under different energy conditions are shown in Figure 2.
FIGURE 2: Energy spectrum of each element under different energy conditions: (a) low-energy, (b) mid-energy, and (c) high-energy.
Precision Test
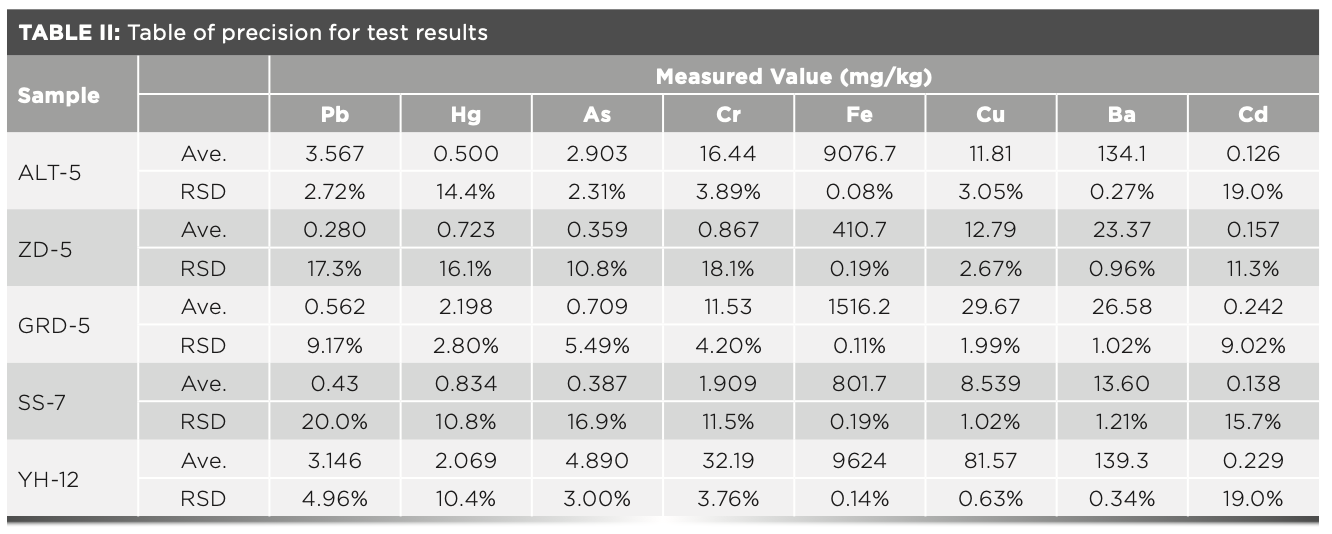
To conduct the precision test, the right amount of Mongolian medicine powder was taken and the sample was pressed according to the “boric acid edge pressing method,” before testing it on the XRF spectrometer. Each sample was determined six times. The results after fitting by the basic parameter method are shown in Table II. The results show that the precision was between 5.49–20.0% when the content of the metal elements was less than 2.0 mg/kg, and less than 4.96% when the content was more than 2.0 mg/kg. The precision of this method can meet the analysis requirements.
LOD and LOQ
There were two methods for determining the LOD and LOQ—the background method and the repeated method. The LOD is usually determined by repeated determination. The LOD was calculated as LOD = 3×. For the RSD of the blank signal, the LOQ was calculated as LOQ = 10×. The RSD of the blank signal was calculated as the RSD of 11 repeated determinations of the blank sample. The results were shown in Table III. The results showed that the high sensitive XRF method had a low LOQ for heavy metals, which could meet the requirements of limit control analysis of heavy metals in drug quality standards.

Accuracy Test
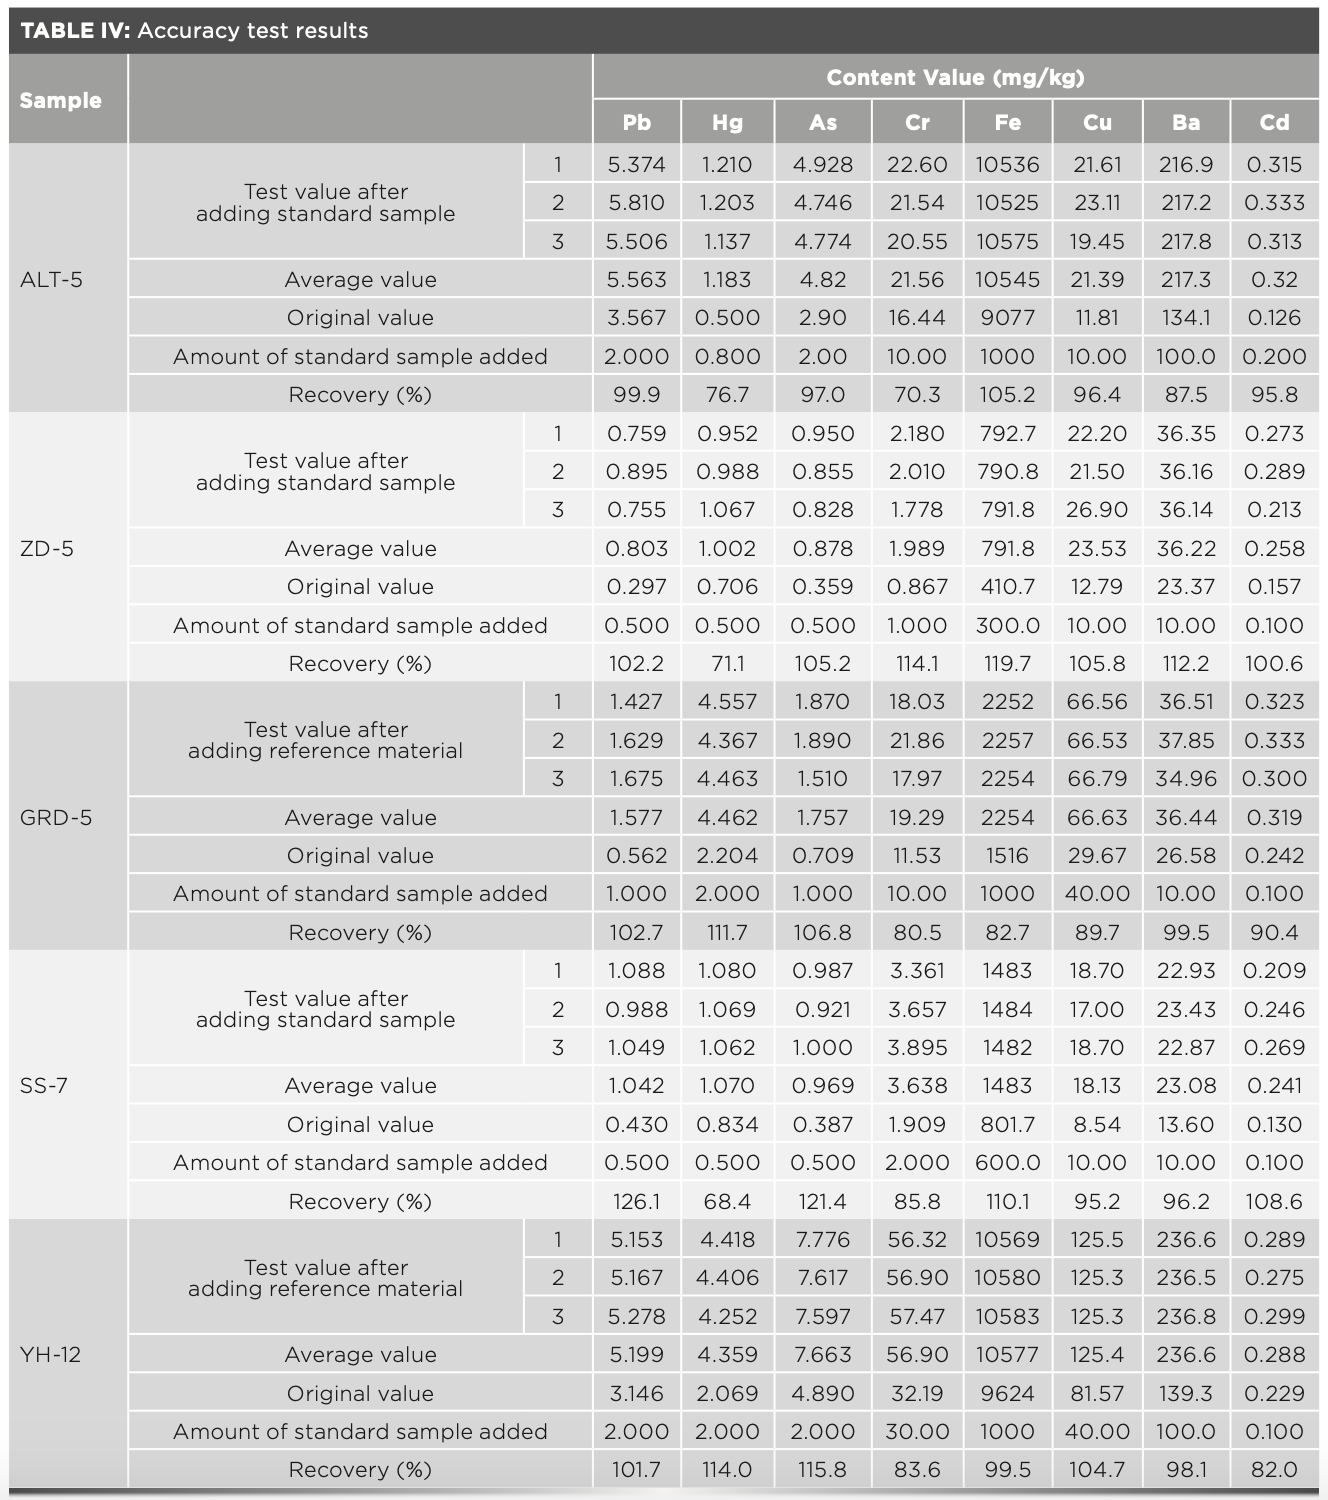
Mongolian medicine samples with known contents of heavy metal elements were taken. Eight types of element reference materials were added to the samples, and the results were tested on a XRF spectrometer. The recovery rate was calculated by which the accuracy of the method was expressed. The results are shown in Table IV. Because mercury was easy to volatilize, the recovery rate was less than 70% but more than 68.4%. The recovery rates of the other seven elements were within 85–130%. The results show that the accuracy of the method is optimal.
Methodology Test of ICP-MS
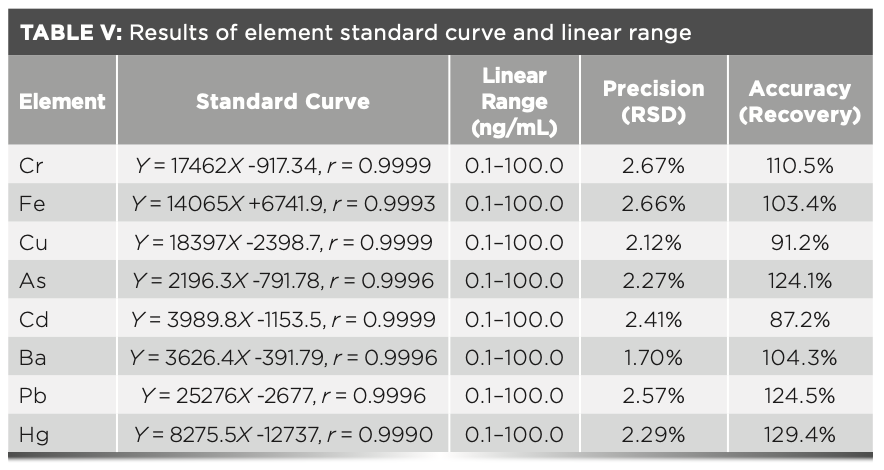
According to the test conditions under “1.3.3,” the response values of each metal element series standard solution were determined one at a time, and the standard curve of each element was fitted by the least square method. The results are shown in Table V. The results revealed that there was a good linear relationship between the response value and the concentration of eight metal elements, including arsenic, lead, copper, iron, cadmium, chromium, barium, and mercury. The RSD of the intermediate concentration standard solution was less than 2.67% after repeated determination was performed five times, which showed that the precision of the method was optimal. The digestion solution with the known content was then taken, and an appropriate amount of each element standard material solution was added. The recovery rate of the method was calculated, which was between 85–130%, and that indicated that the accuracy of the method was good. In addition, the stability of the sample was also investigated. When the digested solution was placed at room temperature for 24 hr, the response value did not change significantly, which indicated that the digested solution was stable at room temperature.
Comparison of XRF and ICP-MS Results
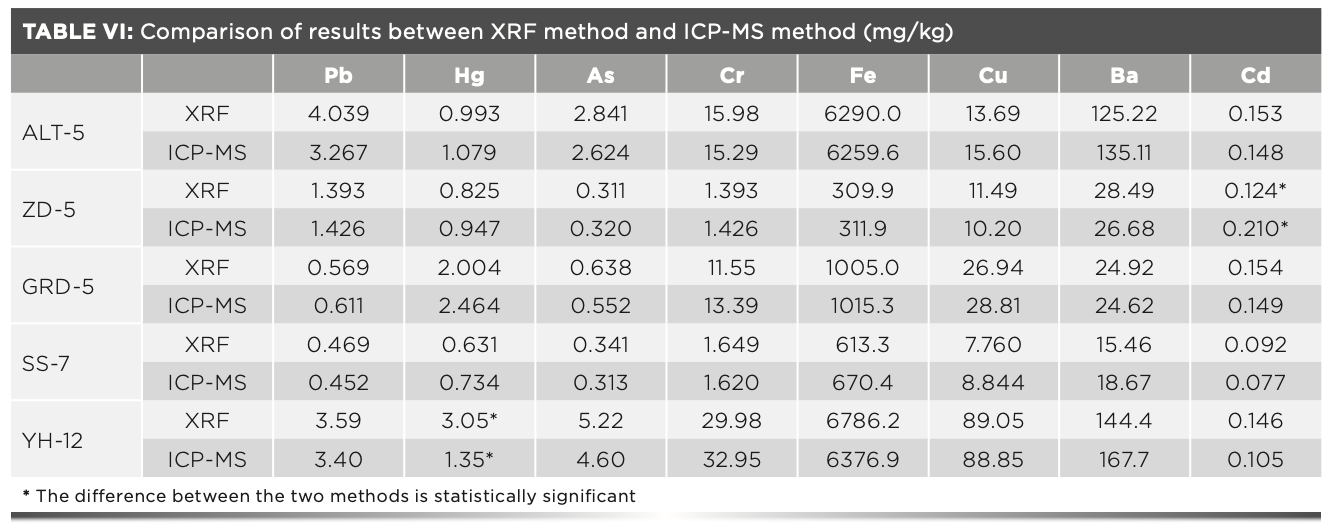
The contents of eight heavy metals in Mongolian medicine were determined by ICP-MS method. The results were compared with those by XRF method, and the differences between the two methods were tested. The results are shown in Table VI. In addition, the results of cadmium in Zadi-5 and mercury in Yihe-12 are significantly different in the two methods; the other results were in the acceptable range. The results showed that both methods could determine the contents of the eight metal elements in question accurately. On the premise of ensuring the accuracy and precision of the determination, the XRF method is more rapid, simple, and nondestructive than ICP-MS, which makes it the more ideal method for analyzing heavy metals.
Conclusion
XRF spectroscopy has been widely used in the field of inorganic analysis, such as art identification, archaeology, agricultural product safety, environment, energy, mineral exploration, and electronic materials (15–20). In recent years, the XRF method has been widely used in analyzing and evaluating elements in traditional Chinese medicine because of its fast, convenient, and online analysis (21–25). In the past decade, the breakthrough of several core technologies has led to the rapid development of energy dispersive XRF (ED-XRF) spectroscopy, including silicon drift detector (SDD) technology with a high resolution and count rate. Monochromatic focusing excitation technology can greatly reduce the background interference and improve the intensity of the elemental fluorescence signal. Newer X-ray tubes can greatly improve the focal spot size, radiation flux, and stability. The breakthrough and development of these core hardware technologies extended the ability of XRF to analyze elements from the previous major elements to trace elements, and meet the requirements of many heavy metal detection limit specified in the quality standards of traditional Chinese medicines.
A single wavelength excitation ED-XRF spectrometer uses hyperboloid curved crystal focusing technology, a high-resolution detector, a micro focal spot end window X-ray tube, and other core technologies. In this study, this technology was first applied to the analysis of metal elements in ethnic compound pharmaceutical preparations. The detection limit and quantitation limit reached sub-ppm levels, and the quantitation limits of arsenic, cadmium, mercury, and lead—the most stringent drug limit—reached 0.039, 0.051, 0.135, and 0.075 mg/kg levels.
Traditional Chinese medicine and ethnic medicines have the characteristics of wide distribution and variety. For XRF quantitative analysis of trace heavy metal elements, in addition to the detection limits of the hardware, a software quantitative algorithm also has challenges. If the traditional influence coefficient method is used to make the standard curve, it cannot deal with the fact that the matrix of various types of traditional Chinese medicine is inconsistent, and quantitative deviation caused by the matrix effect is bound to exist. In this experiment, the complete basic parameter method was used to investigate the quantitative accuracy and its adaptability. Based on the theoretical calculation of XRF from the generation of X-ray tube to the detection of detector, the basic parameter method eliminates the influence of matrix effects and the absorption enhancement effect between elements. The systematic error correction can be carried out by a small number of standard samples to achieve the purpose of quantifying unknown elements and adapting to all types of samples. With the increasing demand for sensitive, trace, real-time and efficient information data, high-sensitivity XRF spectroscopy with its unique advantages will occupy an important position in the quality control and the research and development of Mongolian medicines.
Funding
This work was supported by the open project of the Inner Mongolia Key Laboratory of Human Genetic Diseases Research. This work was also supported by the construction project of the Key Laboratory of Chifeng University (CFXYZD202008).
References
(1) X.L. Zhu, Chin J. Tradit. Chin Med. Pharm. 36(2), 667–670 (2021).
(2) Q.Y. Bai, Encyclopedia of Chinese Medicine. Encyclopedia of Chinese medicine, Mongolian Medicine (Shanghai, Shanghai Scientific and Technical Publishers, 1992).
(3) Inner Mongolia Autonomous Region Institute of Mongolian Medicine, Four Medical books, Mongolian Version (Hohhot, Inner Mongolia People’s Publishing House, 1978).
(4) Pharmacopoeia Committee of the Ministry of Health of China, Drug Standards of Ministry of Health, Mongolian Medicine Volume (The Medicine Science and Technology Press of China, 1998).
(5) Q.Y. Bai, Encyclopedia of Chinese Medicine. Encyclopedia of Chinese Medicine, Mongolian Medicine (Shanghai, Shanghai Scientific and Technical Publishers, 1992).
(6) L. Le, Mongolian Medical Classics Series (Hohhot, Inner Mongolia People’s Publishing House, 1999).
(7) Narentuya, Y. Lin, S.R. Bao, and T.N. Han, Chin. Phar. Affairs 29(12), 1245–1249 (2015).
(8) J. Ma, Z.P. Cheng, M. An,Q. Li, D.M. Zhang, C.H. Duan, and M.Z. Zhao, J. Med. & Phar. Chin Minorities 26(8), 38–40 (2020).
(9) B. Liu, M.Q. Sha, Y.Q. Zhang, L.H. Yan, H. Tian, L.H. Zhu, and L.H. Su, J. Green Sci. Tech. 10, 182–184 (2019).
(10) Y.Y. Luo, J.X. Liu, Y. Hou, X.H. Liu, C.W. Lan, Y.Ma, S.N. Wang, Chin. Trad. Herb. Drugs 46(7), 1056–1064 (2015).
(11) Y.M. Tang, W. Cai, B. Li, Z.W. Zhao, and Y.J. Duan, Chin. Trad. Pat. Med. 43(1), 181–184 (2021).
(12) Z.J. Li, G. Yu, and L. Zhang, Chem. Reag. 1–6 (2021). https://doi.org/10.13822/j.cnki.hxsj.2021007914
(13) T.F. Wang, Y.H. Chen, T. Liu, Y.L. Shi, and A.J. Xiao, J. Hubei Inst. Tech. 36(3), 62–65 (2020).
(14) Y. Wang, G. Hao, and J. Zhang, J. Inner Mongolia Agri. Univ. (Natural Science Edition) 41(3), 1–3 (2020).
(15) D.C. Weindorf, Y. Zhu, S. Chakraborty, Noura, Bakr, and Biao, Envi. Moni. Asses. 184(1), 217–227 (2012).
(16) K.D. Shepherd,R.J. Gilkes, and N. Prakongkep, ”Soil spectral diagnostics-infrared X-ray and laser diffraction spectroscopy for rapid soil characterization in the Africa Soil Information Service,” paper presented at the 19th World Congress of Soil Science, Soil Solutions for a Changing World, Brisbane, Australia, 2010.
(17) S.C. Zhang, X.C. Zhou, L.J. Zhang, and H.X. Ye, Res. Exp. in Lab. 28(9), 39–42 (2009).
(18) Z.Q. Xu, L. Heng, S.R. Zhao, Y.J. Gao, J.F. Liu, and G.H. Meng, The Food Ind. 40(2), 319–322 (2019).
(19) E.K. Towett, K.D. Shepherd, A. Sila, E.Aynekulu, and G. Cadisch, Soil Sci. Socam. J. 79(5), 1375–1385 (2015).
(20) C. McGladdery, D.C. Weindorf, S. Chakraborty, B. Li, L. Paulette, D. Podar, D. Pearson, Kusi, Nana Yaw O, and B. Duda, J. Environ. Manage. 210, 210–225 (2018).
(21) P. Fang, W. Zou, X.X. Shi, and X.Y. Qi, Chin. J. Pharm. Anal. 37(7), 1280–1285 (2017).
(22) W. Han, J.J. Ding, Y.F. Mei, and Z.Z. Ma, Phys. Test. Chem. Anal. (Part B: Chem. Anal.) 51(2), 188–191 (2015).
(23) C. Li, L. Sang, B.C.R. Leng, Z.J. Xia, Y.Z. Du, and L.X. Wei, Spectrosc. Spect. Anal. 32(6), 248–251 (2012).
(24) H.X. Yang, C. Li, Y.Z. Du, and L.X. Wei, Spectrosc. Spect. Anal. 35(6), 1730–1734 (2015).
(25) P. Mahawatte, K.R. Dissanayaka, and R. Hewamanna, J. Radioanal. Nucl. Chem. 270(3), 657–660 (2006).
Ling Gao is with Chifeng University, in Chifeng, China. Donghua Di is with Shenyang Pharmaceutical University, in Shenyang, China. Xiaojing Liu and Fei Teng are with Beijing Ancoren Technology Co. Ltd., in Beijing, China. Direct correspondence to: lging@163.com ●
LIBS Illuminates the Hidden Health Risks of Indoor Welding and Soldering
April 23rd 2025A new dual-spectroscopy approach reveals real-time pollution threats in indoor workspaces. Chinese researchers have pioneered the use of laser-induced breakdown spectroscopy (LIBS) and aerosol mass spectrometry to uncover and monitor harmful heavy metal and dust emissions from soldering and welding in real-time. These complementary tools offer a fast, accurate means to evaluate air quality threats in industrial and indoor environments—where people spend most of their time.
High-Speed Laser MS for Precise, Prep-Free Environmental Particle Tracking
April 21st 2025Scientists at Oak Ridge National Laboratory have demonstrated that a fast, laser-based mass spectrometry method—LA-ICP-TOF-MS—can accurately detect and identify airborne environmental particles, including toxic metal particles like ruthenium, without the need for complex sample preparation. The work offers a breakthrough in rapid, high-resolution analysis of environmental pollutants.
AI Shakes Up Spectroscopy as New Tools Reveal the Secret Life of Molecules
April 14th 2025A leading-edge review led by researchers at Oak Ridge National Laboratory and MIT explores how artificial intelligence is revolutionizing the study of molecular vibrations and phonon dynamics. From infrared and Raman spectroscopy to neutron and X-ray scattering, AI is transforming how scientists interpret vibrational spectra and predict material behaviors.
Advancing Corrosion Resistance in Additively Manufactured Titanium Alloys Through Heat Treatment
April 7th 2025Researchers have demonstrated that heat treatment significantly enhances the corrosion resistance of additively manufactured TC4 titanium alloy by transforming its microstructure, offering valuable insights for aerospace applications.