Comparison of Laboratory and Handheld Raman Instruments for the Identification of Counterfeit Medicines
Raman spectroscopy offers a rapid, simple, and nondestructive technique for the identification of counterfeit medicines. The advantages of handheld Raman spectroscopy are that it is easy to use by unskilled personnel and it can identify a test pharmaceutical product on the spot, whether the product is in solid or liquid form. However, these instruments can operate only in reflection mode, and the Raman activity of a sample is often masked by fluorescent species in the sample, especially when the analysis is made in reflection mode. The objective of this work was to compare the use of a handheld and laboratory-based Raman instruments for authentication of pharmaceutical products obtained from the world market.
Raman spectroscopy offers a rapid, simple, and nondestructive technique for the identification of counterfeit medicines. The advantages of handheld Raman spectroscopy are that it is easy to use by unskilled personnel and it can identify a test pharmaceutical product on the spot, whether the product is in solid or liquid form. However, these instruments can operate only in reflection mode, and the Raman activity of a sample is often masked by fluorescent species in the sample, especially when the analysis is made in reflection mode. The objective of this work was to compare the use of a handheld and laboratory-based Raman instruments for authentication of pharmaceutical products obtained from the world market.
The problem of counterfeit medicines is a complicated issue and goes way beyond just the poor manufacturing quality of medicines. It is the deliberate and fraudulent labeling of counterfeit medicines that distinguishes them from medicines that are substandard. Not only may the counterfeit product not contain the drug stated on the label, but it might also contain a toxic or even lethal substance. For example, 192,000 people died in China from the use of counterfeit medicines in 2001 (1). Also, polyethylene glycol in counterfeited paracetamol syrup was responsible for the death of children in Nigeria in 1990 (2,3). No country is immune to the problems of counterfeit medicine supply and it is estimated that about 10% of medicines worldwide are counterfeits (4). The supply channel of these counterfeit medicines is believed to come mostly from the Internet and street markets, which are difficult to control. It is estimated that 25% of street market medicines and 60% of Internet medicines are substandard or counterfeits (5).
These problems highlight the need for fast and simple techniques that can identify counterfeit medicines in places such as hospitals, pharmacies, and markets. Raman spectroscopy offers a rapid, simple, and nondestructive technique for the authentication of medicines. Raman spectroscopy has been used widely in pharmaceutical analysis (6,7), particularly for the identification of counterfeit medicines such as artesunate tablets (8–11), Cialis tablets (12,13), Lipitor tablets (14), and Viagra tablets (13,15). The counterfeit tablets concerned were manufactured using another active pharmaceutical ingredient (API) or excipients including artesunic acid, calcium carbonate, calcite, dipyrone, erythromycin, lovastatin, paracetamol, starch, talc, and titanium dioxide.
The advantage of the application of Raman spectroscopy to medicines is that it can analyze a product regardless of its physical state: solid, liquid, or film. In addition, Raman spectroscopy offers information about specific components in the sample because it has high structure selectivity. However, a major disadvantage of Raman spectroscopy is that the Raman signal sometimes is masked by the fluorescence in the sample analyzed (16). This can be overcome in two ways: by choosing an excitation wavelength away from the absorption bands of fluorescent species (usually between 785–1064 nm) (4) or by using the transmission mode instead of reflection mode. Newer laboratory-based Raman instruments can operate in both reflection and transmission modes. However, their use is time-consuming because they require bringing the tablet to the laboratory. In addition, they can only be operated by skilled analysts. Thus, they are not convenient for the analysis of potentially counterfeit products on the street market. Handheld Raman instruments offer the advantage of carrying the laboratory to the sample so they save the time of importing the samples to the laboratory. Also, these instruments operate in a simple identification mode so that the analysis can be carried out by unskilled personnel. However, these instruments lack the accuracy of laboratory-based instruments and can operate only in reflection mode.
The objective of this work was to evaluate the identification of potential counterfeit medicines using a laboratory-based and a handheld Raman instrument. Qualitative comparison using multivariate analysis was used.
Instrumentation and Measurement
For this study, 67 tablet products, which contained a total of eight APIs, obtained from various different countries were examined (Table I). These APIs were atorvastatin calcium trihydrate, cetirizine hydrochloride, ciprofloxacin hydrochloride, clopidogrel hydrogen sulfate, loratadine, risedronate sodium, valsartan/hydrochlorothiazide, and valsartan. The percentage of API by mass in these tablets ranged from a minimum of 5% m/m to a maximum of 66% m/m. The number of excipients used in the manufacture of the tablets ranged from three to 13, although the major excipients were lactose monohydrate, maize starch, or microcrystalline cellulose. Intact tablets were measured as received with no sample preparation. Powdered tablets were measured in Waters 4-mm glass vials (Waters Corporation, Milford, Massachusetts).
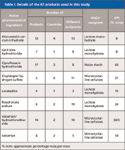
Table I: Details of the 67 products used in this study
For the laboratory-based instrument, a Kaiser Raman WorkStation (Kaiser Optical Systems, Inc., Ann Arbor, Michigan) was used. It consisted of a dispersive Raman spectrometer equipped with a diode laser source (785 nm), a charge-coupled device (CCD) detector, and a holographic grating. The Raman spectral range was 142–1898.4 cm-1. For the handheld instrument, a Thermo Fisher Scientific TruScan (formerly Ahura Scientific, Inc., Wilmington, Massachusetts) instrument of light weight (1.7 kg) and small dimensions (30 × 15 × 7.6 cm) was used. The instrument could operate in a temperature range of 20–40 °C. It was equipped with a laser source (785 nm) and a 2048-element silicon CCD detector. The Raman spectral range was 250–2875 cm-1.
The Raman spectra of the tablets were measured by both instruments in the reflection mode and baseline corrected. Then, a spectral comparison using correlation in wavelength space (CWS) and principal component analysis (PCA) methods was carried out using Matlab R2007a software. For the CWS method, the correlation coefficient (r) value threshold taken was 0.95 for identification as authentic. For the PCA comparison, the 95% equal frequency ellipse was drawn around the PC scores of each set of tablets.
Raman Signals of Tablets
The Raman intensity of a tablet is dependent upon the chemistry of the various components in a tablet, although the scale of measurement is arbitrary (17). The tablets used in this study contained different components and differed in shape, color, and physical properties. All of the products measured had Raman scattering except the ones containing clopidogrel hydrogen sulfate. This Raman scattering was variable between the two instruments and was dependent on the concentrations of the Raman scattering species. For instance, Zyrtec tablets contained cetirizine hydrochloride as an API (8% m/m) and a small amount of titanium dioxide in their coating, both of which are Raman active species. When this tablet was measured using the handheld instrument, the spectrum obtained resembled titanium dioxide (Figure 1a–c), whereas the spectrum obtained from the laboratory-based instrument (Figure 1d) resembled cetirizine hydrochloride. Thus, the laboratory-based instrument was better for detecting Raman active species in the core of the tablet.
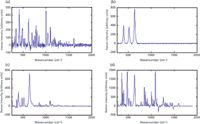
Figure 1: Baseline-treated Raman spectra of (a) cetirizine hydrochloride, (b) titanium dioxide, (c) a Zyrtec (cetirizine hydrochloride) tablet measured using the handheld instrument, and (d) the tablet using the laboratory-based instrument.
However, this was not the case when a high concentration of a Raman active species was present in a tablet. For example, ciprofloxacin hydrochloride is Raman active and present in a concentration of 66% in Ciproxin tablets. Using both instruments, the Ciproxin tablets spectra resembled the spectra of the ciprofloxacin hydrochloride, even though these tablets contained titanium dioxide in their coating (Figure 2).
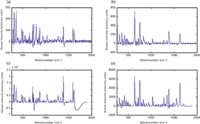
Figure 2: Baseline-corrected Raman spectra of (a) ciprofloxacin hydrochloride measured using the handheld instrument, (b) a Ciproxin tablet measured using the handheld instrument, (c) ciprofloxacin hydrochloride measured using the laboratory-based instrument, and (d) a Ciproxin tablet measured using the laboratory-based instrument.
This showed that the measured Raman activity was dependent on the concentration of the Raman active species. One way this Raman activity could be increased is by crushing the tablets to reduce the effect of the titanium dioxide that was present in the film coat. Figure 3 shows that the Raman scattering intensity of powdered Ciproxin tablet was double that of the intact Ciproxin tablet. This could be an option to increase the scattering intensity of compounds with low Raman activity or present in low concentrations in tablets. However, this only worked with the laboratory-based Raman instrument. Using the handheld instrument, the intact and powdered forms of the tablets had identical spectra.

Figure 3: Baseline-treated Raman spectra of (a) intact Ciproxin tablet and (b) a powdered Ciproxin tablet measured using the laboratory-based instrument.
An alternative way of increasing the measured Raman activity is to measure tablets in transmission mode using the laboratory-based instrument, although this was not done in the present work.
Comparison of Products Containing Different APIs
The authentication of products was tested by comparing 65 out of 67 products (Table I), which contained seven different APIs. Products containing clopidogrel hydrogen sulfate were excluded from this comparison because they did not give any Raman scattering when they were measured in their coated forms. As mentioned previously, the products were purchased from different countries and had variable shapes, sizes, colors, and % m/m of API. The baseline treated spectra of these products obtained from both instruments were compared using CWS and PCA methods.
The CWS method could not identify all the tablets measured by either instrument. Figure 4 shows the correlation map of the baseline-treated Raman spectra of tablets containing atorvastatin calcium trihydrate (numbers 1 to 13), cetirizine hydrochloride (14 to 20), ciprofloxacin hydrochloride (21 to 37), loratadine (38 to 41), risedronate sodium (42 to 47), valsartan/hydrochlorothiazide (48 to 57), and valsartan (58 to 65) measured using the handheld instrument (Figure 4a) and the laboratory-based instrument (Figure 4b). The correlation coefficient (r) values are displayed in color: negative values in dark blue and the highest positive values in dark red; r values in between these are in green, yellow, and orange for increasing values of r. A dark red color was expected to be obtained for tablets containing the same API and a yellow, green, or orange color was expected for tablets containing different APIs. However, this was not the case partly because some of the APIs were present in low concentrations in the tablets and also because of the noise in the spectra of these tablets. Thus, the CWS methods were used to compare both the scattering peaks as well as the noise.

Figure 4: Correlation map of the baseline-treated Raman spectra of tablets containing atorvastatin calcium trihydrate (product numbers 1â13), cetirizine hydrochloride (numbers 14â20), ciprofloxacin hydrochloride (numbers 21â37), loratadine (numbers 38â41), risedronate sodium (numbers 42â47), valsartan/hydrochlorothiazide (numbers 48â57), and valsartan (numbers 58â65) measured using (a) the handheld instrument and (b) the laboratory-based instrument.
Most tablets had low r values when their spectra were obtained using the handheld instrument. In this case, the lowest r values were as low as -0.0017 and were observed in two tablets containing atorvastatin calcium trihydrate. In addition, tablets containing cetirizine hydrochloride had r values as low as 0.02. However, the measured Raman signal was not due to the API; it was due to the titanium dioxide in the film coat. High r values were seen among some tablets containing ciprofloxacin hydrochloride (r = 0.98), loratadine (r = 0.97), risedronate sodium (r = 0.96), valsartan/hydrochlorothiazide (r = 0.96), and valsartan (r = 0.95). However, not all the r values of these tablets passed the threshold of 0.95 (Figure 4a).
On the other hand, the results of the CWS method of comparing the spectra obtained using the laboratory-based instrument were slightly better (Figure 4b). Whereas few low r values were obtained for tablets containing the same APIs, most of the tablets of the same API had r values above 0.95. For instance, the set of the loratadine-containing tablets all passed (r > 0.98). This was due to more signal and less noise encountered in the spectra obtained using the laboratory-based instrument.
Because of the equivocal identifications using the CWS method, a complementary method was needed to exclude the noise from the spectral comparison. PCA was examined as an alternative method because it classifies these tablets in order of decreasing variances. Thus, the most important variances caused by the Raman active species are displayed through the first few principal components; whereas the less important variances (for example, corresponding to spectral noise) are displayed in later principal components. Ciprofloxacin tablets were excluded from the PCA calculation as they were totally discriminated from the other tablet products; so they oriented the principal component scores plot of the other tablet products to one side. When PCA was applied to the spectra of the tablets obtained using the handheld instrument, it could not differentiate between the various products (Figure 5a). Thus, though the first two principal components accounted for 68.65% of the variance, an overlap of principal components was encountered among tablet products containing different APIs. This may be due to the complex matrices and the excipients that these tablets have in common (Table I). However, this was not the case when PCA was applied to the spectra of the same tablet products obtained using the laboratory-based instrument (Figure 5b). A clear discrimination was obtained among the different products when the first two principal components were plotted (82.94% variance). The only overlap observed was between tablet products containing valsartan or valsartan and hydrochlorothiazide. This was because the tablets had a common API (valsartan), similar excipients, and the hydrochlorothiazide was only present at 5% m/m. So for all practical purposes they contained the same Raman active species. Thus, the laboratory-based instrument had a better identification potential than the handheld instrument using the PCA method.
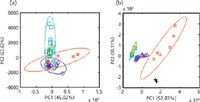
Figure 5: PCA scores plot of the baseline-treated Raman spectra of tablet products containing the following APIs: atorvastatin calcium trihydrate (blue), cetirizine hydrochloride (red), loratadine (black), risedronate sodium (magenta), valsartan and hydrochlorothiazide (cyan), and valsartan (yellow) measured by the (a) handheld instrument and (b) the laboratory-based instrument, with the 95% equal frequency ellipses drawn around each set.
Application to Counterfeit Tablets
To examine the potential of Raman spectroscopy to identify counterfeit medicines, the laboratory-based instrument was evaluated regarding the identification of a previously known counterfeit Plavix (clopidogrel hydrogen sulfate) tablet. The tablet had a thick film coat so that it could not be identified using either the laboratory-based or handheld instrument when measured in its coated form. However, when the coat of this tablet was removed, no signal could be observed using the handheld instrument. A signal was obtained, however, using the laboratory-based instrument. This signal could be easily distinguished from the signal of an authentic Plavix uncoated tablet by visual identification of the peaks (Figure 6). Thus, the laboratory-based instrument was able to identify counterfeit tablets better than the handheld instrument.
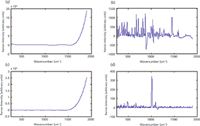
Figure 6: Baseline-treated Raman spectra of an authentic Plavix tablet in its (a) coated and (b) uncoated forms and a counterfeit Plavix tablet in its (c) coated and (d) uncoated forms measured by the laboratory-based instrument.
Conclusions
This work evaluated the authentication of tablets using handheld and laboratory-based Raman spectroscopic instruments. Whereas handheld Raman instruments offer the advantage of carrying the laboratory to the sample, they still lack the accuracy of identification of the laboratory-based instruments. The laboratory-based instruments can detect Raman active species at lower concentrations; thus, they are more sensitive. Also, they can operate in transmission mode which yields more signal than reflection mode. Spectral visualization would seem to be better than multivariate analysis methods for comparing the Raman spectra of tablet products. The CWS method, however, failed to identify all products correctly when it was applied to the spectra obtained from both instruments. However, the PCA method overcame this problem and was able to identify 68% of the products measured by the laboratory-based instrument. A great overlap was seen among the PCA scores applied to the products measured by the handheld instrument. In addition, unlike the handheld instrument, the laboratory-based instrument was able to identify counterfeit Plavix tablets.
References
(1) A.I. Wertheimer, N.M. Chaney, and T.M. Santella, J. Am. Pharm. Assoc. 43, 710–718 (2003).
(2) S.O. Alubo, Soc. Sci. Med. 38, 97–103 (1996).
(3)E. Kamol, "Lace with Poison," The Daily Star (2008) accessed on 09/04/2011.
(4) R. Martino, M. Malet-Martino, V. Gilard, and S. Balayssac, Anal. Bioanal. Chem. 398, 77–92 (2010).
(5) D. Taylor, "Trading in False Hope," The School of Pharmacy, University of London (2009).
(6) D.E. Bugay and P.A. Martoglio Smith, in Clarke's Analysis of Drugs and Poisons, 3rd edition, A.C. Moffat, M.D. Osselton, and B. Widdop, Eds. (Pharmaceutical Press, London, 2004), pp. 358–367.
(7)Y. Ozaki and S. Sasic, in Pharmaceutical Applications of Raman Spectroscopy, S. Sasic, Ed. (John Wiley and Sons Inc., Hoboken, New Jersey, 2008), pp. 1–29.
(8) C. Ricci, L. Nyadong, F. Yang, F.M. Fernandez, C.D. Brown, P.N. Newton, and S.G. Kazarian, Anal. Chim. Acta 623, 178–186 (2008).
(9) M. de Veij, P. Vandenabeele, K.A. Hall, F.M. Fernandez, M.D. Green, N.J. White, A.M. Dondrop, P.N. Newton, and L. Moens, J. Raman Spec. 38, 181–187 (2007).
(10) K.A. Hall, P.N. Newton, M.D. Green, M. de Veij, P. Vandenabeele, D. Pizzanelli, M. Mayxay, A. Dondorp, and F.M. Fernandez, American J. Trop. Med. Hygiene 75, 804–811 (2006).
(11) C. Ricci, C. Eliasson, N.A. Macleod, P.N. Newton, P. Matousek, and S.G. Kazarian, Anal. Bioanal. Chem. 389, 1525–1532 (2007).
(12) S. Trefi, C. Routaboul, S. Hamieh, V. Gilard, M. Malet-Martino, and R. Martino, J. Pharm. Biomed. Anal. 47, 103–113 (2008).
(13) P.-Y. Sacre, E. Deconinck, T. De Beer, P. Courselle, R. Vancauwenberghe, P. Chiap, J. Crommen, and J.O. De Beer, J. Pharm. Biomed. Anal. 53, 445–453 (2010).
(14) M.G. Orkoula and C.G. Kontoyannis, J. Pharm. Biomed. Anal. 47, 631–635 (2008).
(15) M. de Veij, A. Deneckere, P. Vandenabeele, D. de Kaste, and L. Moens, J. Pharm. Biomed. Anal. 46, 303–309 (2008).
(16) P. Matousek, F. Thorley, P. Chen, M. Hargreaves, C. Tombling, P. Loeffen, M. Bloomfield, and D. Andrews, Spectroscopy 26(3), 44–51 (2011).
(17)S. Assi, R.A. Watt, and A.C. Moffat, Eur. Pharm. Rev. 1, 49–55 (2011).
Sulaf Assi is a postdoctoral research fellow in the Department of Pharmacy at University of Hertfordshire, College Lane Campus, Hatfield, Hertfordshire, United Kingdom. Robert Watt is a senior lecturer (retired) at the Centre for Pharmaceutical Analysis at The School of Pharmacy, University of London, London, England. Tony Moffat is an emeritus professor of pharmaceutical analysis at The School of Pharmacy, University of London.
Portable and Wearable Spectrometers in Our Future
December 3rd 2024The following is a summary of selected articles published recently in Spectroscopy on the subject of handheld, portable, and wearable spectrometers representing a variety of analytical techniques and applications. Here we take a closer look at the ever shrinking world of spectroscopy devices and how they are used. As spectrometers progress from bulky lab instruments to compact, portable, and even wearable devices, the future of spectroscopy is transforming dramatically. These advancements enable real-time, on-site analysis across diverse industries, from healthcare to environmental monitoring. This summary article explores cutting-edge developments in miniaturized spectrometers and their expanding range of practical applications.
Q&A: Portable FT-IR Empowers On-Site Food Quality Assurance
February 1st 2024Exploring the transformative capabilities of handheld Fourier transform infrared (FT-IR) spectrometers, Luis Rodriguez-Saona of The Ohio State University emphasizes their pivotal role in ensuring food integrity and safety across the entire supply chain.
Portable Raman Spectrometers: How Small Can They Get?
June 1st 2023There is a growing desire among spectroscopists for having instruments small enough to be taken to the sample, as opposed to bringing the sample to the instrument. The result is that Raman spectrometers are becoming more miniaturized. Because these instruments come at a lower cost and offer distinct advantages over traditional spectrometers, the expectation is that a rapid expansion of when these instruments are applied will come forthwith. We offer a preview of how future miniaturized Raman spectrometers might look.
