Confocal Raman AFM Imaging of Paper
Special Issues
A better understanding of the micro- and nanostructures of cellulose fiber composition before and after various chemical treatments, together with the distribution of bleaching additives to the final paper composition, is essential for further improvements of paper properties. Confocal Raman imaging is a valuable tool for such studies, as it reveals not only optical information but also information regarding the 3D distribution of the chemical compounds in the submicrometer range. In the paper surface finishing process, additional surface roughness parameters can be measured by combining confocal Raman microscopy with atomic force microscopy. Such combined analytical microscopes allow a direct linking between high-resolution imaging and chemical identification of various species on a surface.
Papermaking is a 2000 year-old industry that has launched a revolution in communication, packaging, and personal care products. Over the centuries, paper has made a great contribution to civilization and still contributes to the rapid advancement of every other industry. Paper is produced by pressing together moist fibers, typically cellulose pulp derived from wood, rags, or grasses, and drying them into flexible sheets. These plant fibers consist of cellulose, hemicelluloses, lignin, and small quantities of extractives. Confocal Raman microscopy, a chemically sensitive imaging technique, has been used to study the distribution of such materials in plant fibers with submicrometer resolution (1–3).
The aim of this contribution is to present examples of confocal Raman and atomic force microscopy (AFM) measurements from various stages of the paper manufacturing process followed by examples where such measurements give more insight into printing and writing on paper.
Experimental Methods
All experiments were performed with the alpha 300 R or alpha500 R confocal Raman microscope (WITec GmbH, Ulm, Germany), whereas combined Raman and AFM measurements were performed with an alpha 300 RA microscope (WITec). With the first two instruments mentioned, it is possible to analyze the same sample position with various measuring techniques.
The confocal Raman microscope can be equipped with various excitation lasers. For the measurements presented in this article, either a frequency-doubled NdYAG laser with λ = 532 nm (in the following called green laser) or a diode laser with λ = 785 nm (in the following called NIR laser) were used. The excitation light was polarized horizontally (in the x-direction) with respect to the Raman image.
The distribution of various chemical species on the sample was obtained in Raman spectral imaging mode. In this imaging mode, a complete Raman spectrum is recorded at every imaging point, leading to a 2D array of Raman spectra. By extracting individual features such as Raman peak intensity, peak width, or peak position from the recorded 2D arrays of spectra, various Raman images can be calculated. Furthermore, fitting algorithms can be employed to extract additional images from the recorded 2D arrays of Raman spectra (4).
The acquisition time for a Raman spectrum within a 2D spectral array was only a few milliseconds, thus allowing the acquisition of thousands of Raman spectra within minutes. The number of pixels and the integration times per spectrum are listed in the figure captions of the corresponding Raman image throughout this article.
By rotating the microscope turret, it is possible to switch from confocal Raman microscopy to AFM without losing the sample location. The samples were imaged in AFM AC mode using ArrowFM cantilevers (Nanoworld, Germany) with a resonance frequency in the range of 70–90 kHz and damping of r = 50%, recording both topography and phase images simultaneously.
Results and Discussion
Paper production: High-quality paper for writing and printing requires chemical pulping. In this process, the chemical structure of lignin is destroyed and dissolved in the pulp and can be washed off the cellulose fibers. Here, the spectral differences of pure cellulose are first illustrated, followed by the analysis of residues on cellulose fibers.
Raman imaging of a pure cellulose paper web: Figure 1a shows the white light image of a paper web consisting of pure cellulose fibers. The red square in this white light image indicates the area scanned in Raman spectral imaging mode using green excitation (λ = 532 nm) and a high numerical aperture air objective. An area of 50 μm × 50 μm was scanned and a 2D spectral array of 128 × 128 complete Raman spectra was recorded with an integration time of 80 ms/spectrum. From this 2D spectral array, two distinct spectra for cellulose were extracted (Figure 1b). The assignment of the various Raman bands characteristic for cellulose can be found in (4,5). A significant difference between the two spectra can be seen in the intensity variation of the Raman bands at 1095 cm-1 and 1118 cm-1. These two bands are characteristic for C-O and C-C stretching, respectively, and are laser polarization direction dependent. The distribution of these two Raman spectra over the examined surface area is presented in Figure 1c. The color of the spectra in Figure 1b matches the color in the Raman image. Thus, pixels that are bright green show a high spectral similarity to the green spectrum, whereas bright red pixels show a high spectral similarity to the red spectrum. The laser polarization direction is indicated with the white arrow in Figure 1c. Fibers oriented in parallel to the laser polarization direction show an increased C-O stretching band at 1095 cm-1 (red color) compared to fibers oriented perpendicular to the laser polarization direction (green color). Thus, confocal Raman microscopy reveals the orientation of cellulose fibers in the paper web.
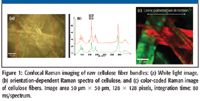
Figure 1
Raman and AFM imaging of residues on cellulose fibers: The small quantities of extractives such as resin acids, triglycerides, steryl esters, fatty acids, sterols, and lignins can be extracted from wood by using solvents such as acetone or dichloromethane. During the papermaking process, these extractives are released partly in the circulation water. Today, efforts are made to decrease the water consumption in paper mills. Hence, water is recirculated in the process, which leads to a build-up of dissolved and colloidal substances. The enrichment of extractives in the circulating waters, in particular, leads to problems such as precipitates, paper strength decreases, and foaming. The following two examples show two different studies of residues on cellulose fibers.
Figure 2 shows an example of a study of resin distribution in paper. For this experiment, a sheet of paper was soaked in water to reduce the strong fluorescence of the sample. The alpha300R system was equipped with an NIR excitation laser and a back-illuminated deep depletion CCD camera. A water immersion objective (NA = 1.0) was used for these measurements. The white light image in Figure 2a shows several cellulose fibers oriented almost perpendicular to the polarization direction of the laser. The red square denotes the in-plane (x-y) scanned area of 45 μm × 17 μm. The blue line indicates where the depth (x-z) scan was performed. For the in-plane scan an array of 100 × 100 Raman spectra was recorded with an integration time of 0.112 s/spectrum. Figure 2b shows the characteristic Raman spectra extracted from the spectral array. The distribution of cellulose (red) and resin (green) on the analyzed sample area is shown in Figure 2c. This image shows that the resin is distributed between the analyzed fibers. Figure 2d shows a depth (x-z) scan of the sample. In this case an array of 100 × 100 Raman spectra was recorded over a range of 45 μm × 40 μm. The color-coded image presented in Figure 2d clearly shows that the resin is surrounding the cellulose fiber, without penetrating into it.

Figure 2
A further confocal Raman AFM survey was performed to detect traces of wood extractives on pure cellulose fibers. An area of 20 μm × 40 μm was scanned in Raman spectral imaging mode by acquiring a spectral array of 80 × 160 complete Raman spectra. From this spectral array, three distinct spectra were evaluated as shown in Figure 3a. The green and blue spectra are the orientation-dependent Raman spectra of cellulose, whereas the red spectrum could be attributed to hexane-extractives, forming a very thin layer on the cellulose fiber (4). The distribution of these three chemical compounds on the analyzed sample area is shown in the color-coded Raman image (Figure 3b). The white rectangle in Figure 3b marks the area that was imaged in AFM AC mode. Figure 3c shows the topography image of a fiber bundle consisting of small, oriented fibrils, characteristic for cellulose fibers. The simultaneously recorded phase image (Figure 3d) reveals in the central part an additional contrast which can be attributed to the hexane extractive. High resolution AFM AC images recorded from this region are shown in Figure 3e (topography image) and Figure 3f (phase image). The hexane extractives show a clear contrast in the phase image, revealing the material with different mechanical properties than the cellulose fibrils underneath.
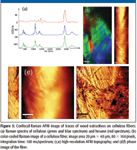
Figure 3
Paper Finishing: To provide a surface more suitable for high-resolution halftone screening, the raw paper is coated with a thin layer of calcium carbonate and other additives. Figure 4 shows the distribution of calcium carbonate on a coated paper. This image was obtained with the green laser (λ = 532 nm) and a 40 × air objective (NA = 0.6). An area of 150 μm× 150 μm was scanned in Raman spectral imaging mode and an array of 150 × 150 Raman spectra were recorded with an integration time of 0.09 s/spectrum. Red and green in Figure 4 denote the different orientation of the cellulose fibers, whereas blue shows the distribution of calcite on the paper.
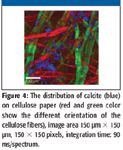
Figure 4
Figure 5 shows additional additives in the paper coating, leading to a higher halftone screen of the paper surface. In addition to calcite (blue color), this coating also contains starch grains (red color) and a polymer matrix (green color). The cellulose is shown in yellow color in this image without specific labeling of the fiber orientation.
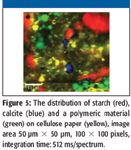
Figure 5
AFM also can contribute to the analysis of paper finishing with high-resolution images, describing the surface roughness of the paper (Figure 6). The topography of raw paper is shown in Figure 6a, revealing the fibrillar fine structure of cellulose fibers. This surface is rather rough and cannot be used for writing or printing. In Figure 6b and 6c, the topography of laminated paper is shown after applying one and two laminations, respectively. The roughness parameters calculated from these differently processed paper surfaces are summarized in Table I (6).

Figure 6
The combined Raman-AFM approach thus gives insight into the chemical nature of the additives and laminates as well as their effect on the surface roughness.

Table I: Roughness parameters
Writing and Printing on Paper: In the following examples, a combined printing and ballpoint mark on paper is analyzed to show that by using Raman imaging it is possible to distinguish printer ink from ballpoint pen ink. These experiments require the analysis of large sample areas, in the range of several millimeter, therefore the alpha500 R microscope equipped with a green laser and a 50× air objective (NA = 0.5) was used. In a first measurement, the chemical composition of the printer ink distributed on paper was examined. A sample area of 3 mm × 2 mm was imaged in Raman spectral imaging mode by acquiring an array of 150 × 150 Raman spectra with an integration time of 0.16 s/spectrum. From this array, three different spectra were evaluated as shown in red and yellow color in Figure 7a, whereas the third spectrum (not presented) showed strong fluorescence. The red spectrum is characteristic for the coated printer paper, whereas the yellow spectrum corresponds to the printing material used to produce a yellow printed line as shown in the color-coded Raman image in Figure 7b. Additionally, in the printer ink, strongly fluorescent particles (represented in green in Figure 7b) could be detected, which are distributed randomly over the printed line. This image shows that the yellow printed line can be visualized clearly by confocal Raman imaging. In a second experiment, a ballpoint pen line was drawn across the border between printed line and plain paper. A large area scan of 0.8 mm × 1.3 mm was performed over the border between paper, printed line, and ballpoint pen writing. The distribution of paper, printed line, and ballpoint pen mark is shown in Figure 7c. The ink of the ballpoint pen (blue in Figure 10a and 10c) shows significant spectral differences compared to the ink used in the printer.

Figure 7
The measurements presented in this section show, that confocal Raman imaging can contribute to the analysis of forensic material, providing information regarding used printing material and the order in which they were applied.
Summary
It could be shown that confocal Raman imaging combined with high-resolution AFM can contribute to a more detailed understanding of the micro- and nanostructures of paper. Confocal Raman microscopy provides information about the orientation of cellulose fibers resulting from the first step of paper production. In addition, several chemical residues from circulating water or wood extractives on cellulose fibers could be identified uniquely. The roughness of various finishing of papers could be determined on the nm scale using AFM.
Furthermore, the distribution of various coating components such as calcite, starch, and polymeric material on cellulose fibers were identified using confocal Raman imaging. Various coating layers can be analyzed destruction-free, without laborious sample preparation.
U. Schmidt, A. Jauss, T. Dieing, and O. Hollricher are with WITec GmbH, Ulm, Germany.
References
(1) N. Gierlinger, L. Sapei, and O. Paris, Planta 227, 969–980 (2008).
(2) N. Gierlinger and M. Schwamminger Spectroscopy 21, 69–89 (2007).
(3) "Characterization of Wood Cells and Cellulose Fibers," WITec Application Note, www.witec.de.
(4) M. Österberg, U. Schmidt, and A.-S. Jääskeläinen, Colloids and Surfaces 291, 197–201 (2006).
(5) P. Eronen and M. Österberg, Cellulose J. 16, 167–178 (2009).
AI-Powered SERS Spectroscopy Breakthrough Boosts Safety of Medicinal Food Products
April 16th 2025A new deep learning-enhanced spectroscopic platform—SERSome—developed by researchers in China and Finland, identifies medicinal and edible homologs (MEHs) with 98% accuracy. This innovation could revolutionize safety and quality control in the growing MEH market.
New Raman Spectroscopy Method Enhances Real-Time Monitoring Across Fermentation Processes
April 15th 2025Researchers at Delft University of Technology have developed a novel method using single compound spectra to enhance the transferability and accuracy of Raman spectroscopy models for real-time fermentation monitoring.
Nanometer-Scale Studies Using Tip Enhanced Raman Spectroscopy
February 8th 2013Volker Deckert, the winner of the 2013 Charles Mann Award, is advancing the use of tip enhanced Raman spectroscopy (TERS) to push the lateral resolution of vibrational spectroscopy well below the Abbe limit, to achieve single-molecule sensitivity. Because the tip can be moved with sub-nanometer precision, structural information with unmatched spatial resolution can be achieved without the need of specific labels.
